Report from Norges Bank Watch 2025
Remarks by Pål Longva, Deputy Governor of Norges Bank, 27 February 2025.
In February/March each year, the Centre for Monetary Economics (CME) presents a report commissioned by the Ministry of Finance on Norges Bank’s monetary policy. A committee of independent economists assesses Norges Bank’s conduct of monetary policy. The reports are published by the CME in its Norges Bank Watch Report Series.
First, I would like to thank the members of this year’s committee. A regular assessment of our conduct of monetary policy by an external body is both useful and important. I would also like to thank the Centre for Monetary Economics for hosting this event and for the opportunity to comment on the report.
Let me begin by saying a few words about the conduct of monetary policy in 2024 before commenting on three topics raised by Norges Bank Watch (NBW): how we take international trends into account, our communication of uncertainty and, finally, the trade-offs we make in monetary policy.
Monetary policy in 2024
The year 2024 was characterised by inflation slowing considerably from a high level and moving closer to the 2 percent target. Economic growth has been low in recent years, but registered unemployment has nevertheless remained below pre-pandemic levels. In our neighbouring countries, central banks started to lower policy rates. In Norway, the Monetary Policy and Financial Stability Committee decided to keep the policy rate unchanged throughout 2024. As commented by the NBW, our policy rate decisions were well in line with market expectations. As summarised in Chart 1: This was a year when the policy rate was stable and the policy rate forecast showed little change, a situation very different from 2023.
Chart 1: Stable policy rate and little change in the policy rate forecast in 2024.
Policy rate. Projections five most recent reports. Percent. 2018 Q1–2027 Q4
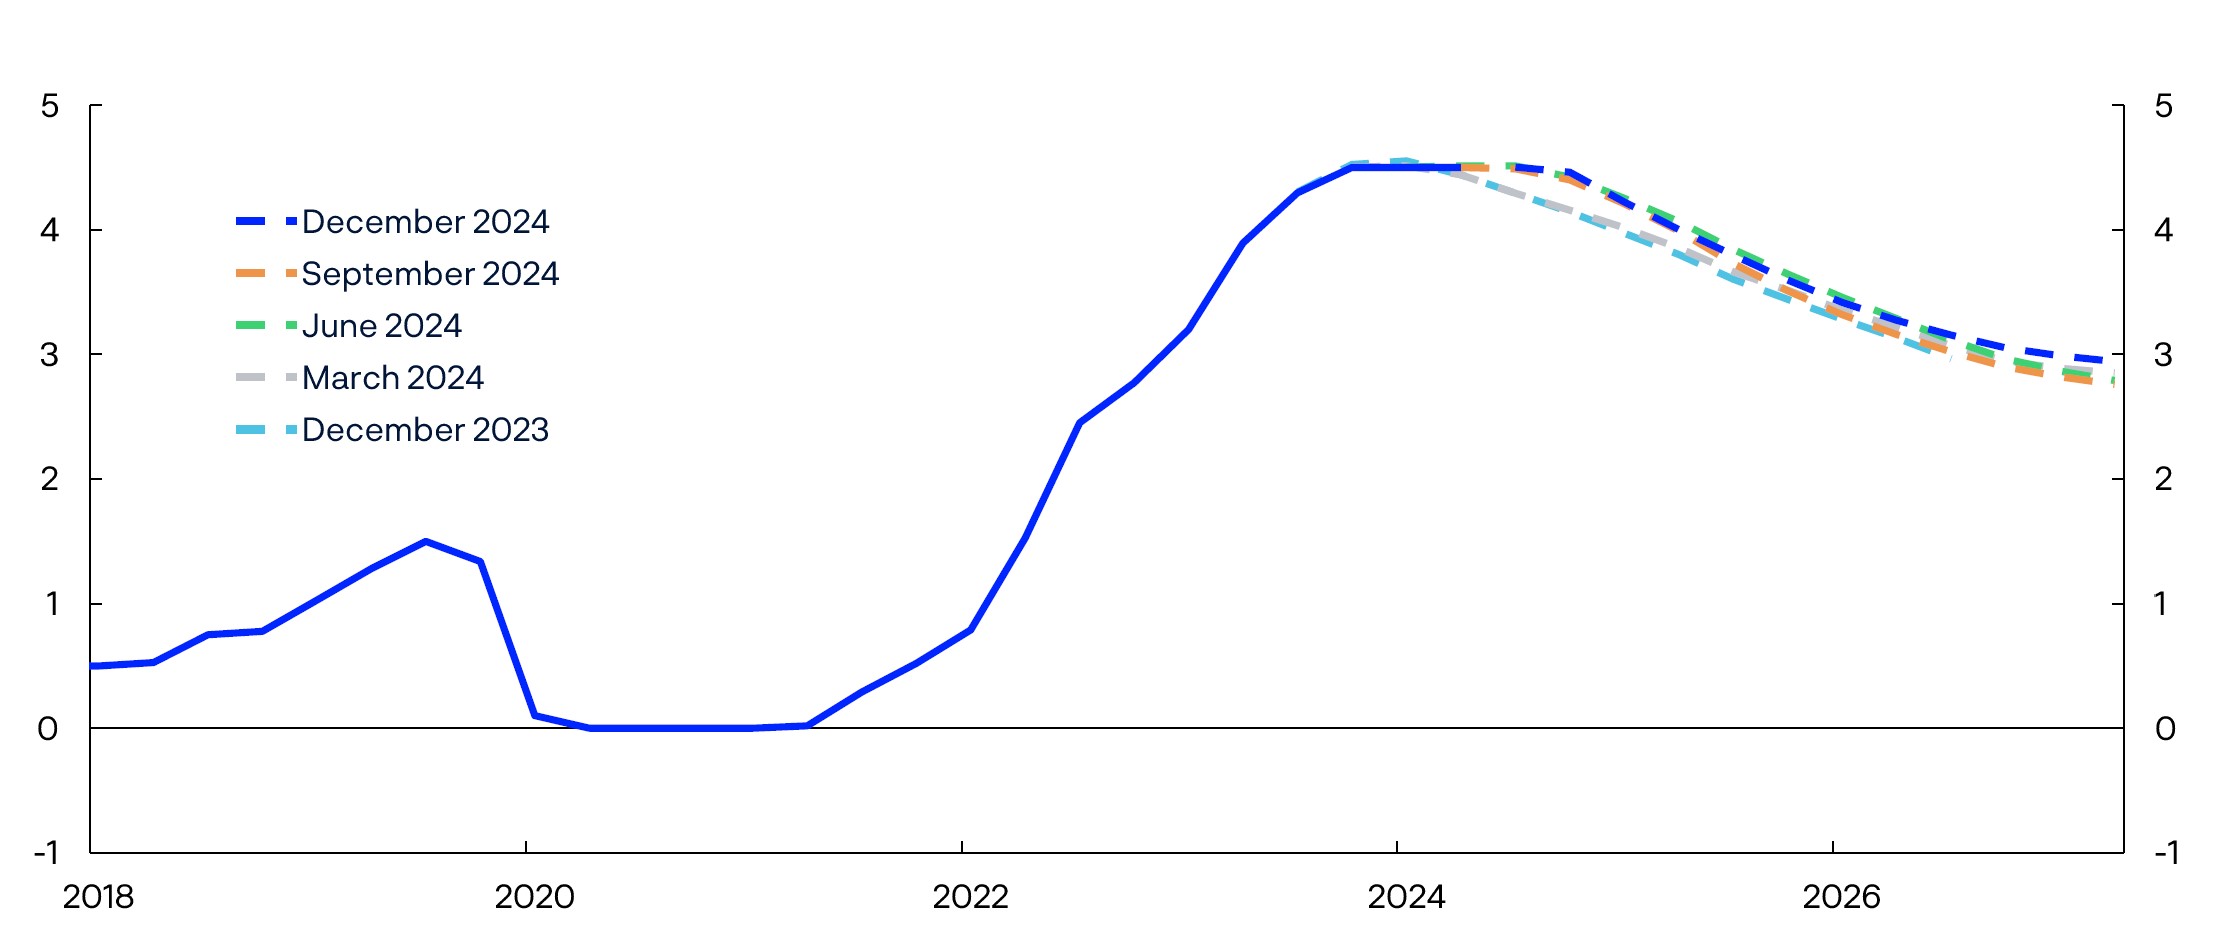
Source: Norges Bank
Through autumn, the policy rate was kept unchanged in Norway, while the policy rate was reduced in the US. The NBW points out that this happened at the same time as the krone depreciated against the US dollar. In our view, an increase in the policy rate differential in itself does not necessarily affect the krone exchange rate. What we have previously pointed out, is that there is a correlation between changes in the expected future policy rate differential and the exchange rate. In addition, the krone exchange rate is affected by many other factors.
Let me now turn to our inflation projections and the fact that they were persistently too high in 2024. In the turbulent years behind us, inflation rose to levels not seen in decades, driven by the pandemic, an expansionary economic policy and Russia’s invasion of Ukraine. It has been challenging to project inflation, both when it moved up and when it was heading down again. It is difficult to find a single factor that can explain why our inflation projections were too high. When inflation was on the rise, it increased more rapidly than historical relationships would suggest, and the subsequent speed of disinflation was also faster. One possible hypothesis is that the pass-through from costs to prices has been faster than previously. This means that the cost increases faced by firms in the wake of the pandemic were more rapidly passed on through higher prices, and this may have resulted in faster disinflation once costs stopped rising.
International developments
One of the topics in the report, which was also cited last year, is how we take into account international developments. The NBW’s opinion is that our domestic inflation projections could have been more accurate if we had given more weight to global inflation developments. In this, we agree with the NBW. One of the lessons learned in recent years is that we must better incorporate international impulses, also from the supply side, into our analyses. The NBW encourages us to develop methods for deciding when transitioning into “international mode” is appropriate, ie giving more weight to international developments. In Norges Bank’s opinion, it may be demanding to take into account international developments in such an on-off manner. We must monitor international developments closely and, to the best of our ability, constantly assess how different shocks will affect the Norwegian economy.
Chart 2 shows contributions to inflation, both historically and in our projections. The blue bars show all the underlying driving forces included in our models and the red bars show unexplained contributions, which we have called residual terms. The underlying driving forces include, among other things, unit labour costs, the krone exchange rate and various international impulses. We have long had an indicator of price developments for imported consumer goods. In recent years, we have also constructed a new indicator that captures the contribution made by indirect price impulses via imported intermediate and capital goods used by firms in production. Even with the new indicator, we were unable to capture everything that drove inflation developments. We took this on board and several times made discretionary adjustments to the projections beyond what our models projected. The adjustments made to the projections in December 2024 are shown in the large shaded bars with residual terms in Chart 2. In this connection, I would like to mention that Norges Bank has an ongoing model project where one of the objectives is precisely to take into better account international developments in our macro model. In that respect, the analysis by the NBW is interesting and something that we will take into account in our work to further improve our projections.
Chart 2: Our models failed to capture inflation developments
Contribution to four-quarter change in CPI-ATE. Percentage points. 2018 Q1–2027 Q4
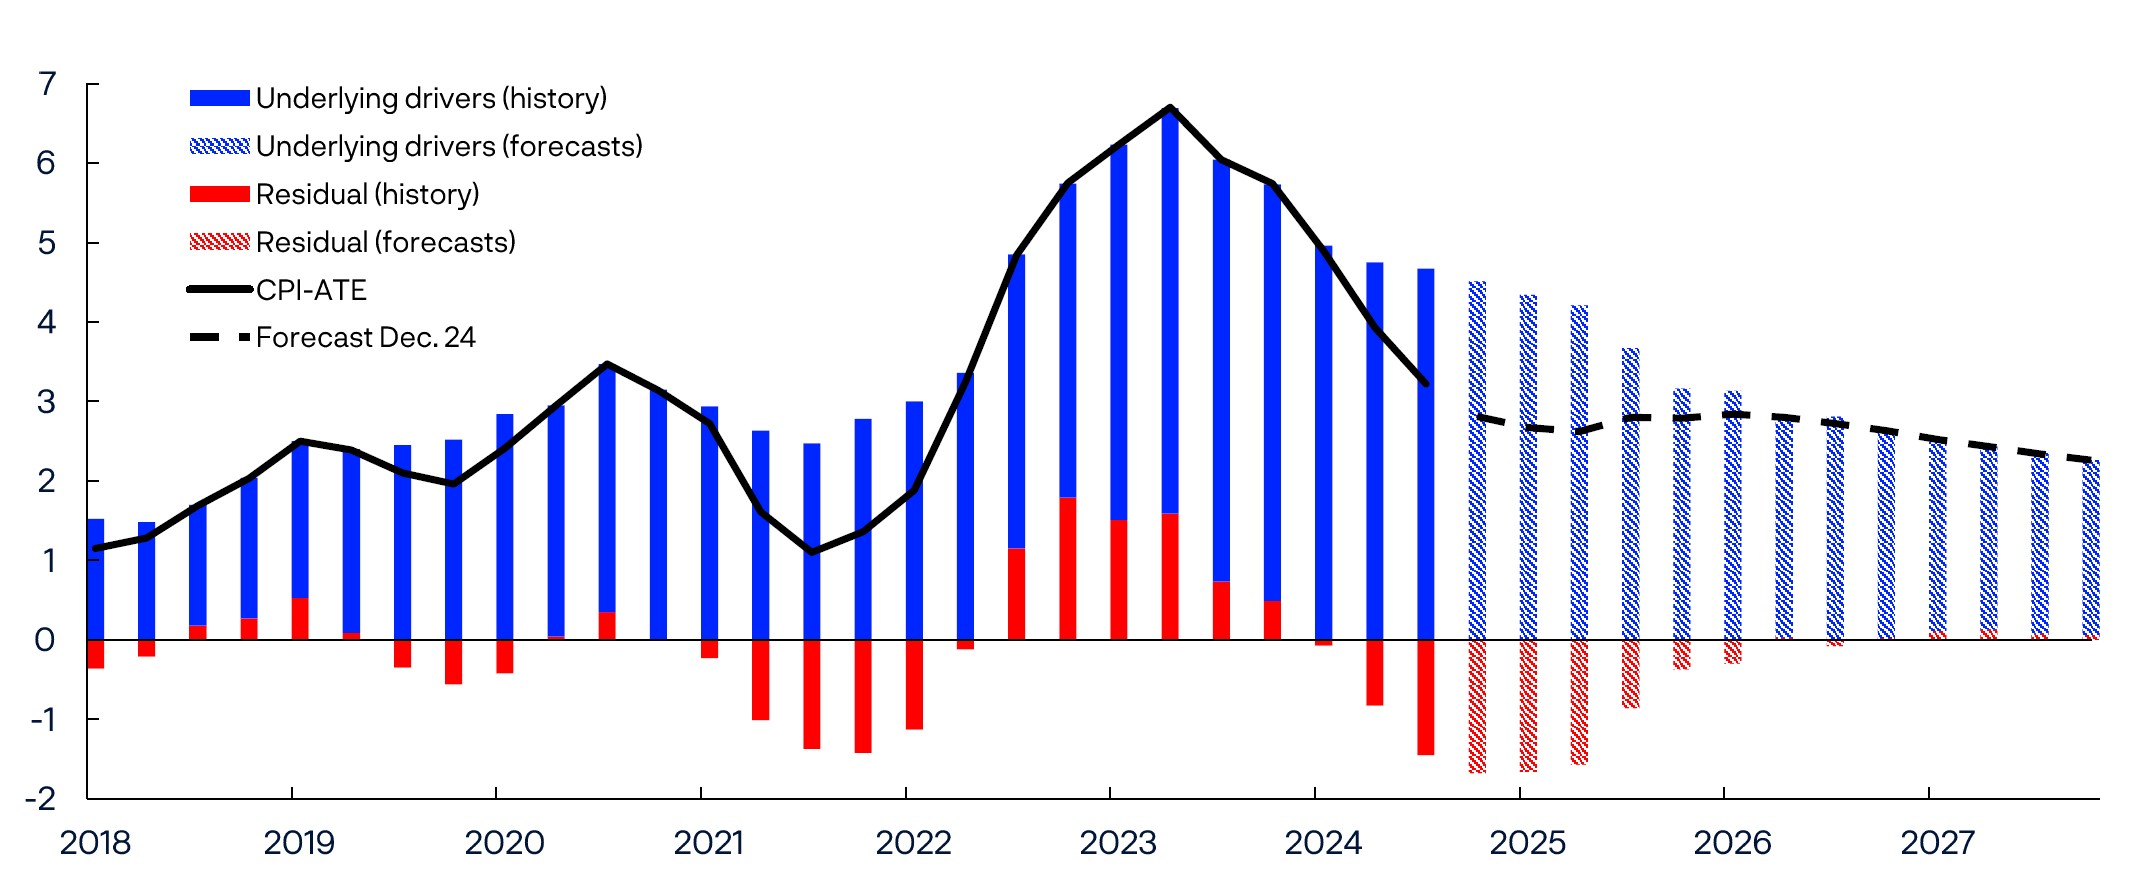
Sources: Statistics Norway and Norges Bank
Communication of uncertainty
Another topic raised by the NBW is how Norges Bank communicates uncertainty. In the report, the NBW refers to the quantitative measures of uncertainty published in the monetary policy reports (Chart 3). These measures of uncertainty show that there was an upside risk for inflation also in 2024, although it did decline towards the end of the year.
Chart 3: Upside risk for inflation in 2024
Spread between percentiles and median from quantile regressions. Eight quarters ahead. Four-quarter change in the CPI-ATE. Percentage points. 2021 Q1–2024 Q3

Source: Norges Bank
The NBW encourages us to use and further develop quantitative measures of uncertainty to an even greater extent. We have plans to develop more measures of uncertainty. For example, we are considering a greater use of option prices. Option prices will reflect market pricing of risk ahead, for example related to energy prices, global interest rates and exchange rates. I have included an example in Chart 4, showing so-called implied volatility, or the standard deviation in percent, three months ahead for the krone exchange rate measured against the US dollar. If implied volatility is approximately 5 percent, as it has been in February, these option prices indicate that neither we in Norges Bank nor firms and households should be surprised if the krone exchange rate measured against the dollar is 5 percent stronger or weaker in three months’ time. This may be useful information for firms and households when they make assessments and decisions.
Chart 4: Option prices can provide some indication of risk ahead
USDNOK. 3-month implied volatility. Percent. 1 Jan 2019 – 25 Feb 2025
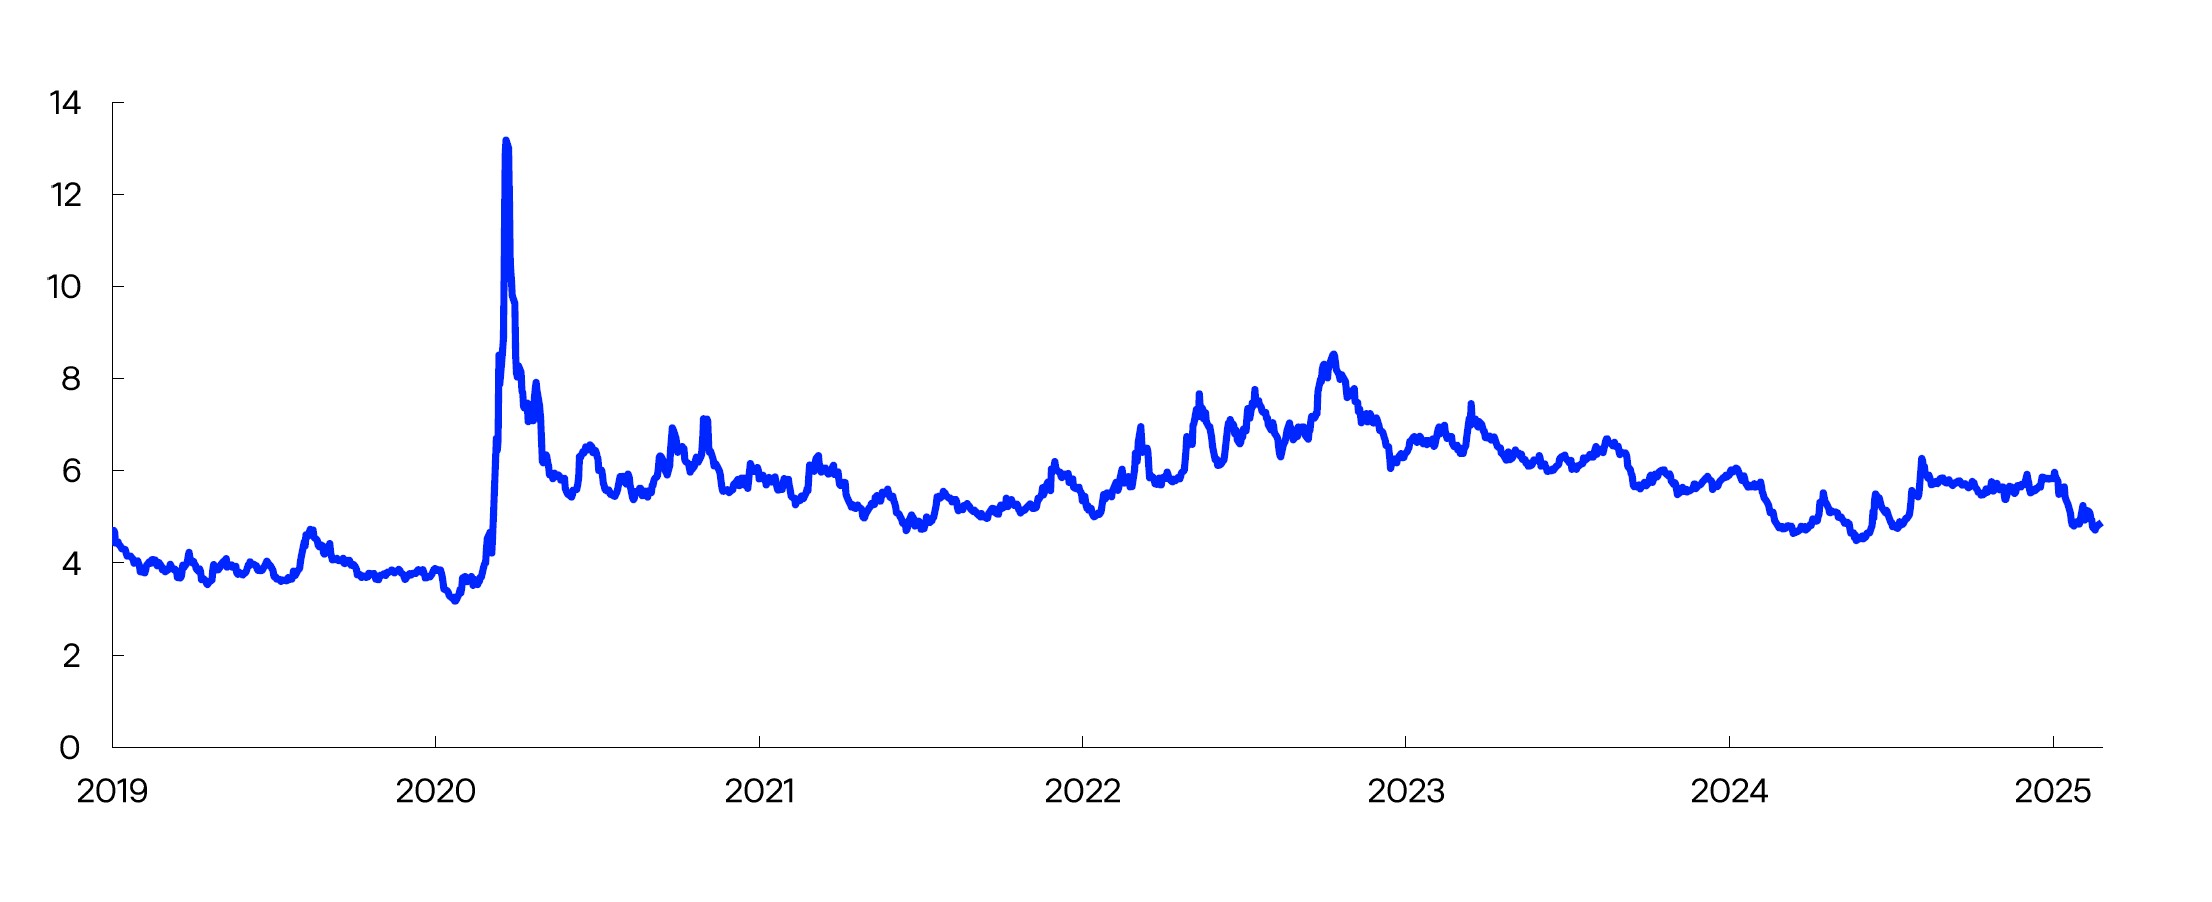
Sources: Bloomberg and Norges Bank
Option prices may also provide us with information as to whether there is asymmetric risk related to our projections, ie a specific upside or downside risk. If we examine the entire estimated probability distribution of the krone exchange rate three months ahead (Chart 5) based on option prices from 25 February, we note that this is asymmetric[1]. According to this distribution, there is a 5 percent probability that the krone exchange rate depreciates by more than 9.3 percent, and a 5 percent probability that it appreciates by more than 7.8 percent. Another way of reading the chart is that the market prices in a higher likelihood of a considerable depreciation of the krone than a considerable appreciation. We can then use this to communicate how our other projections would be affected in the event of such alternative krone exchange rate developments.
Chart 5: Option prices can provide some indication about asymmetric uncertainty
Option-based expectation for USDNOK three months ahead as of 25 Feb 2025
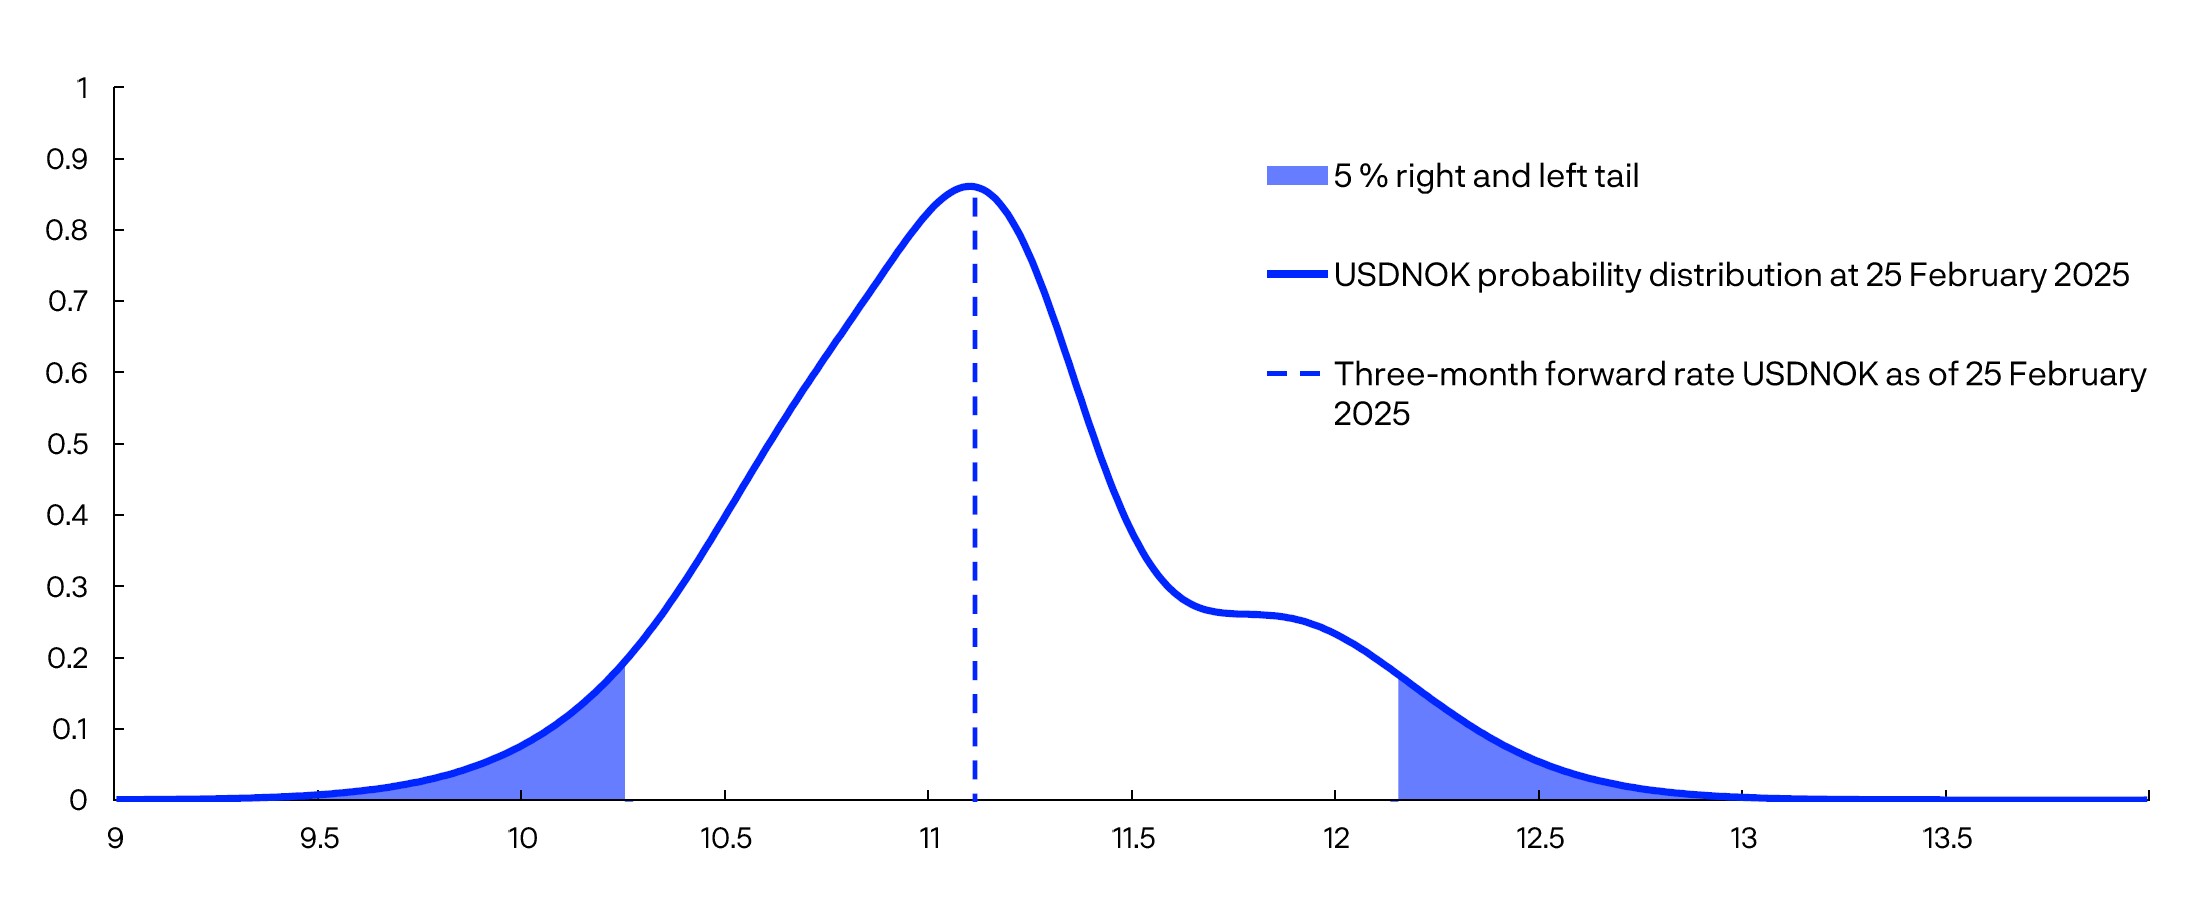
Sources: Bloomberg and Norges Bank
Monetary policy trade-offs
The last topic I would like to comment on is the trade-offs we make in monetary policy. The NBW asks an important question: Could the trade-offs made in 2024 have been better if our inflation projections had been more accurate?
Analyses from the NBW suggest that, despite inaccurate inflation projections, the policy rate is at an appropriate level. One of the reasons for this may be that the Norwegian economy performed better than expected in 2024.
Chart 6: Lower inflation than expected, but higher activity
CPI-ATE. Four-quarter change. Percent. Output gap. Percent. 2018 Q1–2026 Q4
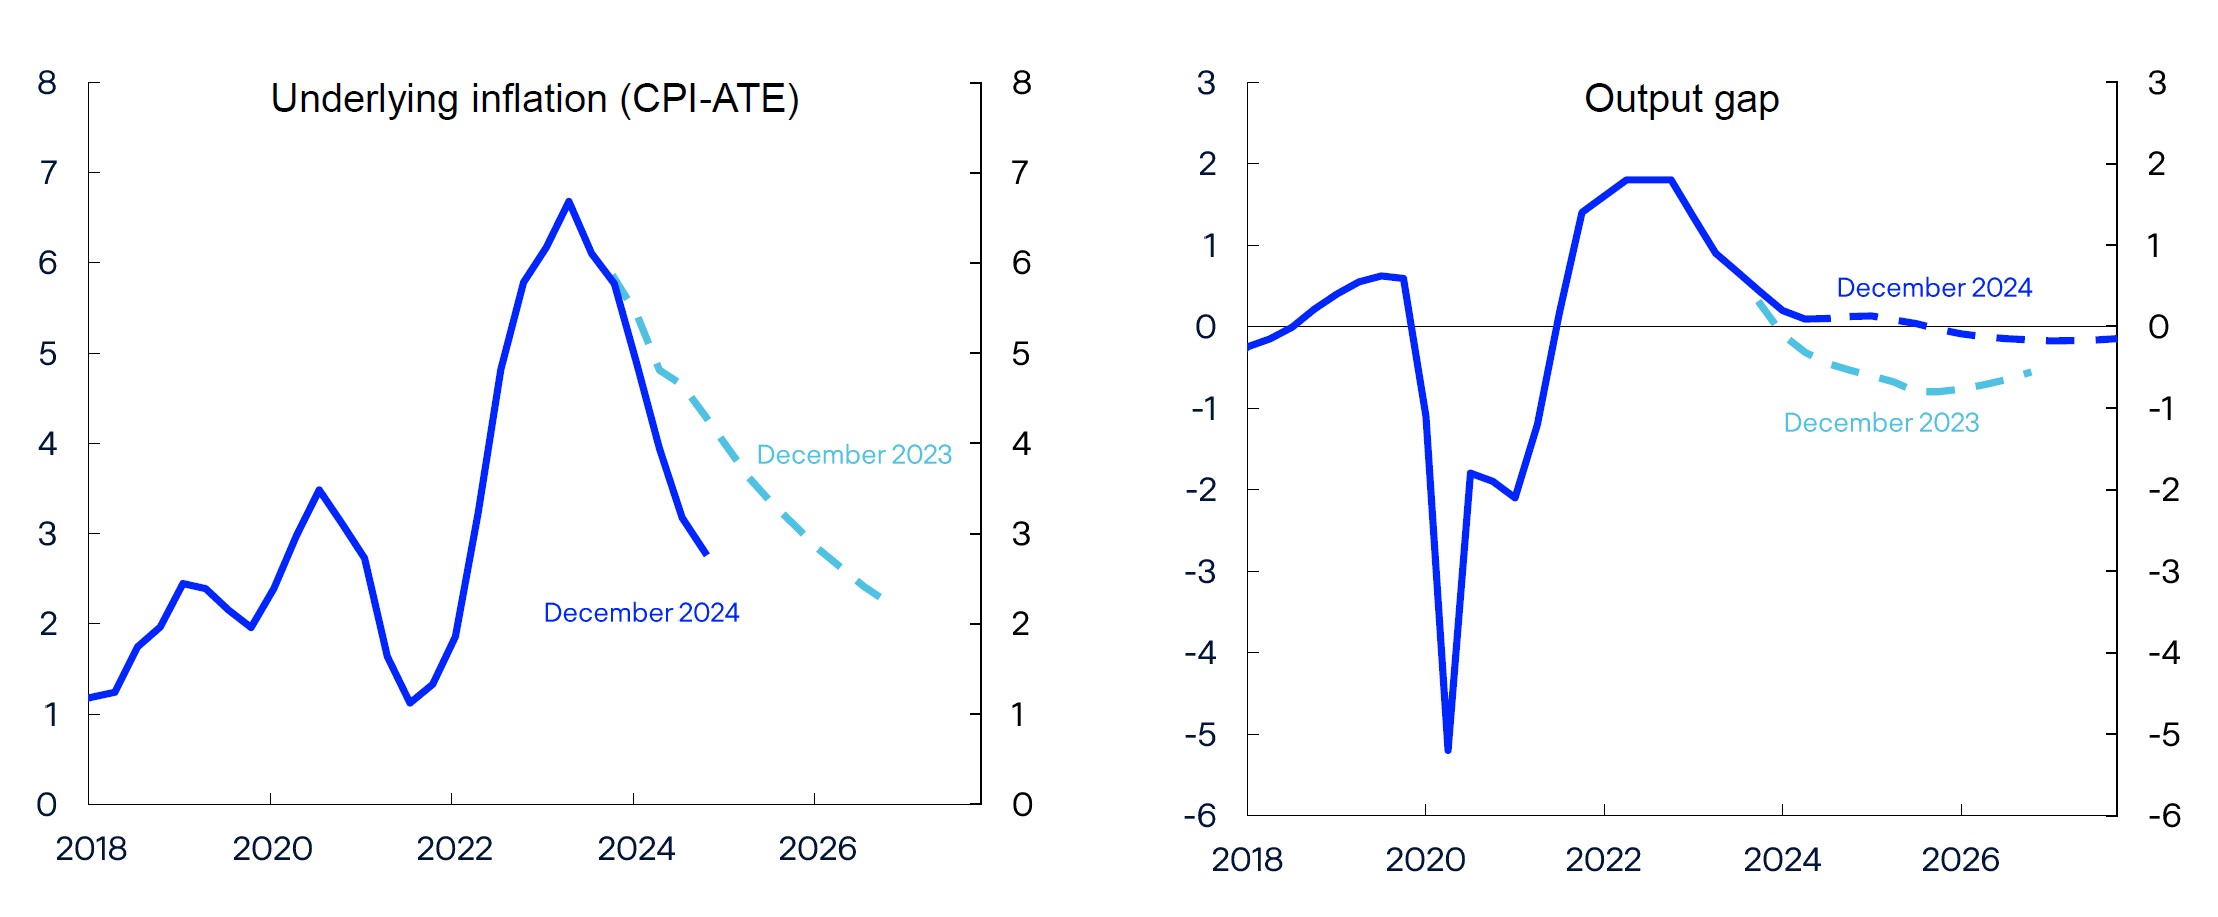
Sources: Statistics Norway and Norges Bank
In monetary policy, we have to constantly strike a balance between different considerations. In the long term, there is no conflict between low and stable inflation and high and stable employment. But in the short term, shocks could occur that give rise to a conflict between these two considerations, and then we must weigh these two considerations against each other. As the NBW notes, we updated our monetary policy strategy in 2024. The strategy describes how we in the Monetary Policy and Financial Stability Committee interpret our mandate. When we presented the updated strategy, we specified that we interpret our mandate to mean that we must give considerable weight to employment, also in situations when inflation deviates significantly from the target. This interpretation was also fundamental to the monetary policy stance before we updated the strategy.
One expression of the trade-offs made by the Committee is the inflation and output gap projections published in the Monetary Policy Reports. The January 2024 Monetary Policy Report included a box on these trade-offs, which the NBW also refers to and uses in its analyses. Among other things, the NBW finds that we gave considerable weight to output gap developments in 2024. Chart 7 shows the projections one to three years ahead for the output gap and the inflation gap (measured as deviations from the inflation target) published in various monetary policy reports going back to 2005. The chart illustrates how the attainment of monetary policy objectives changes from one monetary policy report to another. The chart also shows that in recent years we have moved southeast and closer to the centre of the chart, where both gaps are close to zero, suggesting prospects for a better attainment of monetary policy objectives.
Chart 7: Monetary policy trade-offs
Inflation gap and output gap. Average 1-3 years ahead
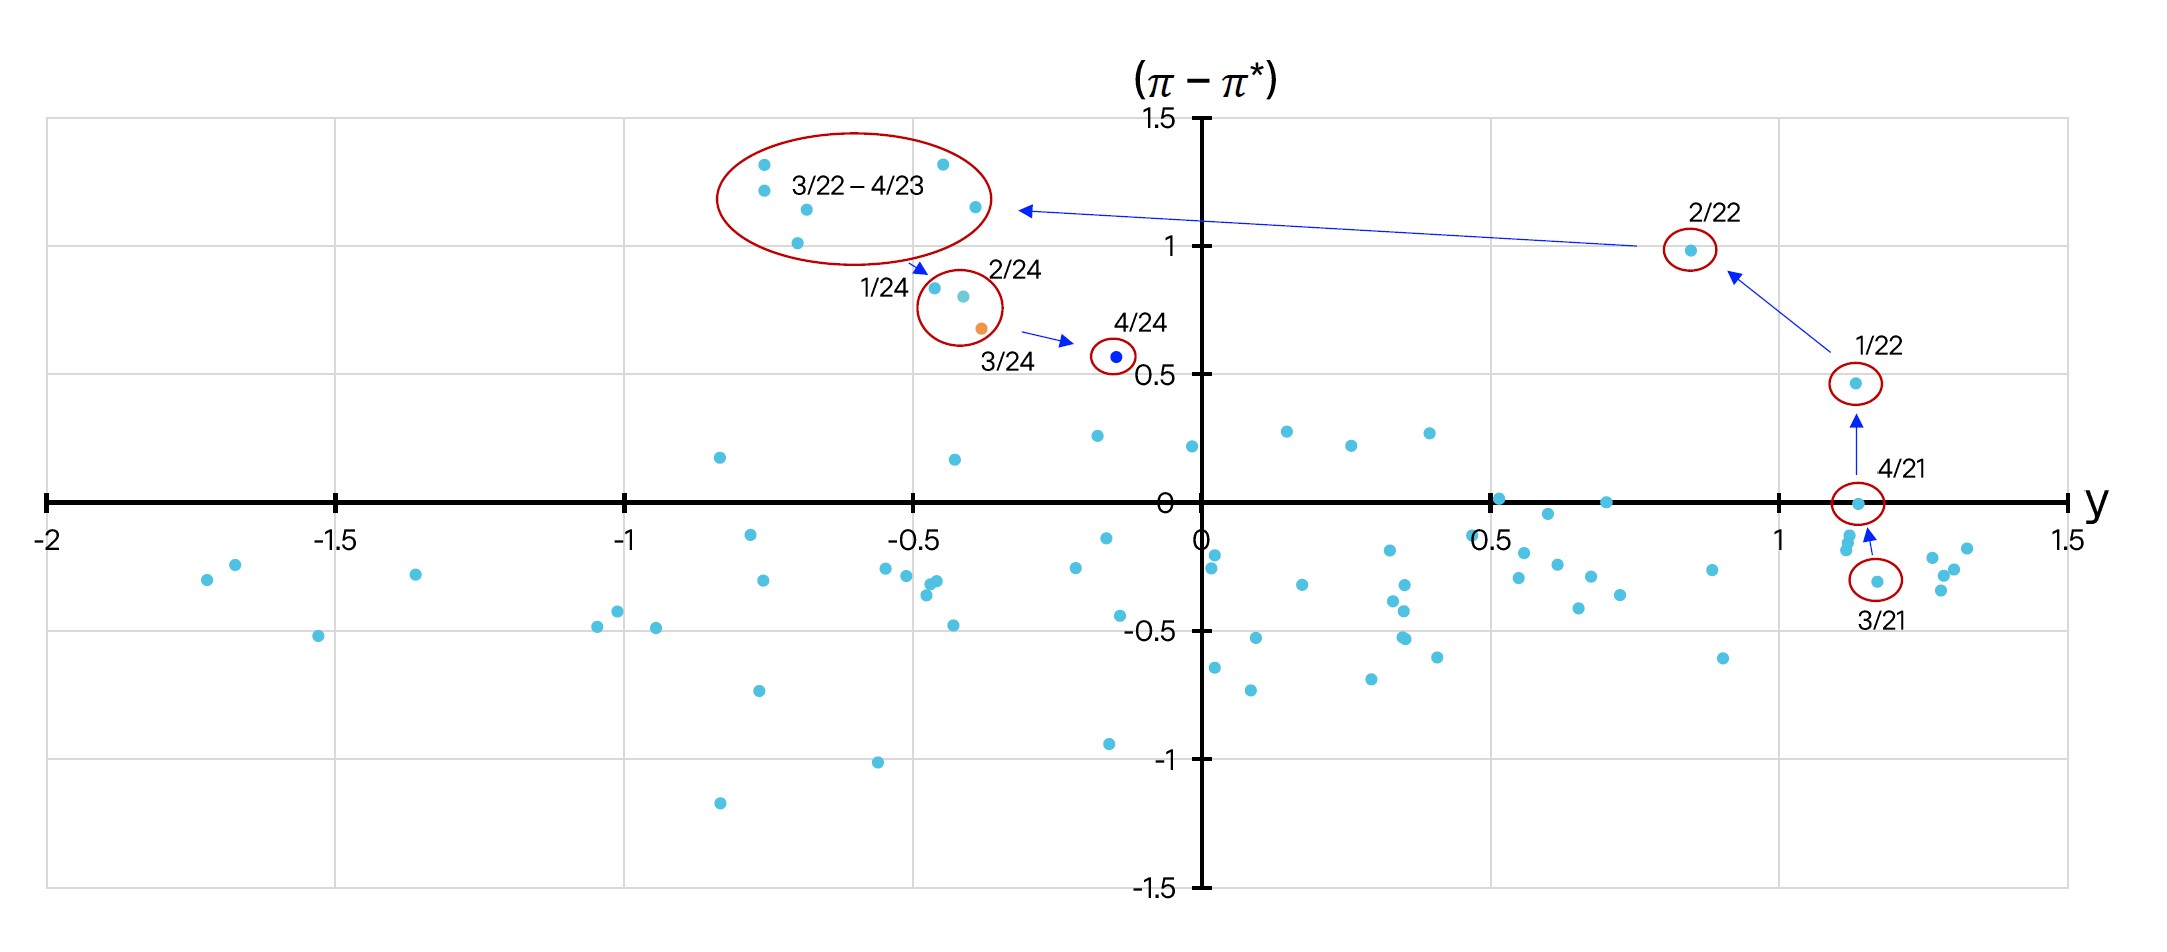
Source: Norges Bank
The points in the chart are in both the top-right quadrant and the bottom left quadrant, ie situations where our projections have given the same sign for both the inflation gap and the output gap. According to a simple theoretical model[2], this would not be optimal because a better attainment of monetary policy objectives can be achieved by setting the policy rate higher or lower, which would bring inflation closer to target and output closer to potential.
In reality, monetary policy trade-offs are more complex than the simple theoretical model indicates. In some situations, as a result of the economic realities, we would also give weight to other conditions, such as a risk of a build-up of financial imbalances or uncertainty related to the effect of the policy rate. The speed at which we seek to bring inflation back to target will also depend on the nature of the economic shock. The fact that the points in this chart have moved around considerably may just as much reflect substantial changes in the economic landscape as systematic changes in the weight given to the various considerations in our mandate over time.
Let me conclude by once again thanking the members of Norges Bank Watch. External evaluation is very useful, indicating where we should concentrate our efforts to improve our analyses and our communication.
Thank you for your attention.
[1] The calculation of the estimated probability distribution is based on the same method as the Atlanta Fed Market Probability Tracker
[2] See eg Røisland, Ø. and T. Sveen (2018) “Monetary Policy under Inflation Targeting”. Occasional Papers 53/2018. Norges Bank.
