Key findings
Ownership and knowledge of crypto-assets:
- 96% of the Norwegian population aged 16 and over are aware of crypto-assets.
- 11% of the population owned crypto-assets at the time of the survey.
- 15% of the population have owned or own crypto-assets.
- Bitcoin is the crypto-asset most people are aware of, followed by Ether, Dogecoin and Litecoin.
- 73% of those who know about crypto-assets rate their own knowledge of crypto-assets as "very little" or "quite little".
- The most common reasons for not owning crypto-assets were lack of interest, lack of knowledge and high risk.
Former and current crypto-asset owners:
- The crypto-assets that most people owned at the time of the survey were Bitcoin, Ether, Ripple, Cardano and Solana.
- 67% of current crypto-asset owners have holdings with a market capitalisation of NOK 50,000 or less.
- 2 out of 3 current crypto-asset owners have 5% or less of their financial savings in crypto-assets.
- The most common way to finance the purchase of crypto-assets is by using your own disposable income.
- 33% of current crypto-asset owners plan to hold the same level of crypto-assets in the next few years, while 30% plan to increase their holdings. 10% plan to reduce their holdings, while 27% are unsure/don't know.
- The most popular trading venues for crypto-assets are centralised crypto exchanges abroad and in Norway (45% and 41% of respondents in this group, respectively).1 Only 6% reported using DeFi (decentralised finance) to trade crypto-assets.
- 41% of former and current crypto-asset owners are very satisfied or fairly satisfied with their investment in crypto-assets, while 19% are fairly dissatisfied or very dissatisfied.
- 52% of those who report negative experiences with crypto-assets point to a drop in value. 23% of those with negative experiences point to a lack of applications as a means of payment in the traditional economy, and 22% point out that they have experienced theft/fraud.2
DeFi, stablecoins and NFT (non-fungible token):
- Of those who were aware of DeFi, a high proportion (73%) had never used DeFi.
- The three main reasons for buying stablecoins are to trade other cryptocurrencies (44%), to store value (33%) and to learn more about and/or test the technology (23%).
- 1% of the population has purchased NFT.
1 It was possible to choose several answer options.
2 It was possible to choose several answer options.
1. Introduction
This memo presents data from a survey on the Norwegian population’s awareness, ownership and use of crypto-assets. The survey was conducted by Norges Bank with the assistance of Ipsos in January and February 2024. This is the first time Norges Bank has conducted such a survey.
The survey is part of Norges Bank’s efforts to gain more knowledge about the importance of crypto-assets in Norway. Among other things, Norges Bank uses this knowledge to analyse the consequences of crypto-assets for an efficient and secure payment system and financial stability. See Appendix A for definitions of several terms related to crypto-assets.
2. Methodology
2.1 Study design
Figure 1 shows the structure of the survey. The survey aims to provide more knowledge about those who are aware of crypto-assets - both those who own or have owned crypto-assets and those who have not. A significant proportion of the questions in the survey is linked to the group “former and current crypto-asset owners”.
Figure 1 Follow-up stages and focus of data collection
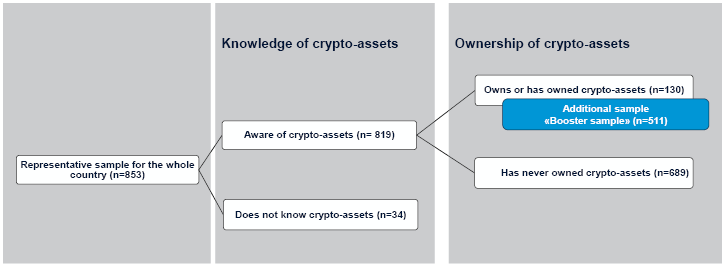
The survey was conducted in two stages3 with two different samples, where “n” corresponds to the number of respondents in the sample where the question was asked.
Main sample: The main sample is a nationally representative sample (n=853). In this sample respondents were asked about their knowledge of crypto-assets. Those who answered that they were aware of crypto-assets were asked follow-up questions related to their experiences.
Additional sample (so-called “booster sample”): This part of the survey was conducted after the first round with the main sample. The booster sample consists of respondents recruited from the same panel, but here the questions are only aimed at current and former owners of crypto-assets. An additional sample enables access to a larger and representative sample of current and former owners of crypto-assets.4 In the analysis, the additional sample (n=511) is merged with those who responded that they have owned or own crypto-assets in the main sample (n=130). The total sample is then 641.5 Figure 2 shows the distribution of respondents per group of interest in the study. 6
Figure 2 Number of respondents per group of interest
|
Those unfamiliar with crypto-assets |
Those who are aware of crypto-assets but have not owned them |
Those who have owned or own crypto-assets |
Total |
|
|---|---|---|---|---|
|
Several samples used as a basis for the survey |
||||
|
Main sample |
34 |
689 |
130 |
853 |
|
Additional sample (“booster sample”) |
- |
- |
511 |
511 |
|
Total |
34 |
689 |
641 |
1364 |
Source: Norges Bank
The questionnaire consisted of 28 questions related to crypto-assets.7 In addition, there were five questions related to sample description (gender, age, respondent’s place of residence, highest completed education and gross household income).
The survey took a maximum of 5 minutes to complete. On some questions, it was possible to choose multiple answer options.
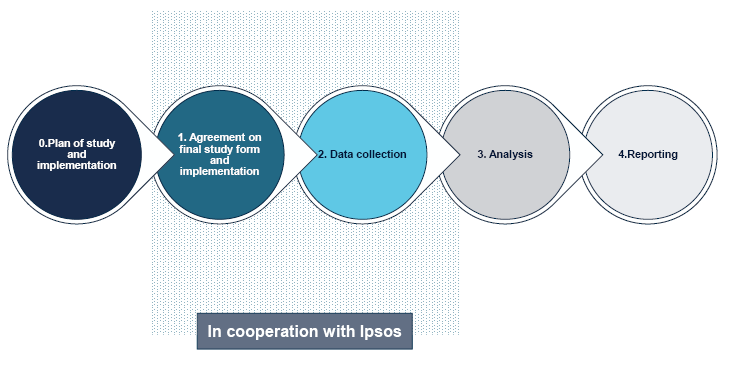
3 Appendix B shows the process for the study.
4 The additional sample is a pragmatic choice: by not increasing the size of the main sample, the requirement for representative findings is also satisfied for subgroups belonging to current and former owners of crypto-assets.
5 The survey with the main sample was conducted in the period 22-30 January 2024, while the survey with the additional sample was conducted in the period 2-16 February 2024.
6 9900 participants in the panel were surveyed to obtain 853 responses. This corresponds to a response rate of 8.6%.
7 Appendix C shows the questionnaire.
2.2 Data collection method
The survey was conducted by Ipsos in accordance with an agreement with Norges Bank following a tender competition. Respondents were contacted by e-mail or SMS, and the collection of responses in the survey was web-based. Box 1 describes the data collection method.
Box 1 Data collection method
The Ipsos population panel consists of 97,000 people. The lower age limit in the panel is 16 years. Respondents are recruited using lists from Bisnode and based on information from the National Population Register. Standard market practice was followed in this study: all relevant respondents were contacted by email or SMS.
The survey was conducted via an online form. To increase the response rate, respondents are given incentives in the form of points that can be redeemed for gift cards.
All respondents participated in the survey voluntarily and were not aware that Norges Bank was behind the study. All responses were anonymous.
The answer options were ranked randomly so as not to influence the answers.
The data in the main sample has been weighted according to the national distribution of gender, age and county in 2023.
Sources: Ipsos and Norges Bank
2.3 Basis for generalisation of findings and limitations
The main sample (in weighted form) is representative of the Norwegian population over the age of 16.8 The supplementary sample provides a basis for generalising findings for those who own or have owned crypto-assets in Norway.
The main sample is further analysed based on weighting of responses to satisfy representativeness.
Further in the memo, where significant findings are pointed out, it means statistical significance of at least 95%.
Normal market practice has been followed in the conduct of this survey. In general, there are several possible weaknesses in such surveys.9 Errors can therefore not be ruled out.
8 Appendix D provides a description of the main sample.
9 Appendix E refers to several measures to address weaknesses related to methodology.
3. Findings
3.1 General knowledge of crypto-assets
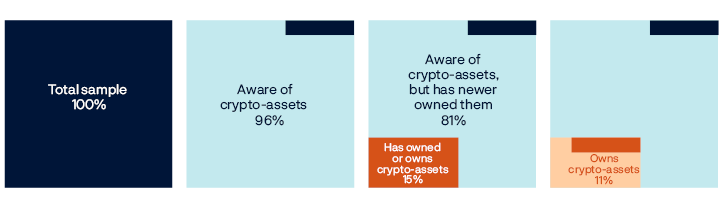
Figure 3 summarises the findings on general awareness and ownership of crypto-assets.
According to the survey, 96% of the population is aware of crypto-assets. 15% of the population has at some point owned crypto-assets, while 11% owned crypto-assets at the time of the survey. At the time of the survey, 81% of the population were aware of crypto-assets but had never owned crypto-assets.
Source: Norges Bank
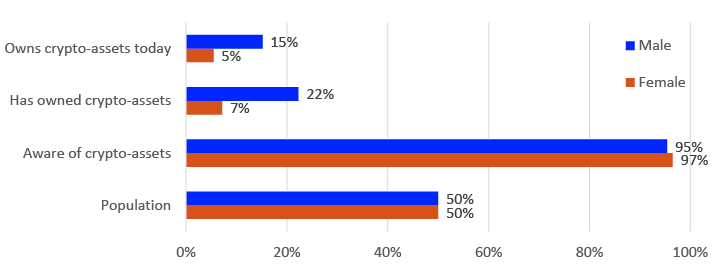
Figures 4 and 5 show awareness of crypto-assets by gender and age group respectively. Ownership of crypto-assets will be discussed in more detail in section 3.3. Nevertheless, the main findings for ownership are shown here to illustrate differences depending on gender and age group.
Figure 4 shows that more men than women both own and have owned crypto-assets. When it comes to general knowledge of crypto-assets, the proportion is high for both women and men (97% and 95% respectively).
Figure 4 Gender, awareness and ownership of crypto-assets
Basis: Main sample (n=853) 11
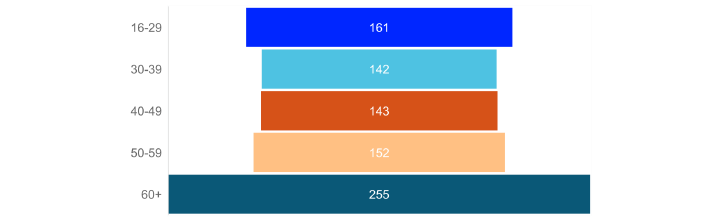
Those in the 60+ age group are underrepresented (compared to the proportion of the same age group in the population), while those in the 16-29 and 30-39 age groups are overrepresented.12 Other studies both for Norway and other countries13 have pointed out an overrepresentation of men at a young age among the owners of crypto-assets.
Figure 5 Those who own or have owned crypto-assets, by different age groups
Base: Those who own or have owned crypto-assets (n=641) compared to the distribution of age groups in the population

In addition to being asked about familiarity with crypto-assets in general, respondents were also asked about familiarity with specific crypto-assets using examples. The examples were a mix of crypto-assets with their own unit of account (such as Bitcoin, Dogecoin and Ether) and crypto-assets denominated in/stabilised against a specific currency (such as USD Coin, Tether USD and Binance USD).
Figure 6 Percentage of sample that recognises the following crypto-assets
Basis: Main sample
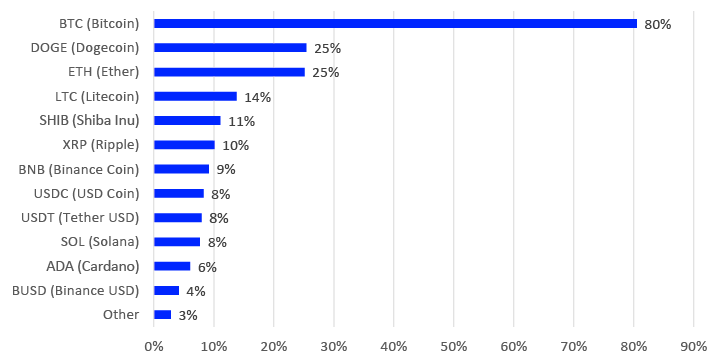
Source: Norges Bank
There are several factors that can influence which crypto-assets are recognised, including the asset’s market size, media activity, publicity from commercial players such as crypto exchanges, acquaintances who talk about crypto-assets or direct experience of owning crypto-assets. Figure 6 shows the findings related to the recognition of specific crypto-assets.
The findings show that Bitcoin is by far the most well-known crypto-asset, followed by Dogecoin, Ether, Litecoin and Shiba Inu.14 The survey shows that there is generally low awareness of several stablecoins. USD Coin is the most well-known, followed by Tether USD and Binance USD.
Geographically, those living in Oslo have the highest awareness of crypto-assets. Those living in Northern Norway have the lowest awareness (not shown in figure).15
Figure 7 Awareness of specific crypto-assets by gender
Basis: Main sample (n=853)
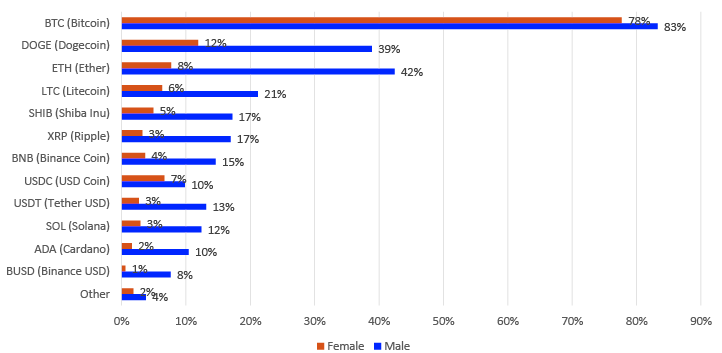
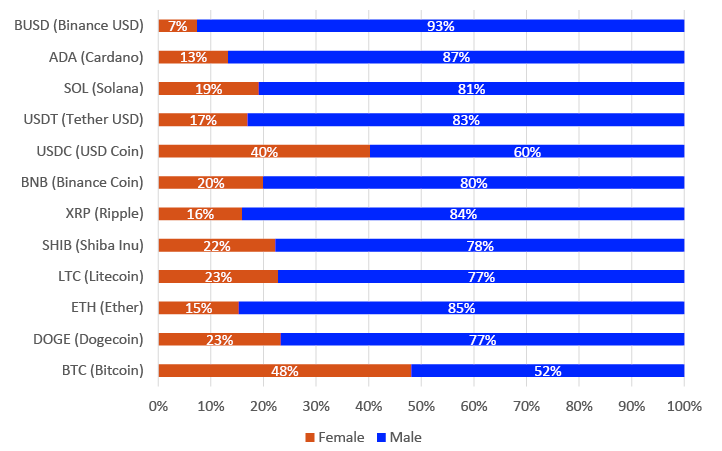
Figure 7 shows awareness of specific crypto-assets by gender, while Figure 8 shows the proportion of men and women for each group who are aware of specific crypto-assets. The findings indicate that there are consistently more men than women who are aware of specific crypto-assets.
Figure 8 Proportion of women and men in each group who are aware of specific crypto-assets
Base: Main sample (n=819, subgroups based on all those who know a specific crypto-asset)
Source: Norges Bank
Respondents were also asked about their familiarity with specific crypto-asset concepts such as “DeFi” and “stablecoins”. Figure 9 shows that although a total of 96% of respondents have heard of crypto-assets, significantly fewer have heard of DeFi (13%) and stablecoins (11%).
Figure 9 Familiarity with some crypto-asset concepts in total and by gender
|
Category |
Female |
Male |
In total |
|---|---|---|---|
|
Basis: Main sample (n=853) |
|||
|
Have heard of crypto-assets16 |
95% of women |
97% of men |
96% of respondents |
|
Have heard of DeFi |
4% of women |
22% of men |
13% of respondents |
|
Have heard of stablecoins |
5% of women |
17% of men |
11% of respondents |
Source: Norges Bank
Figure 10 shows the respondents’ assessment of their own knowledge of crypto-assets. 76% of those in the sample who are aware of crypto-assets rate their own knowledge as “very little” or “quite little”.17 Only 7%18 of those who are aware of crypto-assets consider that they have “very much” or “quite a lot” of knowledge about them.
Figure 10 General assessment of own knowledge of crypto-assets
Base: Those who are aware of crypto-assets (n=819)
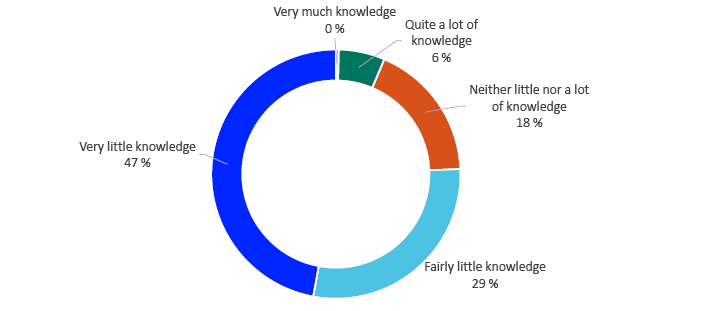
Source: Norges Bank
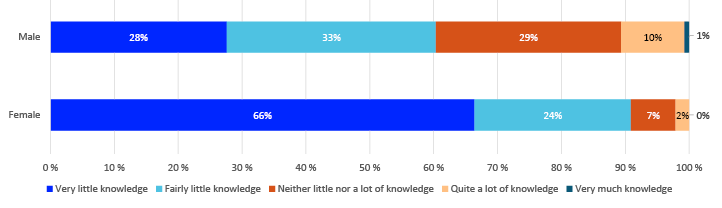
Figure 11 shows the results broken down by gender. Significantly more women than men rate their own knowledge of crypto-assets as very little or fairly little (90% of women and 61% of men, respectively).19
Figure 11 Gender and assessment of own knowledge of crypto-assets
Base: Those who are aware of crypto-assets (n=819)
Source: Norges Bank
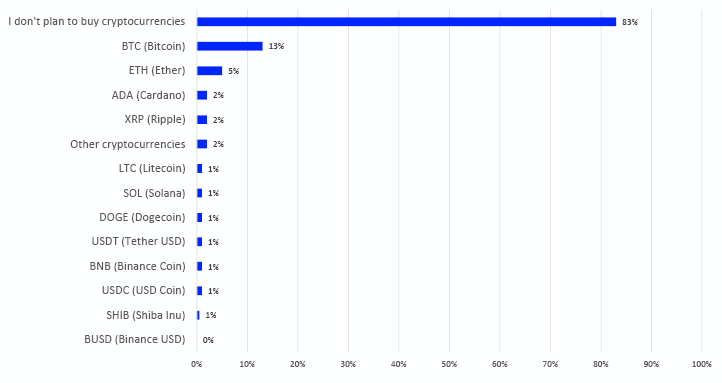
Those who responded that they were aware of specific crypto-assets were asked whether they planned to buy, and if so, which crypto-assets they planned to buy (it was possible to choose several response options). Figure 12 shows the results.
83% of respondents do not plan to acquire crypto-assets. The crypto-asset most likely to be purchased was Bitcoin (13% of this group said they think they will buy Bitcoin), followed by Ether (5%), Cardano (2%) and Ripple (2%).
Figure 12 Plans for future purchases of crypto-assets
Base: Those who are aware of specific crypto-assets (n=706)
Source: Norges Bank
Everyone who knew about crypto-assets (n=819) was asked what would make it more relevant to buy crypto-assets. It was possible to choose several response options. The results are shown in Figure 13.
42% of respondents pointed out that none of the mentioned options would make it more relevant to buy crypto-assets. 37% pointed to “government information about cryptocurrencies, including risks and benefits”, while no other option received more than 18%.
Figure 13 What would make it more relevant to buy crypto-assets?
|
Share of basis |
|
|---|---|
|
Base: Aware of crypto-assets (n=819) |
|
|
Government information about cryptocurrencies, including risks and benefits |
37% |
|
More regulation of cryptocurrency trading venues |
18% |
|
More regulation of organisations offering information about cryptocurrencies |
17% |
|
More regulation of cryptocurrency issuers and developers |
16% |
|
None of these |
42% |
|
Other |
3% |
Source: Norges Bank
10 A version of this infographic is presented in Norges Bank (2024).
11 The category “have owned crypto-assets” refers to those who answered “yes” to having owned crypto-assets at some point. Thus, this group also includes those who own crypto-assets today.
12 The findings are significant.
13 See K33 Research and EY Norway (2023, 2024) and Arcane Research and EY Norway (2022). See Financial Conduct Authority (2023) for the UK.
14 It’s not surprising that Bitcoin and Ether are among the most well-known crypto-assets, due to their market capitalisation and media coverage. For some other crypto-assets, familiarity may also be due to marketing activities internationally and locally.
15 The findings are significant.
16 In this question, reference was made to cryptocurrency. For precise question wording, see question 5 in Appendix C.
17 This corresponds to 73% of the population, since 4% do not know about crypto-assets.
18 The total is 7% due to rounding of figures.
19 Furthermore, men are overrepresented in three response options (“quite a lot of knowledge”, “neither a lot nor a little knowledge” and “quite a little knowledge”), while they are underrepresented for “very little knowledge”. The findings are significant for both genders (with the exception of the response option “very much knowledge”).
3.2 Those who have never owned
crypto-assets
Those who responded that they are aware of crypto-assets but have never owned crypto-assets (n=689, i.e. 81% of the main sample) were followed up with questions about reasons for not purchasing, see Figure 14. It was possible to choose several response options.
Figure 14 Reasons why respondents have never owned crypto-assets
|
Share of basis |
|
|---|---|
|
Base: Main sample, those who have never owned crypto-assets (n=689) |
|
|
I have no interest in it |
47% |
|
I don't have enough knowledge about it |
45% |
|
I think it's too risky |
25% |
|
I don't have the money for that |
12% |
|
I'm waiting for more regulation |
5% |
|
I'm waiting to see what happens next before I make a decision |
4% |
|
Other |
3% |
Source: Norges Bank
The three main reasons why respondents had never bought crypto-assets were lack of interest, lack of knowledge and that crypto-assets were considered too risky (47%, 45% and 25% of respondents respectively).
3.3 Former and current crypto-asset owners
Figure 15 shows in the same graph when respondents bought crypto-assets for the first time (left axis, proportion of respondents) and the total market value of crypto-assets (right axis). The first block in Bitcoin, the so-called “Genesis block”, was created in January 2009. The market capitalisation of crypto-assets has fluctuated widely since then.
Data shows that 51% of this group have purchased crypto-assets in the last five years. 10% of the group report that they have bought crypto-assets before 2015.
Figure 15 Time of first purchase of crypto-assets
Base: Current and former crypto-asset owners (n=641)
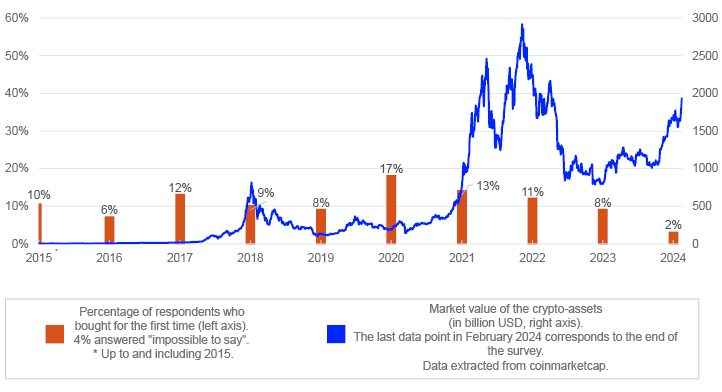
Sources: Norges Bank and Coinmarketcap
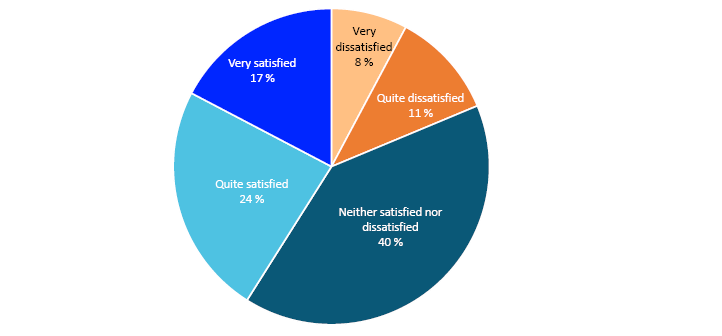
Figure 16 shows the extent to which respondents are satisfied or dissatisfied with their own investment in crypto-assets.
41% say they are quite satisfied or very satisfied with their own investment in crypto-assets and 19% say they are quite dissatisfied or very dissatisfied. 40% are neither satisfied nor dissatisfied.
Figure 16 Reported satisfaction with own investment in crypto-assets
Base: Former and current crypto-asset owners (n=641)
Source: Norges Bank
Current and former crypto-asset owners were asked what influences their holdings, see Figure 17. 15% pointed to acquaintances owning cryptocurrency, followed by inflation (13%), interest rates (13%) and media reports (10%). 35% of respondents chose “none of these”.
Figure 17 Factors affecting own holdings of crypto-assets
|
Number of respondents |
Share of basis |
|
|---|---|---|
|
Base: Current and former crypto-asset owners (n=641) |
||
|
Interest rate level |
81 |
13% |
|
Inflation |
81 |
13% |
|
Acquaintances who own cryptocurrency |
97 |
15% |
|
Media coverage |
64 |
10% |
|
None of these |
227 |
35% |
|
Other |
24 |
4% |
Source: Norges Bank
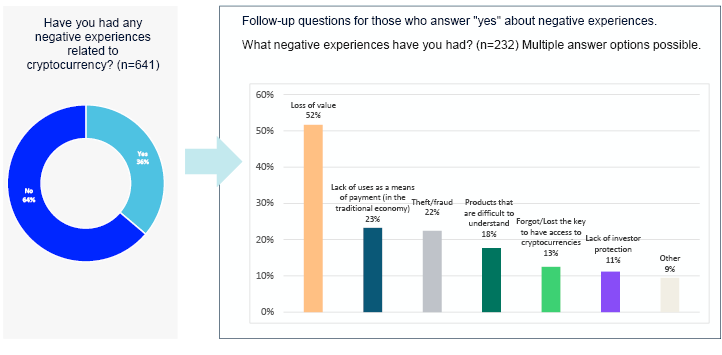
All current or former crypto-asset owners were also asked if they had experienced anything negative related to crypto-assets. Figure 18 collects information about the distribution of responses in an infographic.
36 per cent of those surveyed had experienced something negative in connection with crypto-assets. This group (n=232) was followed up with questions about the specifics of the negative experience. It was possible to choose several response options.
The bars show the extent of various negative experiences with crypto-assets. Over half of this group (52%) point to loss of value. 23% point to a lack of uses as a means of payment (in the traditional economy) and 22% refer to having experienced theft/fraud.
Figure 18 Infographic on negative experiences with crypto-assets
Overview of negative experiences related to crypto-assets
Base: Current or former crypto-asset owners (n=641)
Source: Norges Bank
Respondents were asked which crypto-assets they own. The results are shown in Figure 19.
Figure 19 shows that 70% of current crypto-asset owners own Bitcoin, while 46% own Ether. Ripple, Cardano and Solana follow suit. Ownership correlates with market capitalisation. Bitcoin is the largest crypto-asset by market capitalisation, followed by Ether. 20
Several examples were given by respondents under “other cryptocurrencies”. This is not surprising, as there are thousands of crypto-assets in the market.21
Of those who still own crypto-assets, those with the highest completed education “University/college, undergraduate degree”, those who have a total gross household income of more than 1,500,000 and those who live in Oslo are overrepresented.22
Figure 19 The crypto-assets owned at the time of the survey
Base: Current crypto-asset owners (n=466). It was possible to select multiple response options
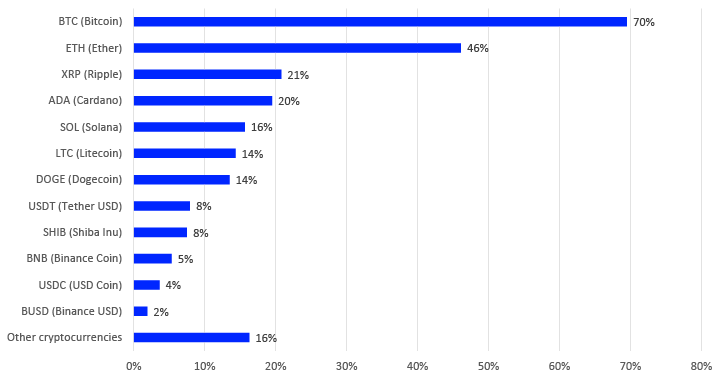
Source: Norges Bank
Current owners of crypto-assets were asked about the market value of their holdings, see Figure 20. 9% of respondents did not want to disclose the value of their holdings. About two out of three current crypto-asset owners (67%) had holdings of NOK 50,000 or less. 5% had holdings of more than NOK 1,000,000 at the time of the survey.
Figure 20 Size of crypto-asset holdings at the time of the survey
Size of crypto-asset holdings
Base: Current crypto-asset owners (n=466)
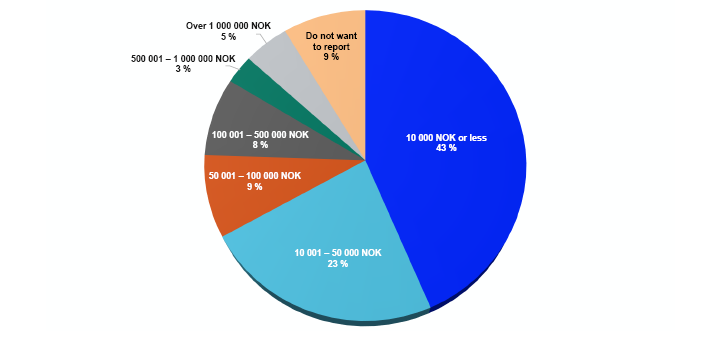
Source: Norges Bank
Based on these responses, it can be estimated that the total market value of individuals’ holdings of crypto-assets was at least NOK 35 billion at the time of the survey.23 The actual value is probably higher.24
Figure 21 shows how purchases of crypto-assets are financed.
Figure 21 Financing the purchase of crypto-assets
Base: Current crypto-asset owners (n=466). It was possible to select multiple response options
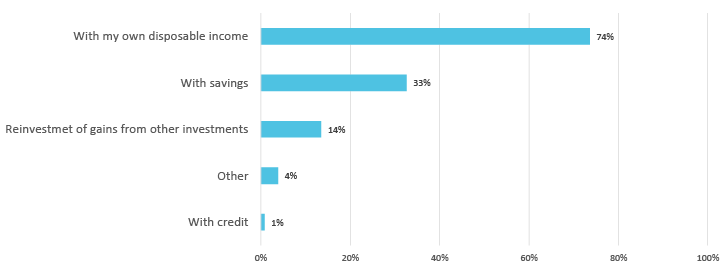
Source: Norges Bank
The most popular way to finance the purchase of crypto-assets is by using their own disposable income (74%). Only 1% report that they finance the purchase of crypto-assets with loans. There are 4% who choose “other”. The most common examples in this category are gifts or own mining.
Figure 22 shows the answers to the question “How will you change your holdings in the coming years?”. Approximately one in three current crypto owners state that they will keep their crypto-asset holdings at the same level (33%). About the same number (30%) state that they plan to increase their holdings. 10% of this group say that they want to reduce their holdings.
Figure 22 Intention to change own crypto-asset holdings in the coming years
Base: Current crypto-asset owners (n=466)
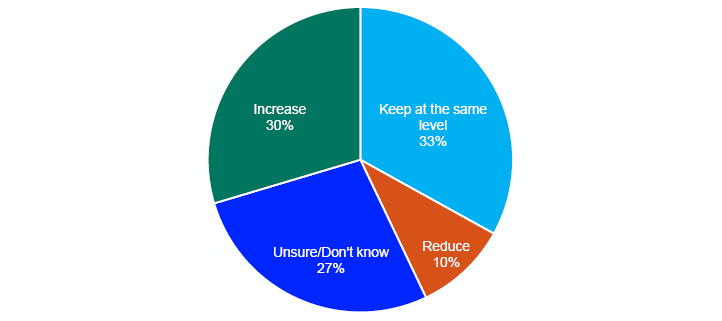
Source: Norges Bank
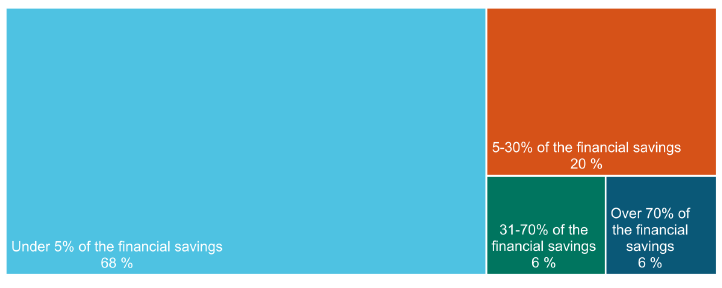
Current crypto-asset holders were also asked what proportion of their financial savings were in crypto-assets.25 Figure 23 shows the findings. 2 out of 3 current crypto-asset owners have 5% or less of their financial savings in crypto-assets.
Figure 23 Share of financial savings going to crypto-assets
Base: Current crypto-asset owners (n=466)
Source: Norges Bank
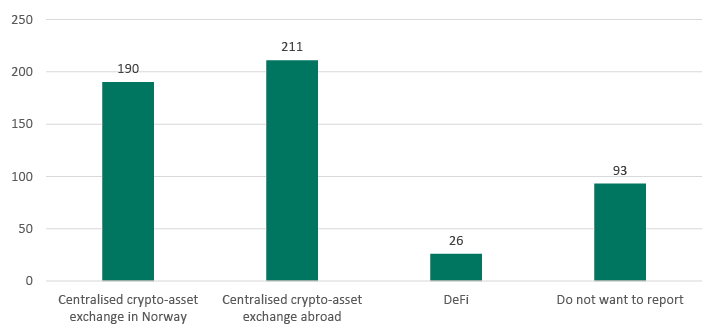
Figure 24 shows answers to where the buying and selling of crypto-assets takes place. It was possible to choose several response options. The most popular places to trade crypto-assets are centralised crypto exchanges abroad (45%) and centralised crypto exchanges in Norway (41%). 6% reported choosing DeFi for trading crypto-assets. Around 20 per cent of respondents did not want to provide information on trading venue.
Figure 24 Where purchases and sales of crypto-assets take place
Base: Current crypto-asset owners (n=466). It was possible to select multiple response options
Source: Norges Bank
Figure 25 shows perceived investor protection for different groups.26
Figure 25 Perceived investor protection
Base: Those who have previously owned crypto-assets (n=175) vs. those who own crypto-assets at the time of the survey (n=466)
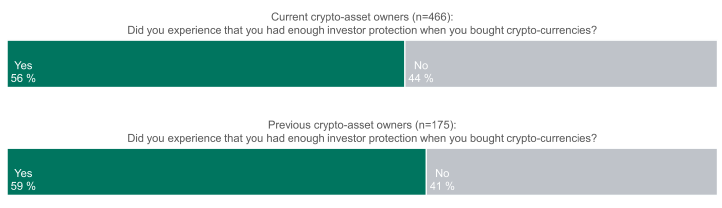
Source: Norges Bank
More than half of the respondents felt that they have experienced investor protection when buying crypto-assets.
Figure 26 shows the results of follow-up questions related to those who are aware of DeFi (n=335). Of all those who were aware of DeFi, a high proportion (73%) had never used DeFi.
Figure 26 Experience with the use of DeFi platforms/protocols
Base: Those who are aware of Defi (n= 335), It was possible to select multiple response options
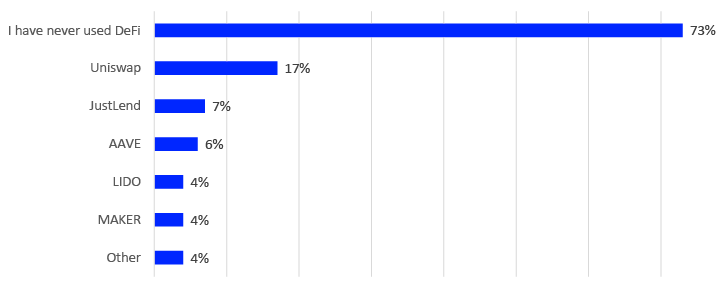
Source: Norges Bank
Respondents were also presented with some of the major DeFi platforms and asked if they had used them.27 The most popular DeFi platform was Uniswap (17% had used this platform).28
Those who responded that they were aware of stablecoins (n=339) were followed up with questions about whether they had purchased stablecoins. The results are shown in Figure 27.
Figure 27 Experience with the purchase of certain stablecoins
Base: All those aware of stablecoins (n=339). It was possible to choose several response options
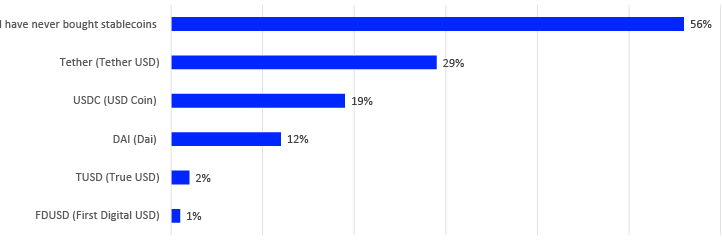
Source: Norges Bank
Figure 27 shows that 56% of this group responded that they have never purchased stablecoins. The most popular stablecoin was Tether USD (29% of this group had experience of owning this stablecoin, which is also the largest in the world by market capitalisation), followed by USD Coin (19%).
Those who responded that they had experience of buying stablecoins (n=149) were asked about the purpose of the purchase. Figure 28 shows that the three main reasons for buying stablecoins are for use in trading other cryptocurrencies (44%), to store value (33%) and to learn more about and/or test the technology (23%).
Figure 28 Reasons to buy stablecoins
Base: Those who purchased stablecoins (n=149). It was possible to select multiple response options
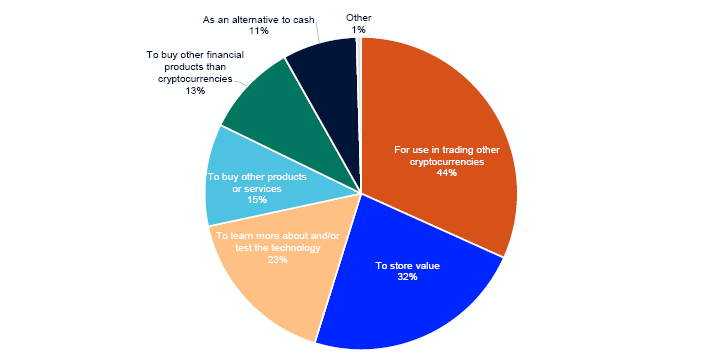
Source: Norges Bank
Figure 29 shows results based on follow-up of those who responded that they know about NFTs (n=68). The most popular reasons for owning NFTs are to use NFTs as digital collection objects (31%) and as investment objects (29%).
Figure 29 What NFT is used for
Base: All those who are aware of NFT (n=68). It was possible to choose several response options
|
Number of respondents |
Share of basis |
|
|---|---|---|
|
Base: All those who know about NFT (n=68) |
||
|
As digital collectibles (for art, gaming etc.) |
21 |
31% |
|
As an investment property |
20 |
29% |
|
To own physical assets |
8 |
12% |
|
Other |
3 |
4% |
Source: Norges Bank
20 See for example coinmarketcap.com.
21 Ibid.
22 The findings are significant.
23 The calculation method provides an estimate of the minimum value. The calculation is based on a weighted calculation of minimum holdings based on the minimum values in each interval/segment. For the group with holdings with a market value of NOK 10,000 or less, a holding of NOK 1 was assumed and multiplied by the size of the group. For the next group, with holdings of NOK 10,001-50,000, the multiplication was done by an amount of NOK 10,001, and so on.
24 In comparison, the tax authorities reported in 2021 that the taxable value at that time totalled NOK 20 billion, see Skatteetaten (2022) and Norges Bank (2022a).
25 To concretise the question, the respondent was given the following explanation of financial savings: “By financial savings, we mean savings in the form of bank deposits, or other financial objects such as shares.”
26 The term “investor protection” was not further defined in the questionnaire. For a discussion of investor protection, see The Financial Supervisory Authority of Norway (2021).
27 These platforms were among those with the highest TVL (“Total Value Locked”) during the survey period.
28 Uniswap is a decentralised platform launched in 2018. Uniswap is a popular platform used as an AMM (“Automatic Market Maker”). More about this platform can be found in coinmarketcap.com, defillama.com and Norges Bank (2024).
4. Concluding remarks
This is the first time Norges Bank has conducted such a survey. It is also the most detailed study to date of individuals’ ownership of, knowledge of and experiences with crypto-assets in Norway. The survey complements other surveys conducted by private and public organisations, such as K33 Research and EY Norway (2023 and 2024) and the Norwegian Tax Administration (2022 and 2024).
Our survey provides information on individual crypto owners in Norway. It does not cover institutional actors’ ownership and use of crypto-assets. The findings can be used in conjunction with findings from other data sources, which can provide useful diversity in methodology, data sources and scope of exploration.
References
Arcane Research and EY Norway (2022). Norwegian crypto adoption survey 2022. Available below: EY.
K33 Research and EY Norway (2024). Nordic crypto adoption survey 2024. Available at: EY.
K33 Research and EY Norway (2023). Norwegian crypto adoption survey 2023. Available at: EY.
Financial Conduct Authority (2023). Research Note: Cryptoassets consumer research 2023 (Wave 4). Available at Financial Conduct Authority.
Norges Bank (2024). Financial Infrastructure 2024. Available at: Norges Bank.
Norges Bank (2022b). Financial Infrastructure 2022. Available at: Norges Bank.
Norges Bank (2022a). Financial Stability 2022. Available at: Norges Bank.
Regjeringen (2024). Høring - forslag til gjennomføring av forordning (EU) 2023/1114 om markeder for kryptoeiendeler (MiCA) og av forordning (EU) 2023/1113 (TFR II) i norsk rett. Available under: Regjeringen.
The Norwegian Tax Administration (2024). 48,155 have stated that they own cryptocurrencies - the Norwegian Tax Administration believes that many do not realise that this should be entered in their tax return. Press release, available at: Skatteetaten.
The Norwegian Tax Administration (2022). More people are declaring crypto-assets in their tax returns. Press release, available at: Skatteetaten.
The Financial Supervisory Authority of Norway (2021). Consumers and cryptocurrency. Available at: Finanstilsynet.
Appendix
Appendix A: Crypto-asset concepts
Glossary of terms
Crypto-assets: Collective term for cryptocurrencies, stablecoins and tokens (see below). Often used in the regulatory contexts of assets that are represented with cryptographic codes in distributed ledgers.
Cryptocurrencies: Units in a ledger or data system designed to be operated in a decentralised manner. Ledgers are often referred to as blockchains, The units are accessible via cryptographic keys. The system itself can be referred to as a DLT (distributed ledger technology) system, while the ledger units are cryptocurrencies.
Smart contracts: A smart contract is a computer programme that automates exchanges between entities according to pre-defined conditions. The term is often used to describe programmes in a DLT system.
Tokens: Assets in a DLT system, often issued under a smart contract. Accessible via cryptographic codes. Tokens can be fungible (mutually interchangeable) or non-fungible (Non-fungible token – NFT). The latter represents a unique value, such as a digital piece of art, or items in a gaming ecosystem. Such NFTs can also represent other traditional assets, such as securities and real estate.
Decentralised finance: Financial products services implemented using smart contracts. This may include decentralised exchange services, lending platforms or platforms for trading financial instruments.
Stablecoins: Cryptocurrencies that aim to preserve a stable value against a benchmark (for example USD) through a stabilisation mechanism. They are often implemented as tokens in a smart contract in a DLT system. They can be secured, for example, through external assets managed by an external entity, external crypto-assets and/or algorithms that impact supply and demand.
Web3: A vision for a more decentralised internet where users own their own data and where blockchains make users less dependent on central operators. One type of Web3 application is Metaverse, which refers to virtual worlds (gaming etc) or a network of such worlds.
Source: Norges Bank (2022b, p. 17).
Appendix B: Process for the study
Appendix C: Questionnaire
|
No. |
Questions |
|---|---|
|
1 |
Have you heard of cryptocurrency? |
|
2 |
Have you heard of the following cryptocurrencies? Choose as many as you like. |
|
3 |
Which of the following cryptocurrencies do you think you will acquire (either for the first time or buy more if you already own)? Choose as many as you like. |
|
4 |
Have you ever owned Bitcoin or any other cryptocurrency? |
|
5 |
How much knowledge do you have of cryptocurrencies? |
|
6a |
Have you heard of DeFi (”Decentralised finance”)? |
|
6b |
Have you used the following DeFi platforms/protocols? Select as many as you like. |
|
7a |
Have you heard of stablecoins? |
|
7b |
Have you ever bought any of the following stablecoins? Choose as many as you like. |
|
8 |
Why did you buy stablecoins? Choose as many as you want |
|
9 |
Why haven’t you bought cryptocurrency? |
|
10 |
What regulatory measures would make it more relevant for you to buy cryptocurrency? Choose as many as you like. |
|
11 |
Do you still own cryptocurrency? |
|
12 |
Have you ever sold cryptocurrency? |
|
13 |
Approximately when did you buy cryptocurrency for the first time? If you don’t remember exactly, give your best estimate. |
|
14 |
How satisfied are you with your cryptocurrency investment? I’m... |
|
15a |
Have you had any negative experiences related to cryptocurrency? |
|
15b |
What negative experiences have you had with cryptocurrency? |
|
16 |
Did you feel you had enough investor protection when buying cryptocurrency? |
|
17 |
What cryptocurrencies do you own? |
|
18a |
Have you ever bought a non-fungible token (NFT)? |
|
18b |
How do you use/used NFT? Select as many as you like. |
|
19 |
How big are your cryptocurrency holdings right now, in Norwegian kroner? |
|
20 |
Approximately how much of your financial savings are in cryptocurrencies? By financial savings, we mean savings in the form of bank deposits, or other financial objects such as shares. |
|
21 |
How will you change your cryptocurrency holdings in the coming years? |
|
22 |
How do you pay for cryptocurrency? |
|
23 |
What affects your cryptocurrency holdings? |
|
24 |
Where do you usually buy and sell cryptocurrencies? |
|
A |
Gender |
|
B |
What is your age? |
|
C |
Where do you live? |
|
D |
What is your highest completed education? |
|
E |
What is your household’s total gross income? |
Appendix D: Description of the main sample
The figures below describe the main sample according to several parameters, such as age group, place of residence and total household gross income.
Figure 30 Distribution of respondents per age group. Number of respondents
Base: Main sample (n=853, unweighted)
Source: Norges Bank
Figure 31 Distribution of respondents per settlement. Number of respondents
Base: Main sample (n=853, unweighted)
|
Where the respondent lives |
Number of respondents |
|---|---|
|
Agder (Aust-Agder, Vest-Agder) |
45 |
|
Akershus |
147 |
|
Buskerud |
42 |
|
Finnmark |
6 |
|
Innlandet (Hedmark, Oppland) |
72 |
|
Møre and Romsdal |
37 |
|
Northland |
11 |
|
Oslo, Norway |
118 |
|
Rogaland |
57 |
|
Telemark |
22 |
|
Troms |
24 |
|
Trøndelag |
95 |
|
Vestfold |
31 |
|
Western Norway (Hordaland, Sogn and Fjordane) |
93 |
|
Østfold |
53 |
Source: Norges Bank
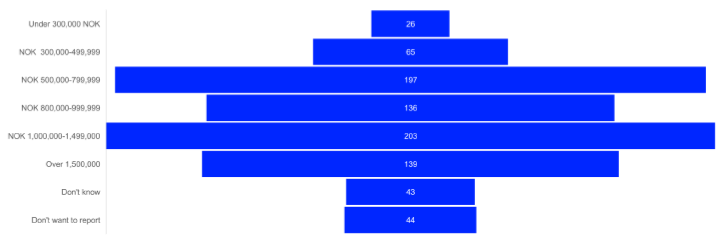
Figure 32 Distribution of respondents based on the household’s total gross income (based on weighted figures). Number of respondents in income interval
Base: Main sample (n=853, weighted)
Source: Norges Bank
Appendix E: Steps to increase the quality of findings
Several steps have been taken to counteract any weaknesses in the survey:
- Recruitment can affect sampling bias. Recruitment of respondents in both samples was done via panels (as shown in Box 1) and not through adverts. This contributes to representativeness.
- The sample size for both the main sample and current and former crypto-asset owners is dimensioned to provide representative findings.
- Norges Bank was not named in the survey, so as not to influence the findings.
- The questions in the survey and the response options were tested in a few rounds internally at Norges Bank and at the supplier.
- In order not to influence the answers, respondents were not given access to definitions of terms. The term “cryptocurrency” was used consistently as an umbrella term for crypto-assets.
Normal market practice has been followed in the conduct of this survey. Despite this, errors cannot be excluded in such a survey.