
The Committee’s assessment summarises the Monetary Policy and Financial Stability Committee members’ assessments that led to the monetary policy decision at the meeting on 26 March 2025. The analyses in Monetary Policy Report 1/25 summarise the basis for the assessment.
Norges Bank’s Monetary Policy and Financial Stability Committee decided to keep the policy rate unchanged at 4.5 percent at its meeting on 26 March. There is uncertainty about future economic developments, but the Committee’s current assessment of the outlook implies that the policy rate will most likely be reduced in the course of 2025.
The operational target of monetary policy is annual consumer price inflation of close to 2% over time. Inflation targeting shall be forward-looking and flexible so that it can contribute to high and stable output and employment and to counteracting the build-up of financial imbalances.
The policy rate was raised significantly to tackle high inflation and has stood at 4.5% since December 2023. The tightening of monetary policy has contributed to cooling down the Norwegian economy and to dampening inflation. Unemployment has edged up in recent years, albeit from a low level. The output gap has narrowed, and output is now close to potential. Inflation has fallen markedly from the peak but is still above target. High growth in business costs is likely to stoke inflation ahead.
The world economy is marked by the changed environment for international trade. Since the previous Report published in December 2024, tariffs have been imposed on a range of goods. Higher tariffs and trade policy uncertainty are expected to reduce global economic growth, but the trade tariffs implemented to date will probably have limited impact on economic activity in Norway. On the other hand, increased defence investment could boost activity in Europe. The projections imply that overall economic growth among Norway’s trading partners will be somewhat lower this year than assumed in the previous Report. Higher tariffs alone could lead to higher international inflation, while lower global growth could dampen inflation. The effects of higher tariffs on domestic inflation are uncertain.
The Committee gave special attention to the fact that inflation has picked up in recent months and has been markedly higher than projected. Twelve-month CPI inflation increased to 3.6% in February, while CPI inflation adjusted for tax changes and excluding energy products (CPI-ATE) rose to 3.4%. The unexpected increase in inflation makes it more difficult to project the future path of inflation. Food prices made a substantial contribution to the increase in inflation in February. Some of the increase may reflect changes in seasonal patterns, suggesting that food prices may rise at a slower pace ahead than previously assumed. At the same time, prices for a wide range of other goods and services increased more than expected. The Committee noted that inflation is now somewhat more consistent with that implied by the historical relationships between inflation and underlying driving forces, after having been lower than that for a period. The Committee also considered the fact that overall wage growth reached 5.6% in 2024, which was higher than the norm for the wage settlement in manufacturing and higher than projected in the previous Report. Wage growth turned out higher than the wage norm for most industries. At the same time, manufacturing profitability remains solid, and the wage share is low. The Committee judges that there are now several conditions suggesting that inflation will continue to run at a higher rate than projected in the previous Report.
Both international and Norwegian policy rate expectations have increased, and the Committee noted that market interest rates are now higher than the policy rate forecast in the previous Report. Market interest rates increased and the krone exchange rate appreciated following the publication of the latest inflation figures. The krone exchange rate has recently strengthened a bit further and is stronger than projected.
According to national accounts data, economic activity fell towards the end of 2024, and the Committee noted a further fall in housing investment. On the other hand, employment has risen further, and unemployment has shown a small decline. House prices have increased more than expected, and Norges Bank’s Regional Network contacts report increased activity over winter.
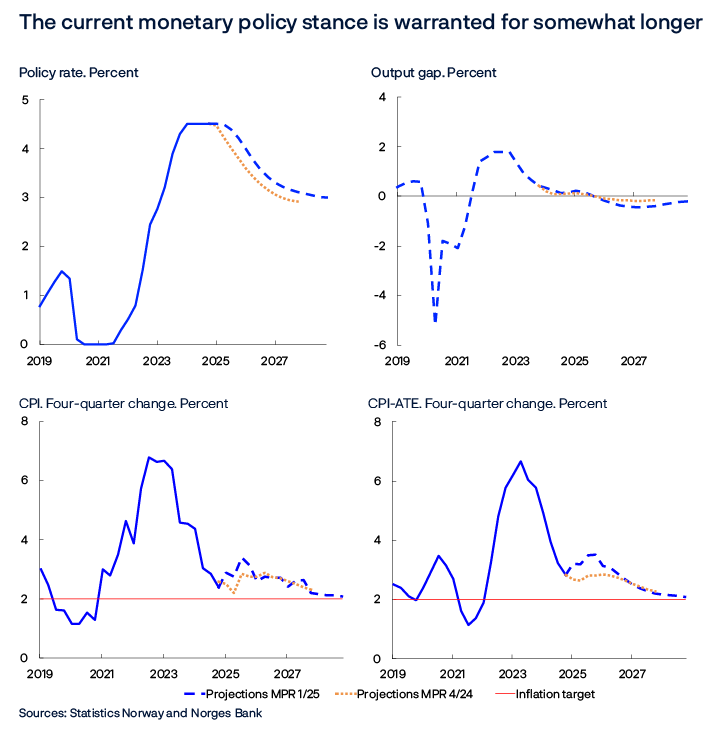
The Committee judges that a restrictive monetary policy is still needed to bring inflation down to target within a reasonable time horizon. The Committee noted that with the policy rate path presented in the previous Report the inflation projections would be higher and lie markedly above target this year and next. If the policy rate is lowered prematurely, prices may continue to rise rapidly. On the other hand, an overly tight monetary policy could restrict the economy more than needed to bring inflation down to target. Weighing these trade-offs, the Committee judges that the current stance is warranted for somewhat longer than previously signalled.
The policy rate forecast in this Report is consistent with a decline in the policy rate to 4% by the end of the year, followed by a gradual further decline over the next years. The forecast has been revised up somewhat from the previous Report. Growth in the Norwegian economy is expected to pick up a little in the years ahead. Registered unemployment is likely to increase slightly to around pre-pandemic levels. Inflation is projected to move down and be close to 2% towards the end of 2028.
The uncertainty surrounding the outlook is greater than normal, and the future path of the policy rate will depend on economic developments. If more extensive trade restrictions were to lead to a global economic downturn, the outlook for the Norwegian economy could also weaken. If the pickup in inflation proves more temporary than currently assumed or unemployment rises more than projected, the policy rate may be reduced faster than currently envisaged. If prospects suggest that wage and price inflation will remain elevated for longer than projected, a higher policy rate than currently envisaged may be required.
The Committee unanimously decided to keep the policy rate unchanged at 4.5%. There is uncertainty about future economic developments, but the Committee’s current assessment of the outlook implies that the policy rate will most likely be reduced in the course of 2025.
Ida Wolden Bache
Pål Longva
Øystein Børsum
Ingvild Almås
Steinar Holden
26 March 2025
1. Overall picture
International cooperation and trade are undergoing significant change. In Norway, inflation surprisingly jumped up sharply, following a long period of decline. Uncertainty about the economic outlook is greater than normal, but if the economy evolves broadly as projected, the policy rate will most likely be reduced in the course of 2025. The projections indicate that unemployment will then rise a little, and inflation will converge towards the Bank’s target of 2%.
Inflation
Inflation both in Norway and internationally has declined markedly in recent years, after rising sharply in the wake of the pandemic and Russia’s invasion of Ukraine. The decline partly reflects the substantial monetary policy tightening by central banks but also the normalisation of the supply of goods and services after the shocks induced by the pandemic. However, since autumn 2024, inflation among Norway’s main trading partners has picked up again (Chart 1.1).

In Norway, disinflation was faster than projected through 2024, but inflation has picked up again since the turn of the year and been higher than projected in the previous Report published in December 2024. In February, consumer prices were 3.6% higher than in February last year. Adjusted for tax changes and excluding energy products, consumer prices were 3.4% higher. Prices for a range of goods and services have risen at a faster pace, with a recent jump in food prices in particular. Some of the increase in food prices can be attributed to higher international prices.
GDP and demand
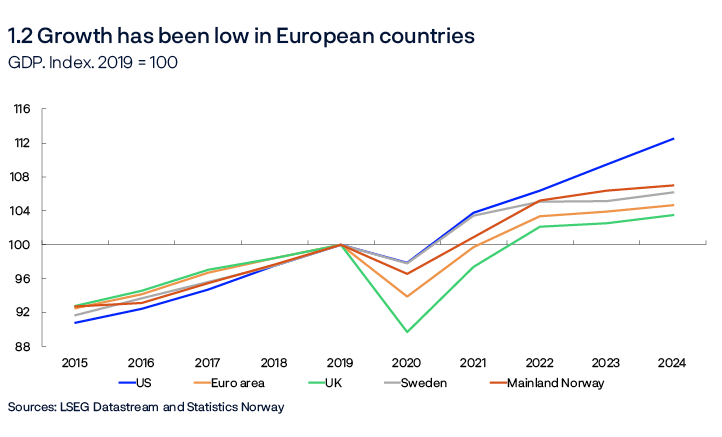
Following a rapid post-pandemic recovery, economic growth in both Norway and other European countries has been lower over the past couple of years. Monetary policy tightening has dampened activity. The fact that wage growth lagged behind the rise in inflation, so that real wages fell, has also weighed on activity. In the euro area, the UK and Sweden, growth picked up somewhat between 2023 and 2024 but slowed in Norway. US growth has been appreciably higher (Chart 1.2).
In Norway, household demand in particular has been weak. Consumption only increased marginally, and housing investment has fallen by more than 40% since spring 2022, the sharpest fall in more than 30 years. At the same time, developments in other sectors of the economy have underpinned overall activity. The krone depreciation in the period to summer 2023 has lifted exports, and the pandemic-related petroleum tax package has boosted investment on the Norwegian continental shelf. In addition, growth in public sector demand has been high.
Household demand has been weaker than projected in the previous Report. Consumption was unchanged between 2024 Q3 and Q4, while housing investment fell more than expected. This contributed to a fall in mainland GDP in the same period, but some special conditions also contributed to the fall, such as the strong decline in fisheries production. Norges Bank’s Regional Network contacts reported more steady but weak growth through 2024. Contacts expect growth to pick up in the first half of 2025. The trade tariffs introduced to date appear to have little effect on the Norwegian economy. Some contacts point to heightened uncertainty due to international trade conflicts, but few expect that this will lead to lower activity in the first half of 2025.
Labour market and capacity utilisation
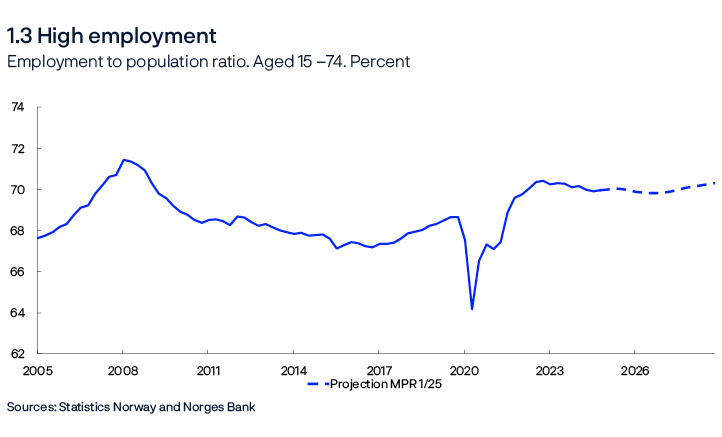
Employment recovered rapidly following the pandemic, but since activity growth has slowed over the past two years, employment growth has softened. Since 2022, employment has edged down (Chart 1.3). However, population growth was unusually high in this period. Ukrainian refugees have accounted for a large share of population growth, and as in previous refugee waves into Norway, few refugees have directly entered the labour market. Since the previous Report, employment has evolved as projected.
Registered unemployment has risen somewhat from a low of 1.6% in summer 2022. Recently, unemployment has edged down again, and in February this year, the unemployment rate was 2.0%, slightly lower than projected in the previous Report.
Despite somewhat higher unemployment, wage growth has risen further and been higher than projected. In 2024, annual wage growth was 5.6%, the highest level since 2008. Wage growth has been high across industries.
The output gap for the Norwegian economy is estimated to have narrowed somewhat through 2023, but with output estimated to have remained close to potential since the start of 2024.
Global economic outlook
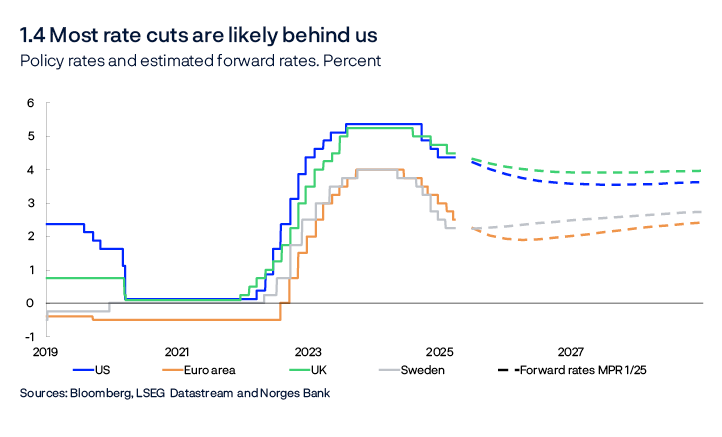
As inflation has come down, central banks in Norway’s main trading partners have cut their policy rates in several rounds since early summer 2024. Market expectations indicate that most of the rate cuts are now behind us (Chart 1.4).
The global economic outlook is marked by the shifts in US policy after the new US president took office in January this year. The US has raised tariffs on Chinese imports and on aluminium and steel imports from all countries. Tariffs were also imposed on imports from Mexico and Canada but have largely been postponed for the time being.
The projections for growth among trading partners in 2025 have been revised down since the previous Report, partly owing to higher tariffs and heightened uncertainty about future developments. At the same time, overall growth this year is still projected to be slightly higher than in 2024 and to pick up somewhat further in 2026, reflecting a projected upswing in European countries. Key drivers are lower interest rates and prospects for continued real wage growth. In addition, some European countries have announced an increase in defence spending. Growth is expected to decline in both the US and China.
Monetary policy in Norway
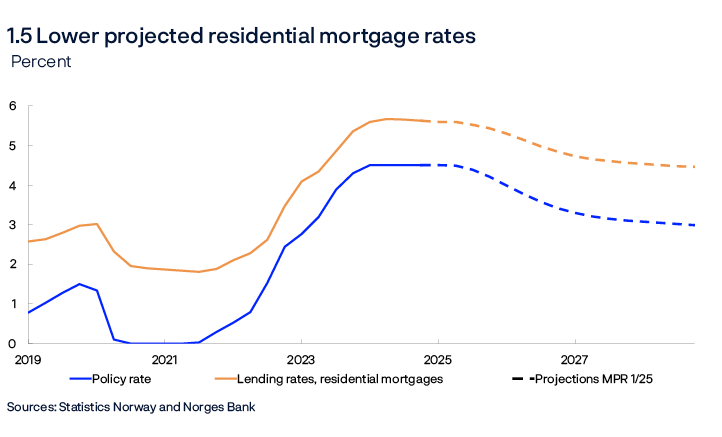
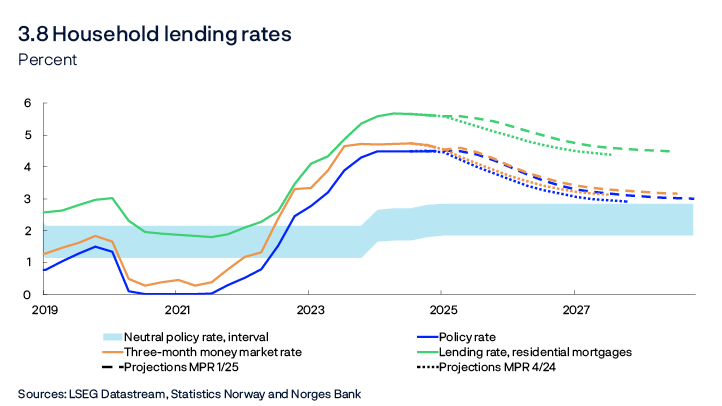
The policy rate was raised significantly to tackle high inflation, and since December 2023, the rate has stood at 4.5%. At this monetary policy meeting, Norges Bank’s Monetary Policy and Financial Stability Committee decided to keep the policy rate unchanged. The Committee projects that the policy rate will most likely be reduced in the course of 2025. The forecast is consistent with a decline in the policy rate to 4% by the end of the year, followed by a gradual further decline over the coming years. The policy rate forecast has been revised up somewhat from the previous Report. If the economy evolves as projected in this Report and the policy rate is reduced in line with the forecast, the average residential mortgage rate is expected to decline from 5.6% at present to 4.5% in 2028 (Chart 1.5).
The economic outlook in Norway
Economic growth in Norway is projected to pick up ahead, with an increase in household demand providing the main impetus to growth. Wages rose significantly faster than prices in 2024, and real growth in wages is also expected ahead. In addition, a lower policy rate further out will reduce household interest expenses. In 2024, households saved a large share of their increased income, but the saving ratio is projected to be more stable between 2024 and 2025, with a pickup in consumption growth.
After falling, housing investment is also expected to pick up in the course of autumn. New home sales have risen, and prices in the secondary housing market have increased more than projected in the previous Report. Higher secondary market prices make it more profitable to build new homes.
On the other hand, oil investment is expected to start declining as ongoing development projects are completed. As the effects of the past krone depreciation wane, export growth will also decline. In addition, public demand growth is assumed to slow.
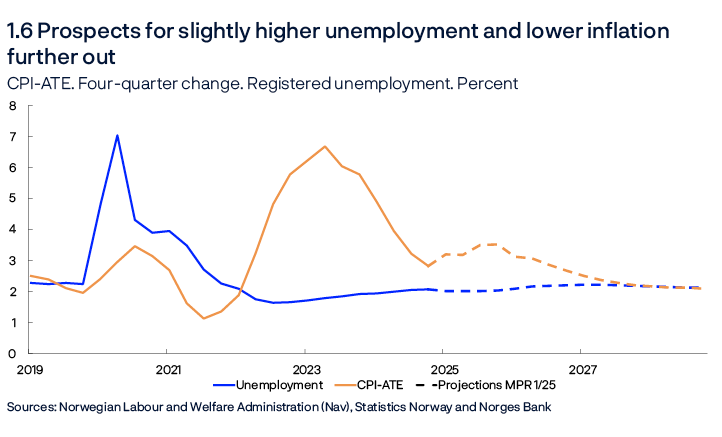
In the projections, employment growth remains solid but does not rise in line with mainland GDP growth. Employment growth is somewhat lower than labour supply growth. This leads to a small rise in registered unemployment to 2.2%, broadly in line with pre-pandemic levels.
Low productivity growth and high wage growth have led to a rapid rise in costs for Norwegian firms, which has pushed up inflation. In the projections, productivity growth picks up somewhat at the same time as wage growth slows from 5.6% in 2024 to 4.5% in 2025 and slows further to the end of the projection period. Combined with the recent strengthening of the krone exchange rate, inflation is likely to move down gradually towards the 2% target further out. At the same time, inflation is expected to pick up somewhat through the remainder of the year, due to higher-than-expected cost inflation and because of the base effect stemming from the decline in childcare prices in August 2024 dropping out of four-quarter inflation. Norges Bank’s Expectations Survey indicate that long-term inflation expectations have declined. Although expectations remain slightly above 2%, they are now at about the same level as in 2020 and 2021.
Uncertainty and risk
The forecasts are uncertain. The world is marked by geopolitical tensions and trade policy uncertainty. This also creates uncertainty about the domestic and global economic outlook.
Regional Network contacts report heightened uncertainty, and text-based measures of policy uncertainty are at historically high levels (Chart 1.A). In financial markets, US equity indexes have fallen since the previous Report, while European indexes have risen. Indicators of financial market uncertainty have risen a little.
![1.A Heightened uncertainty regarding international economic policy
Text-based measures of uncertainty
Line chart
Sources: St. Louis Fed (FRED) and https://www.policyuncertainty.com/trade_cimpr.html
The numbers have been normalised by subtracting the average value and dividing by the standard deviation. The average and the standard deviation is calculated over the period 2008-2019. The economic policy uncertainty index is from Baker, S. R., Bloom, N. and Davis, S. J., Global Economic Policy Uncertainty Index: Current Price Adjusted GDP [GEPUCURRENT], taken from FRED, Federal Reserve Bank of St. Louis; https://fred.stlouisfed.org/series/GEPUCURRENT. The trade policy uncertainty index is based on Caldara, D., M. Iacoviello, P. Molligo, A. Prestipino and A. Raffo (2020) “The Economic Effects of Trade Policy Uncertainty”. Journal of Monetary Economics, 109, pp 38–59. Data taken from https://www.policyuncertainty.com/trade_cimpr.html.](/contentassets/510bd13f598847a5898ae17be20c0a7c/en-638790314134480967/imageslide21.png?v=31032025152334)
There is a clear risk of more extensive trade restrictions than assumed, which may result in lower international economic activity than projected, which alone would dampen domestic activity. If a large share of exports to the EU – by far Norway’s largest trading partner – were to be subject to tariffs, the effects on the Norwegian economy could be particularly negative. The impact of higher tariffs on domestic inflation is uncertain. On the one hand, lower activity could dampen inflation. On the other hand, higher tariffs alone could push up inflation in countries that implement tariffs, which could in turn result in higher inflation for goods imported to Norway from these countries. Trade policy turbulence could also affect foreign exchange markets, which in turn could influence inflation in Norway.
At the same time, the impact of domestic conditions on inflation is also uncertain ahead. Overall annual wage growth in 2024 was higher than expected and higher than the wage norm in manufacturing. Manufacturing profitability is high, and manufacturing workers’ share of value added is low. This may result in higher wage growth ahead than assumed. On the other hand, Norges Bank’s Expectations Survey indicates that the social partners envisage lower wage growth in 2025 than projected in this Report.
In February, inflation rose markedly and unexpectedly after slowing markedly through 2024. When inflation deviates considerably from the projections and the deviation cannot only be attributed to specific factors, as is the case today, it is more difficult to project future developments. Inflation fell faster through 2024 than implied by the historical relationship between inflation and, for example, wage growth. After the recent pickup, inflation is more consistent with the historical relationships. Inflation is expected to remain higher for a period ahead than projected in the previous Report. Should the pickup in inflation be due to more temporary conditions, inflation may turn out to be lower than projected.
2. Basis for the projections
International economy
High inflation and rapidly increasing policy rates dampened economic activity among trading partners in 2023. Through 2024, higher real wages and lower policy rates boosted growth. Unemployment has remained low among most trading partners.
GDP growth among Norway’s five main trading partners overall was little changed from 2024 Q3 to Q4 and was slightly higher than projected in the previous Report, published in December 2024. Growth was strong in China, Sweden and the US, while it was low in the euro area and the UK.
GDP growth among trading partners is projected to increase slightly in 2025 and 2026 and is expected to stimulate the Norwegian economy. At the same time, the projections for 2025 are somewhat lower than in the previous Report. The projections are based on the following:
- US tariffs on Chinese imports and aluminium and steel imports in general have been raised. Tariffs may be raised further and include more countries, but the scale of such changes is uncertain.
- In Europe, higher real wages, interest rate reductions and increased defence and infrastructure investment are expected to boost activity, while trade policy uncertainty is likely to dampen demand. GDP growth in the euro area is expected to rise ahead.
- In the US, lower household income growth, lower immigration and higher import tariffs are likely to depress GDP growth ahead. In addition, uncertainty relating to economic framework conditions, both domestically and in relation to other countries, may dampen demand.
- In China, government stimulus measures are expected to push up activity levels, while higher tariffs on goods trade, a shrinking labour force, high local government debt and highly indebted state-owned firms will dampen growth ahead.
Headline CPI inflation among Norway’s trading partners has declined substantially since the peak in 2022. Since autumn 2024, headline inflation has risen somewhat among several trading partners, while the decline in core inflation has slowed. Core inflation is expected to decline gradually towards inflation targets, and annual growth is expected to decline from 3% in 2024 to 2.6% in 2025 and then to slightly above 2% from 2026. The projection for 2025 has been revised up slightly compared with the previous Report. The projections are based on the following:
- Inflation has been higher than projected in the previous Report.
- Higher tariffs will push up US inflation slightly ahead.
- Wage growth is projected to decline markedly from 2024 to 2025.
Several central banks have reduced policy rates further since the previous Report. According to market pricing, further policy rate cuts are expected in the US, the euro area and the UK. The market has not priced in further policy rate cuts in Sweden. Overall, policy rate expectations among trading partners are slightly higher than in December, primarily reflecting upward revisions for the euro area and Sweden. US policy rate expectations for the coming years have decreased slightly.
Since the previous Report, long-term interest rates overall have increased in Europe, while they have decreased somewhat in the US. At the same time, equity prices have advanced in Europe and declined in the US.
The VIX index, which measures expected volatility in the US equities market, is often used as an indicator of uncertainty. The index has risen since the previous Report but is not at a high level compared with previous turbulent periods in international markets. However, the price of gold, which often rises in periods of uncertainty, has increased since December and is close to a historical high.
Energy prices
Oil prices are around USD 70 per barrel, lower than in previous years (Table 2.A). Prices have fallen slightly more than futures prices indicated in December, likely reflecting reduced global growth expectations among many market participants and OPEC+ signals of production hikes from April this year. Moreover, a possible ceasefire between Russia and Ukraine could boost Russian oil exports. At the same time, futures prices may also reflect a potential reduction in global oil production due to US sanctions on Iran and Venezuela and US tariffs against Mexico and Canada.
Table 2.A Energy prices
|
Percentage change from projectionsin Monetary Policy Report 4/2024 in brackets |
Average price (2010–2019) |
Realised prices and futures prices1 |
|||||
|---|---|---|---|---|---|---|---|
|
2023 |
2024 |
2025 |
2026 |
2027 |
2028 |
||
|
Oil, USD/barrel |
80 |
83 |
80 |
72 (-2) |
68 (-4) |
67 (-3) |
67 |
|
Dutch gas, EUR/MWh |
20 |
41 |
34 |
44 (8) |
36 (4) |
29 (0) |
26 |
|
German electricity, EUR/MWh |
42 |
102 |
90 |
97 (9) |
87 (5) |
77 (0) |
70 |
|
Electricity in South Norway, øre/kWh |
31 |
84 |
55 |
56 (6) |
56 (4) |
55 (-4) |
56 |
|
Electricity in northern Norway, øre/kWh |
32 |
43 |
32 |
18 (-31) |
30 (-6) |
34 (-8) |
37 |
European gas prices have risen through 2024 and continued to rise into the beginning of 2025. Since mid-February, gas prices have fallen again and are now little changed compared with December. Through 2025, futures prices will be underpinned by low European gas inventories and the continued need for liquid natural gas (LNG) imports. Futures prices have declined due to a likely increase in global LNG supply. In addition, a possible ceasefire in Ukraine could also lead to an increase in Russian gas exports to Europe.
Electricity prices in southern Norway have been higher than implied by futures prices in December, reflecting high electricity prices on the Continent at the beginning of 2025. Electricity futures prices for southern Norway in the latter half of 2025 and into 2026 are higher than they were in December, which may reflect relatively low snow accumulation in the mountains and hence less water available for electricity production. In northern Norway, electricity prices have fallen somewhat, and futures prices indicate low prices ahead. Water reservoir levels in northern Norway are high.
- 1 Futures prices at 21 March 2025.
Sources: LSEG Datastream and Norges Bank
Norwegian mainland GDP
Following a rapid post-pandemic recovery, growth in the Norwegian economy has moderated (Chart 2.1). Higher interest rates and higher cost and price inflation have dampened demand in the Norwegian economy in part by reducing investment and household consumption. On the other hand, a weaker krone has fuelled a sharp rise in exports. An expansionary fiscal policy and strong petroleum investment have also lifted mainland activity. In 2024, mainland GDP growth slowed in the period between Q3 and Q4 and was sluggish for the year as a whole.
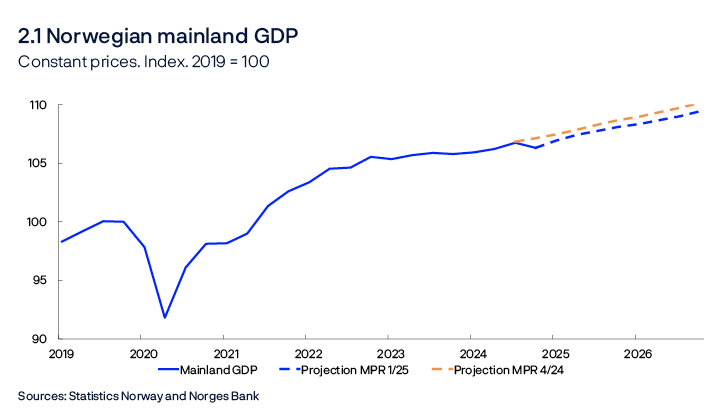
Growth was weaker towards the end of 2024 than projected in the previous Report, but is expected to be a little higher in the coming quarters than previously projected. The projections are based on the following:
- The decline in growth in 2024 Q4 can be partly attributed to volatile components, such as agriculture and fisheries and aquaculture, and is expected to largely reverse in 2025 Q1.
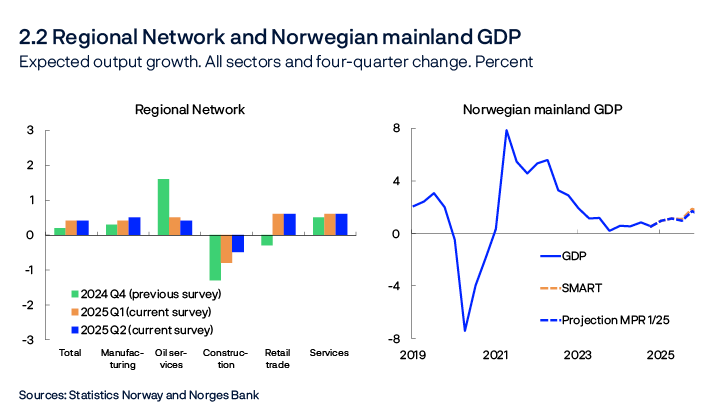
- Norges Bank’s Regional Network contacts expect higher activity in 2025 Q1 than in the previous survey and expect growth to be stable through 2025 H1 (Chart 2.2, left panel). Output growth is expected in the period to summer in all sectors except construction.
- Norges Bank’s System for Model Analysis in Real Time (SMART), which weights projections from a broad set of models, projects a pickup in growth in the coming quarters (Chart 2.2, right panel).
Growth in Norwegian mainland GDP is projected to be 1.2% in both 2025 and 2026 (Chart 2.3) and to rise further out in the projection period. The projections are based on the following:
- Further out, lower interest rates will boost private consumption growth and increase housing and business investment.
- Higher demand among Norway’s trading partners will boost demand in the coming years. The recent krone appreciation pulls in the opposite direction.
- Lower petroleum sector investment will curb growth.
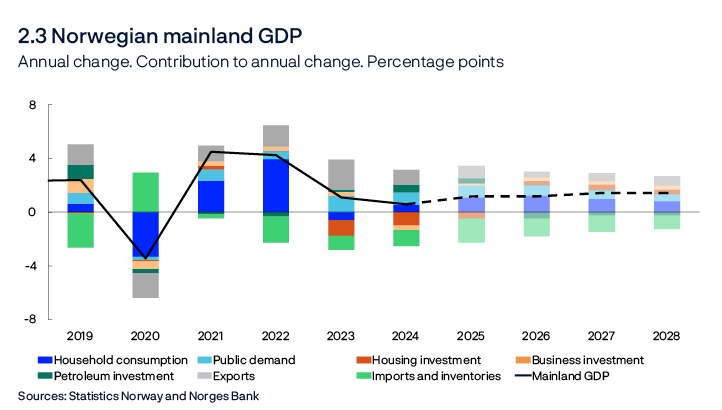
Compared with the previous Report, the level of mainland GDP is lower, primarily reflecting a downward adjustment of housing investment.
Indicators of uncertainty surrounding point forecasts in the near and medium term
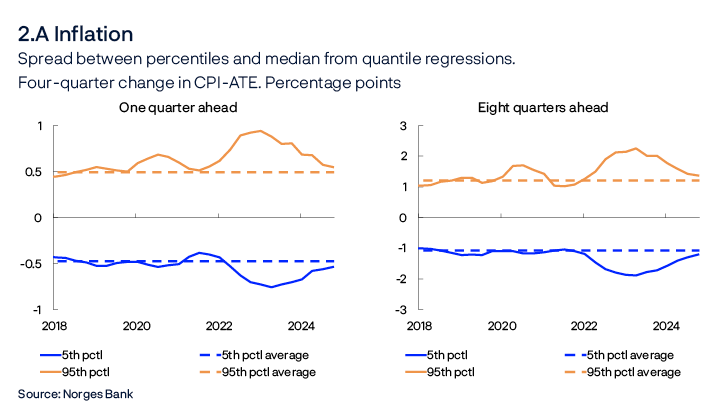
Economic expectations and projections will always be associated with substantial uncertainty. As an aid to understanding macroeconomic uncertainty, we use a model framework to quantify the uncertainty linked to the evolution of three key macroeconomic variables: GPD for mainland Norway, consumer prices and house prices.1 The models help shed light on uncertainty surrounding a set of point forecasts. The simple model framework provides one of several possible indicators of risk evolution over time. The overall assessment of risk ahead will always be based on a combination of judgement and model estimations. This analysis is based on figures for the period to 2024 Q4.
In this box, we use the difference between the median and the 95th and 5th percentiles, respectively, in the model apparatus’ estimated distribution ahead as a measure of upside and downside risk. The charts show the evolution of upside and downside risk across the different variables.
Inflation uncertainty increased markedly over 2022, as measured by the difference between the 95th and 5th percentiles, with a particular increase in the upside risk. Up to the end of 2024, the uncertainty has gradually abated and become more balanced, and both near-term and medium-term uncertainty are now more closely in line with their historical average (Chart 2.A). Note that the inflation data for January and February this year are not included in the analysis.
The models indicate that near-term uncertainty around mainland GDP growth is relatively balanced and close to normal levels, while the downside risk has decreased a little (Chart 2.B, left panel). Medium-term uncertainty is somewhat lower than the average for the 2010s. It is the downside risk that has been somewhat lower recently (Chart 2.B, right panel).

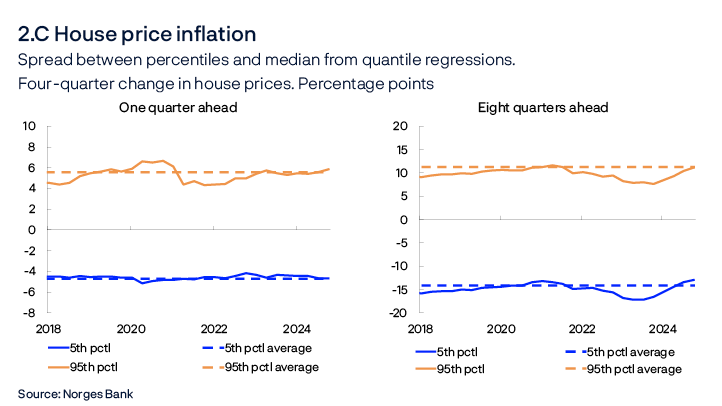
In the near term, uncertainty about house price inflation is balanced and close to its historical average (Chart 2.C, left panel). In the medium term, the downside risk has been higher than normal over a couple of years but has recently receded again (Chart 2.C, right panel).
- 1 The models use quantile regressions, with different indicators to project output, house price inflation and consumer price inflation. See further description in Bowe, F., S.J. Kirkeby, I.H. Lindalen, K.A. Matsen, S.S. Meyer and Ø. Robstad (2023) “Quantifying macroeconomic uncertainty in Norway”. Staff Memo 13/2023. Norges Bank
Households
In 2023, higher interest rates and high inflation led to lower household real disposable income. Lower purchasing power curbed consumption, which fell for the first time since 1989, except during the pandemic. In 2024, wages rose faster than prices, and consumption increased, but less so than household real disposable income, resulting in an increase in the saving ratio.
Consumption growth increased in the first half of 2024, and remained broadly unchanged in the latter half. In 2024 Q4, consumption growth was weaker than expected in the previous Report, reflecting the fact that household disposable income was also lower in 2024 than previously projected. Growth in household consumption is projected to pick up through spring and edge down further ahead. The projections are based on the following:
- According to the Bank’s Regional Network, household-oriented enterprises expect higher demand in the period to summer. In retail trade, the share of enterprises that expect growth has increased substantially. Since the previous Report, more of the enterprises that sell durable consumer goods such as cars, electronics and furniture now report increased activity. Services contacts also expect higher activity and report increased demand in a number of segments including health and fitness, entertainment and media and communication services.
- High real wage growth in 2025 is expected to improve household purchasing power. In 2024, consumption increased far less than income. In 2025, a larger share of income growth is expected to be used for consumption.
- Prospects indicate somewhat slower income growth ahead (Chart 2.4), which will dampen the rise in consumption further out. The saving ratio is expected to increase somewhat through the projection period.
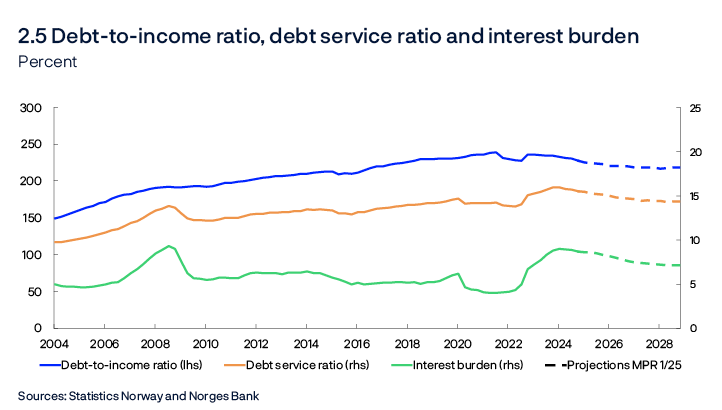
- Debt growth has abated in recent years but picked up a little in autumn. Higher house price inflation and lower interest rates further out are expected to increase household borrowing. On the other hand, the low level of housing completions through the projection period curbs debt growth. Overall debt is expected to rise slightly faster over the next couple of years, albeit slower than income. This will lead to a lower debt-to-income ratio further out in the projection period. Looking ahead, reduced debt burdens and a decline in the policy rate will lead to a gradual fall in the interest burden (Chart 2.5).
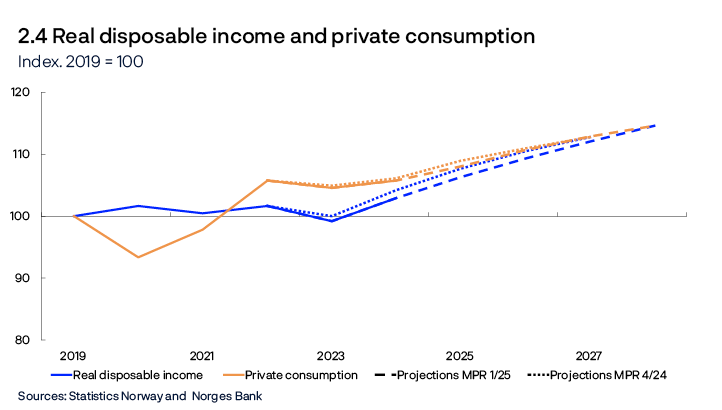
Due to slower growth in consumption than expected towards the end of last year, the projections for consumption growth in 2025 are a little lower than in the previous Report. The projections further out have been adjusted up from the previous Report and the level in 2027 is little changed since December.
Housing market
Housing investment has fallen considerably in recent years owing to the combination of higher interest rates and a sharp rise in construction costs. Housing investment fell further in 2024 Q4, more than expected in the previous Report. Although housing investment is also expected to decline further in 2025 H1, an increase is expected in autumn. The projections are based on the following:
- New home sales are often a good indicator of developments in housing investment a couple of quarters ahead. New home sales were low throughout 2024, which has resulted in few housing starts so far in 2025.
- Construction contacts in Norges Bank’s Regional Network also expect output to fall further in 2025 Q1 and Q2.
- At the same time, stronger household purchasing power is expected to boost demand for both new and existing homes. New home sales figures show a marked increase over the past couple of months, albeit from a low level.
- Higher house price inflation and lower interest rates further out will improve profitability in construction.
Housing investment is lower than in the previous Report (Chart 2.6)
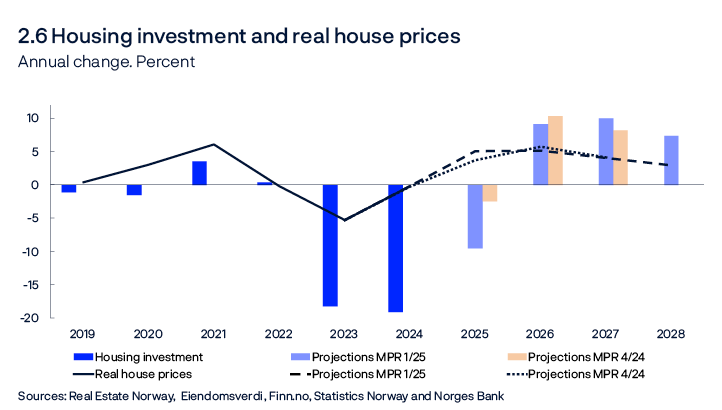
In 2024, prices in the secondary housing market increased by 3%. So far in 2025, house prices have increased markedly and more than projected in the previous Report. Turnover has been very high in recent months and more homes are sold than are listed for sale. The regulatory reduction in the share of equity required to finance house purchases at year-end 2024 has likely had the largest impact on non-home owners. Both turnover and the rise in prices have been higher for small flats in the larger cities than for other segments. This may indicate that some of the recent rise in house prices is due to the easing of lending regulation. In 2025, house prices are expected to rise by 8.1%. The rise in house prices is expected to continue over the next few years but growth is expected to decline further out in the projection period. The projections are based on the following:
- Rapid house price inflation in recent months and a continued high level of activity in the secondary housing market in March may suggest that house price inflation will remain elevated in the coming months.
- Stronger household purchasing power pulls in the direction of higher house prices. At the same time, a slightly higher policy rate path than in the previous Report will have a dampening effect.
- A low supply of new homes in the coming years suggests higher house prices.
Higher-than-expected growth in recent months has lifted the house price projection for 2025, but the projected level for 2027 is little changed since the previous Report.
Firms
In 2024, mainland business investment fell after having risen in the preceding years (Chart 2.7). The decline particularly reflects the substantial rise in interest and other expenses since 2021. Business investment is expected to show a moderate rise through the projection period. The projections are based on the following:
- Regional Network contacts suggest that services investment, which accounts for two thirds of business investment, will decline somewhat in 2025 and increase moderately in 2026.
- Power sector investment is expected to increase substantially ahead (see box in the previous Report). The most recent investment intentions survey from Statistics Norway also indicates rapid growth in power investment in 2025 and 2026.
- Investment in manufacturing and mining and quarrying is likely to increase somewhat in 2025 according to the investment intentions survey. This investment has been unusually high in recent years, driven in part by the energy transition and defence investment. These conditions will likely underpin elevated investment in the period between 2026 and 2028.
- In isolation, lower interest rates will lead to higher investment in the projection period.
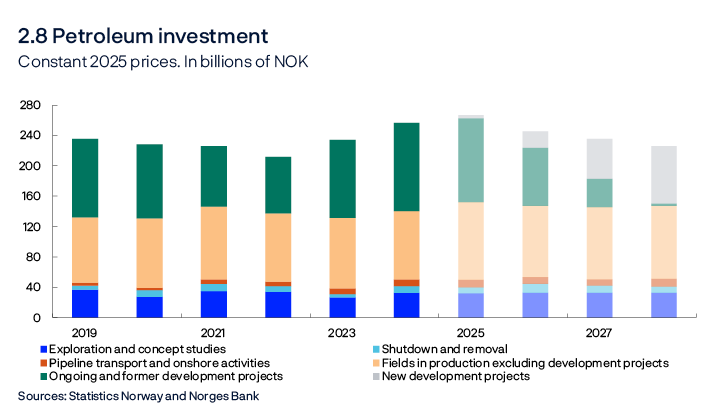
Petroleum investment has increased markedly over the past two years (Chart 2.8), mainly due to the launch of a number of oil development projects in 2022 in response to the petroleum tax package and high oil and gas prices. Petroleum investment is projected to rise somewhat further between 2024 and 2025. Investment is then projected to decline somewhat in the next three years. The projections are based on the following:
- Investment in ongoing development projects will fall from around NOK 110bn in 2025 to close to zero in 2028.
- Oil companies have announced that they will launch several development projects ahead. This will generate substantial investment, but not enough to fully compensate for the completion of ongoing projects.
- The investment intentions survey and projections from the Norwegian Offshore Directorate indicate that oil companies will invest less in 2026 than in 2025. The survey also suggests lower investment (in fields in production) in 2026 than projected in December. The projections for petroleum investment in 2026 and 2027 have therefore been revised down.
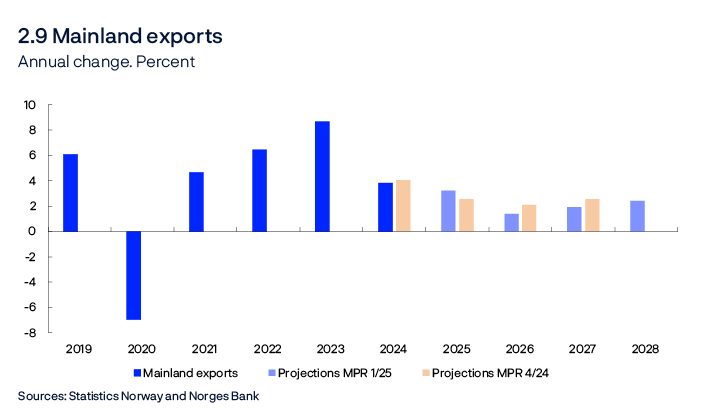
Mainland exports have expanded markedly since 2021 (Chart 2.9), largely driven by stronger competitiveness, increased tourism in Norway and higher investment in oil, gas and green technology abroad. Supported by the same factors, export growth is expected to remain high in 2025, albeit lower than in previous years. Exports are projected to expand moderately thereafter in the period between 2026 and 2028. The projections are based on the following:
- According to the Regional Network, Norwegian exporters expect firm growth in 2025 H1, especially among oil services exporters, but other exporters also expect somewhat higher output in the period to summer.
- Global petroleum investment is likely to increase far less ahead than in the period between 2022 and 2024.
- Trading-partner GDP growth is expected to pick up gradually through the projection period.
- Weaker impulses from the past krone depreciation and a slightly stronger krone are expected to weigh on export growth ahead.
Fiscal policy
Growth in public demand was high in 2023 and fell somewhat in 2024. Updated national accounts figures indicate that the level of public demand in both 2023 and 2024 was lower than previously assumed (Chart 2.10). Public investment in particular was revised down.
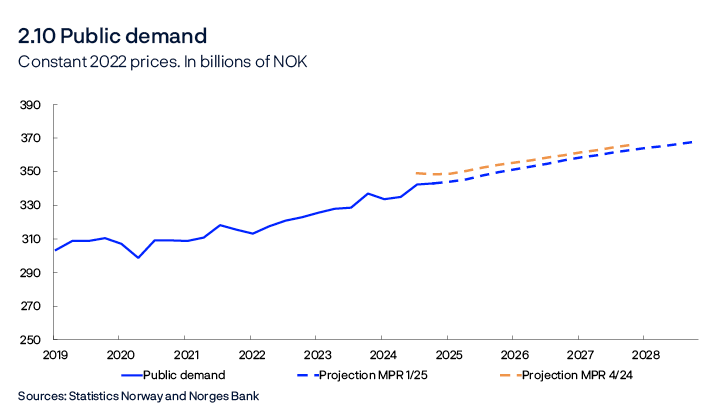
Following several years of strong growth in public demand, growth is expected to drift down in the coming years and to be close to mainland GDP growth in 2028. The projections are based on the following:
- Information on the expected level of public sector activity in the National Budget for 2025 and the budget for 2025 approved by the Storting (Norwegian parliament) implies further growth in public sector demand in 2025.
- The agreed NOK 50bn increase in aid to Ukraine in 2025 through the Nansen Support Programme for Ukraine contributes to an increase in public spending in 2025. The increase is expected to have little effect on domestic demand but will entail a higher budget deficit.
- Increased defence investment is expected to boost growth in public demand through the projection period.
The projections for public demand have been revised up slightly since the previous Report, but due to the revisions for 2023 and 2024 the level will be lower over the projection period than previously assumed. The structural non-oil budget deficit as a share of the Government Pension Fund Global (GPFG) is projected at close to 2.7% in 2025. The deficit is expected to deepen somewhat later in the projection period. This must be seen in connection with the fall in the value in krone terms of the GPFG since the beginning of the year.
Labour market and capacity utilisation
The output gap is a measure of the difference between actual output in the mainland economy and potential output. Potential output is determined by productivity and the highest sustainable level of employment over time consistent with stable wage and price inflation (N*).
The Norwegian economy reached a cyclical peak towards the end of 2022. In 2023 and 2024, unemployment edged up and growth slowed. Through 2024, output remained stable at close to potential. Recent data pull in slightly different directions. Overall, output is still assessed to be near potential, but slightly higher than envisaged in the previous Report. This assessment is based on the following:
- Employment rose slightly in Q4, in line with the projections in the previous Report, and preliminary figures indicate high employment growth at the beginning of the year. Regional Network contacts expect growth in employment in the period to summer. This means that the employment rate appears to remain stable and suggests broadly unchanged capacity utilisation.
- Unemployment has edged down recently. In January, registered unemployment declined to 2.0%, adjusted for seasonal variations, and then remained unchanged in February. LFS unemployment has also declined. Unemployment is now slightly lower than projected in the previous Report , but still close to the level estimated to be consistent with output at potential.
- The share of Regional Network contacts reporting capacity constraints has edged up since the turn of the year, but the share reporting labour shortages has been stable. The shares remain close to their historical averages.
- Both the stock of vacancies and the inflow of new vacancies have declined further but still indicate ample labour demand.
- The models in Norges Bank’s modelling system, which take into account among other things Norwegian mainland GDP, employment, unemployment, wage growth, inflation and investment, indicate that output declined somewhat towards the end of 2024 but remained close to potential (Chart 2.11).
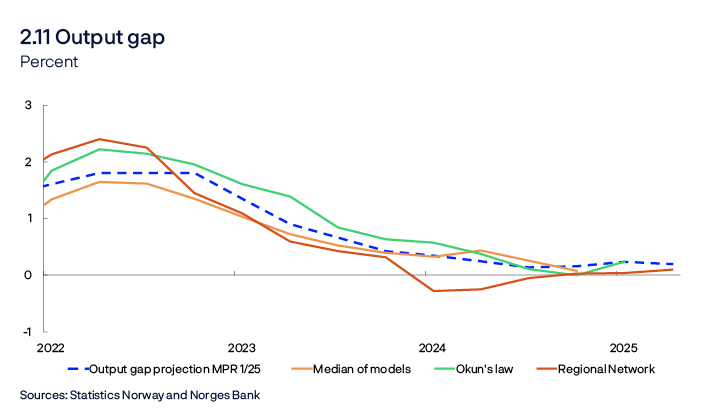
Output is expected to decline and remain somewhat below potential further ahead. This is a downward revision from the previous Report and reflects a slower expected pace of monetary policy easing in the coming years than envisaged in December. Developments are consistent with slower employment growth in 2026 and population growth outpacing employment growth somewhat. The projections imply that registered unemployment will remain close to 2% in 2025 and then rise to 2.2% (Chart 2.12).
The lowest unemployment level estimated to be consistent with stable price and wage inflation over time (u*) has declined in recent decades, and Norges Bank now estimates u* to be around 2.1%. The projection is slightly lower than in the previous Report. This reflects the fact that the share of Regional Network contacts reporting capacity constraints and labour shortages is close to its historical average, in spite of unemployment remaining at a historically low level. The relationship between vacancies and unemployed persons in various occupations may also indicate that the labour market is functioning slightly more efficiently than previously assumed.
Weak underlying productivity growth has resulted in weak potential output growth (y*) in recent years (Table 2.1). The growth in y* is expected to pick up somewhat ahead. The projections are based on the following:
- Norges Bank’s estimates of N* are based on population projections from Statistics Norway, adjusted for current population statistics. There are prospects for moderate population growth in the coming years.
- N* is affected by the inflow of Ukrainian refugees to Norway in recent years. Refugees from Ukraine are expected to continue to arrive in 2025 and 2026, in line with government projections. Historical experience suggests that it will take some time for refugees to find jobs. It is assumed that they will gradually lift N* and pull up y*.
- N* is also affected by developments in the number of temporary foreign workers which is expected to gradually increase in coming years, in pace with a pickup in construction activity.
- Underlying productivity growth is expected to remain low ahead, in line with the average for the last ten years. Weak underlying productivity growth dampens potential output growth.
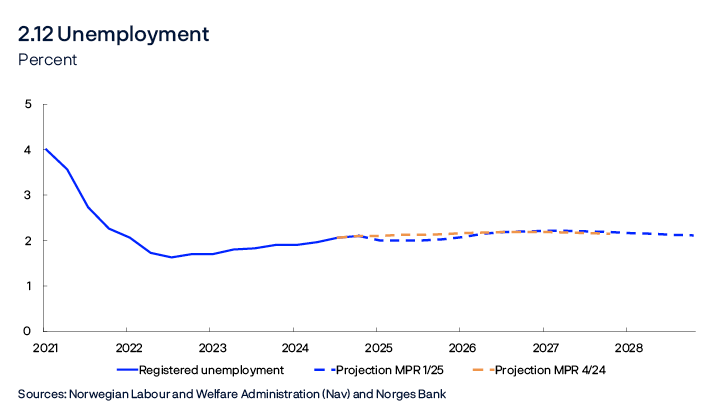
Table 2.1 Output and potential output1
|
Change from projections in Monetary Policy Report 4/2024 in brackets |
Percentage change from previous year |
|||||
|---|---|---|---|---|---|---|
|
2005–2014 |
2015–2024 |
2025 |
2026 |
2027 |
2028 |
|
|
GDP, mainland Norway |
2.8 |
1.6 |
1.2 (-0.2) |
1.2 (-0.2) |
1.4 (0) |
1.4 |
|
Potential output |
2.7 |
1.5 |
1.3 (-0.2) |
1.6 (0) |
1.5 (0) |
1.3 |
|
N* |
1.5 |
0.9 |
0.9 (-0.1) |
0.9 (0) |
0.8 (0) |
0.6 |
|
Trend productivity |
1.2 |
0.6 |
0.4 (-0.1) |
0.7 (0) |
0.7 (0) |
0.7 |
- 1 The contributions from N* and trend productivity do not necessarily sum exactly to the annual change in potential output due to rounding.
Wages
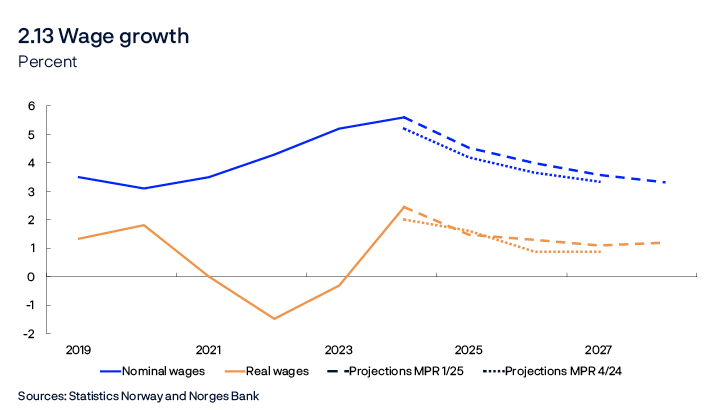
Wage growth has risen in recent years, owing to high inflation, a tight labour market and high profitability in some business sectors. In 2024, wage growth picked up to 5.6%, higher than projected in the previous Report. Wage growth rose across sectors. Combined with disinflation, higher wage growth resulted in a marked rise in real wage growth in 2024.
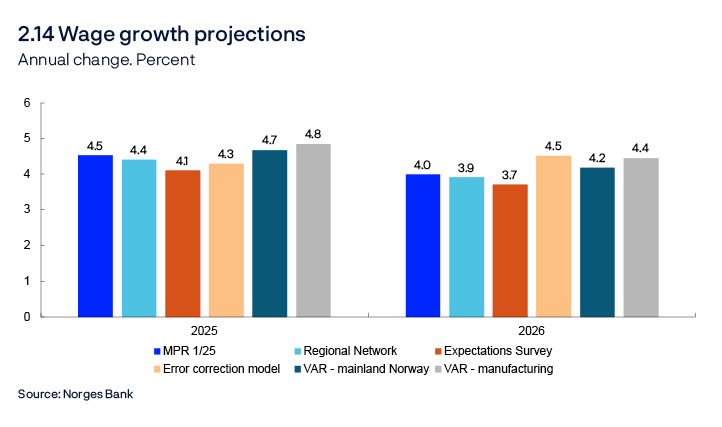
Wage growth is expected to decline to 4.5% in 2025 (Chart 2.13), higher than projected in December. In addition, real wage growth is projected to decline compared with 2024, but to remain higher than the average for the last ten years. The projections are based on the following:
- Regional Network contacts expect wage growth of 4.4% in 2025, while Norges Bank’s Expectations Survey shows that the social partners expect 4.1%. Wage expectations are little changed from 2024 Q4, and expectations measured in these two surveys have historically been accurate indicators of wage growth, suggesting further moderating wage growth in 2025. However, wage expectations have been lower than actual wage growth in recent years. The surveys were completed before the CPI inflation figures for February were published.
- Prospects indicate that unemployment will be close to the current level in 2025 and thereby pull up wage growth.
- The overall business wage share was close to the historical average in 2024 (Chart 3.C, right panel). At the same time, the wage share in manufacturing remained clearly lower than the historical average, pulling wage growth up.
- The Norwegian mainland GDP deflator is expected to increase slightly faster than consumer prices, which could provide room for real wages to rise more than productivity.
- The Technical Reporting Committee (TBU) estimates that inflation will rise by 2.7% in 2025, lower than the estimate for 2024 at 4.1%. This also suggests somewhat lower wage growth, but the analyses in “Key drivers of real wage growth” indicate that lower expected inflation has a moderate effect on nominal wage growth.
- Norges Bank’s empirical models indicate wage growth between 4.3% and 4.8% in 2025 (Chart 2.14). The model with the wage share in manufacturing as an explanatory variable indicates the highest wage growth in 2025.
Several factors indicate that wage growth in 2025 may be higher than projected in December:
- Unemployment has declined and been slightly lower than expected recently, and unemployment is expected to be slightly lower in 2025 than projected in December.
- Producer prices have increased more than projected in the previous Report.
- Wage growth in 2024 was higher than projected in December, which means that the carry-over in 2025 will be higher. In Norges Bank’s empirical models, higher wage growth will, in isolation, push up wage growth in the subsequent year.
Further out in the projection period, wage growth is expected to decline further, reflecting expectations of a looser labour market and lower inflation. The wage growth projections for the coming years are a little higher than in the previous Report, reflecting some expected improvement in firms’ ability to pay compared with the projections in December.
Prices
Inflation has declined markedly since the end of 2022. The pace of decline has slowed in recent months, and underlying inflation rose to 3.4% in February, which was appreciably higher than expected in the previous Report.
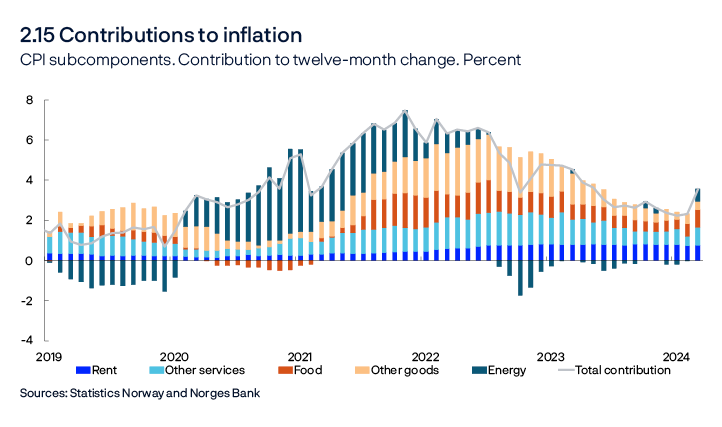
Food and beverage inflation rose sharply in February, partly reflecting a substantial rise in prices for some commodities such as cocoa and coffee. However, some of the rise may also be due to large grocery price adjustments again in February after more steady adjustments in spring 2024. Services prices also rose sharply in February and are contributing to sustaining inflation (Chart 2.15).
The 12-month rise in the CPI-ATE is projected to move up in the period ahead, and the CPI-ATE projections have been revised up from the previous Report. The projections are based on the following:
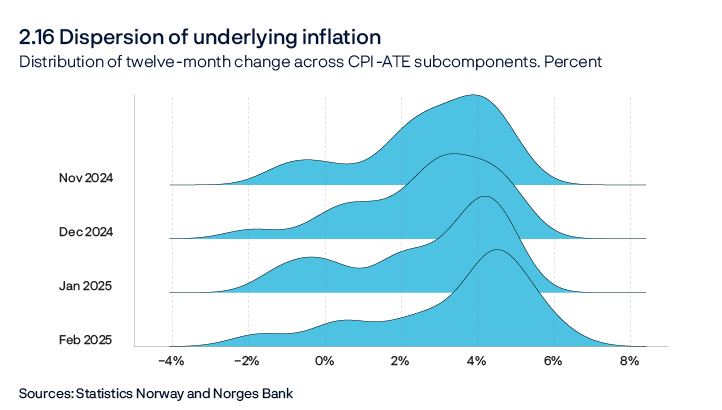
- In recent months, inflation has been high for a number of subcomponents of the CPI-ATE, with many reaching levels of over 4% (Chart 2.16). The rapid rise in prices for food and beverages has lifted inflation in recent months and food price inflation is projected to moderate somewhat ahead.
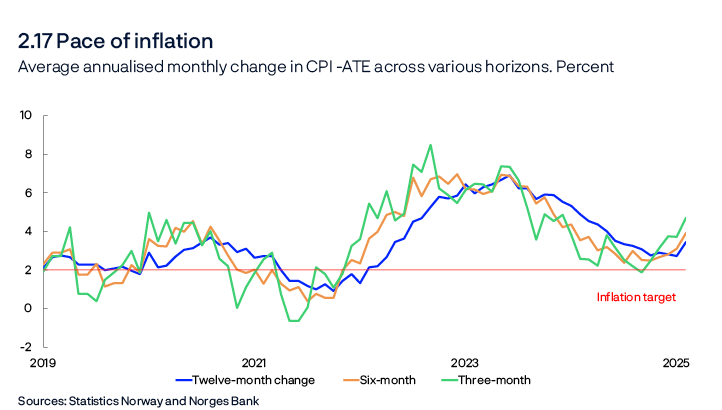
- CPI-ATE inflation has picked up in recent months, and shorter-term measures of inflation, such as annualised three and six-month inflation, are now above 12-month inflation (Chart 2.17).
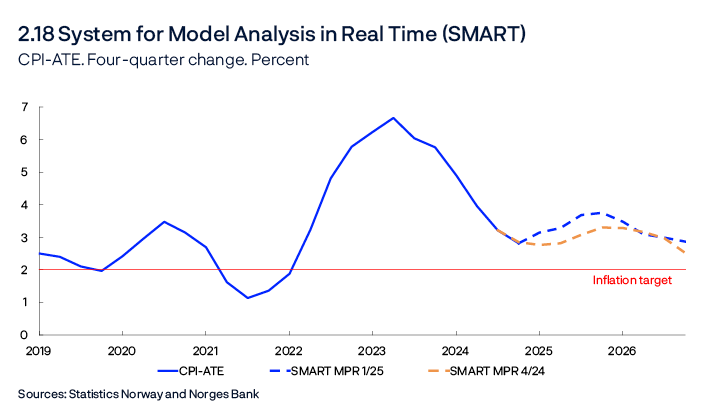
- In Norges Bank’s System for Model Analysis in Real Time (SMART), which weights forecasts from a broad set of different models, forecasts have been revised up since December (Chart 2.18).
- Wage growth in 2024 was higher than projected in the previous Report.
Inflation drivers
In the projections for the coming months, considerable weight is given to both the overall change in price inflation and to recent changes in certain groups of goods and services. In the longer term, price developments will be determined to a greater extent by drivers such as wage and productivity growth and international price impulses to price inflation in Norway.
Over the past year and a half, imported goods inflation has declined considerably and pushed down underlying inflation. Looking ahead, imported consumer goods inflation is expected to rise somewhat but remain close to its average for the period between 2010 and 2019 in the years ahead. Since the previous Report, near-term projections have been revised up somewhat, while the longer-term projections are slightly lower. The projections are based on the following:
- Imported consumer goods inflation has been higher than projected in the previous Report, and the near-term projections have therefore been revised up somewhat.
- The projections for price impulses to imported consumer goods, as measured by Norges Bank’s index of international price impulses to imported consumer goods (IPK), have been revised up somewhat since December (Annex Table 1). However, looking ahead, growth in the index is expected to be low.
- The krone exchange rate has been stronger than projected in the previous Report, suggesting somewhat lower imported consumer goods inflation ahead.
- Freight rates remain at high levels but have fallen in recent months. Freight rates are projected to fall further to pre-pandemic levels.
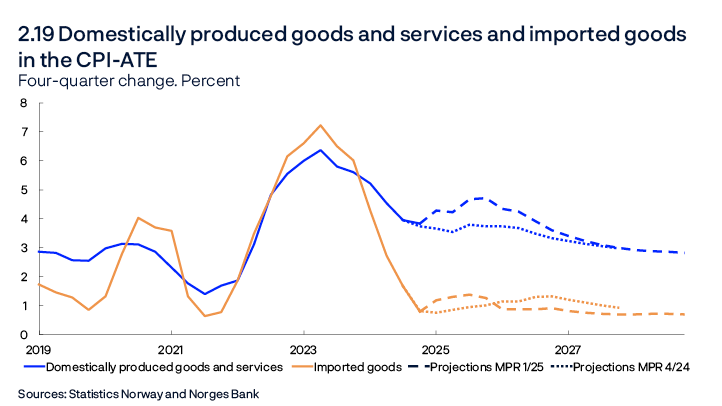
Domestically produced goods and services inflation has declined less than CPI-ATE inflation and remains at a high level. High wage growth in recent years has likely contributed to keeping domestically produced goods and services inflation elevated. Domestic inflation is projected to remain elevated ahead and the projections have been revised up since December (Chart 2.19). The projections are based on the following:
- Wage growth in 2024 was higher than projected, and the projections for wage growth have been revised up for the years ahead.
- Productivity growth was low in 2024 and is expected to take slightly longer to pick up than previously projected.
- The rise in the index of international price impulses to imported intermediate goods (IPI) has moved down and is at a low level, indicating that there are no signs of higher international price impulses to domestic inflation (Annex Table 1).
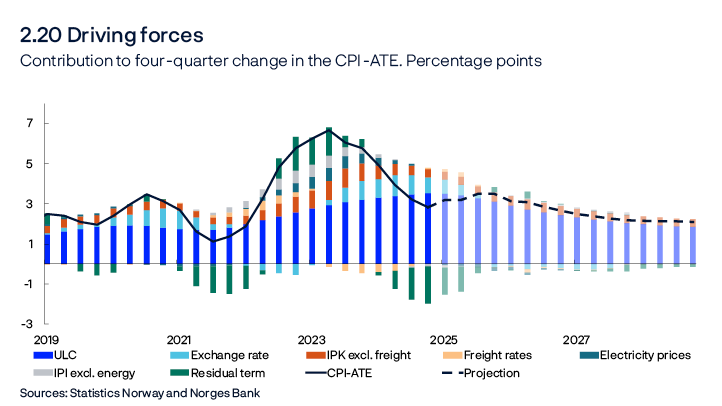
In recent years, there have been substantial deviations between consumer price inflation and what the historical relationship between inflation and key cost drivers would imply (see residual terms in Chart 2.20). This may reflect the fact that firms change prices more frequently when inflation is high. In 2024, disinflation was faster than the developments in cost drivers would imply. New data from Statistics Norway show that administered prices have for some time pulled down underlying inflation, partly explaining the negative residual terms. However, the rise in inflation in recent months has reduced the residual terms somewhat, and inflation ahead is assumed to remain more closely in line with the traditional drivers.
Overall inflation
Over the past year, energy price inflation has been low and has pushed down overall inflation. In February, 12-month CPI inflation was 3.6%, and a faster rise in energy prices contributed to higher overall CPI inflation than CPI-ATE inflation (Chart 2.15). Looking ahead, the projections for CPI inflation have been revised up compared with the previous Report. The projections are based on the following:
- Higher projections for underlying inflation (CPI-ATE) are pushing up the projections for overall inflation (CPI).
- Electricity prices have been higher than projected in the previous Report and electricity futures prices are somewhat higher than in December (see “Energy prices”).
- The Government has proposed a new electricity support package, including a 10 percentage point reduction in VAT on grid tariffs from July 2025. This pulls down CPI inflation in the coming years.
- This package also proposes a fixed electricity price of NOK 0.4 per kWh excluding VAT for consumers, to take effect from October 2025. The existing general electricity support scheme is proposed to continue to cover consumers who decide not to choose the fixed price. The proposal will be presented to the Storting (Norwegian parliament) in connection with the Revised National Budget. It is assumed that the proposal will be approved and that most households in southern Norway will choose this package. The decline in household energy expenses resulting from the package will in isolation pull down the CPI projections by approximately 0.2 percentage point in 2025 and 2026.
With lower energy price inflation, CPI inflation is projected to be lower than CPI-ATE inflation in the coming years.
3. Monetary policy analysis
Model implications of new information
New information
The analysis of the current economic situation in Norway, combined with assumptions regarding exogenous driving forces, form the basis for the monetary policy analysis and the Bank’s forecasts. 1 Examples of exogenous driving forces in the Bank’s macroeconomic model, NEMO, which is the main forecasting model, are petroleum prices, global economic developments and petroleum investment. In the short-term horizon, which consists of the current and next quarter, the model is conditioned on the projections described in more detail in Section 2.
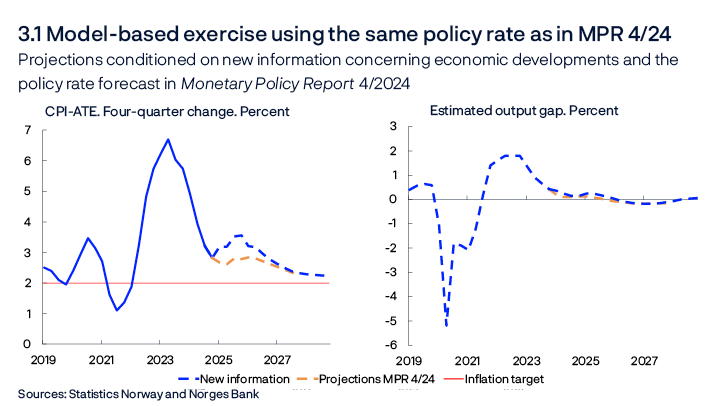
After conditioning on historical data, short-term forecasts and exogenous driving forces, NEMO provides forecasts for the remainder of the forecast horizon. To summarise how new information and assessments of the economic situation have affected the forecasts since the previous Report, we present model-based forecasts of the output gap and inflation given the same policy rate path as in the previous Report.
Key premises for this exercise are:
- Both wage growth and price inflation have been higher than projected in the previous Report, and the near-term forecasts have been revised up. At the same time, the krone has appreciated.
- The output gap is revised up slightly in the short-term horizon, partly reflecting a tighter labour market.
The exercise indicates that the output gap is little changed from the previous Report beyond the short-term horizon (Chart 3.1). Inflation is higher over the entire forecast horizon.
The model’s policy rate path
Norges Bank’s main model, NEMO, generates a policy rate path. New information and new assessments will normally also generate changes in the model’s policy rate path.
Chart 3.2 uses the model to decompose the main driving forces behind changes in the model’s policy rate path since the previous Report. In macroeconomic models like NEMO, economic fluctuations that bring inflation away from target and output away from potential are explained by shocks. This is the case for all the model variables, including the interest rate, as it is not possible to fully represent the Committee’s trade-offs in a technical reaction pattern. Changes in shocks arise when new data and projections differ from those implied by the driving forces in the model. The decomposition shows how shock changes since December contribute to changes in the model-based policy rate path. The monetary policy shocks from the previous Report are held constant in order to isolate the effects of other shocks. The bars show contributions to changes in the model path from different types of shocks, and the broken line shows the sum of the bars. The solid line shows the actual change in the policy rate path.
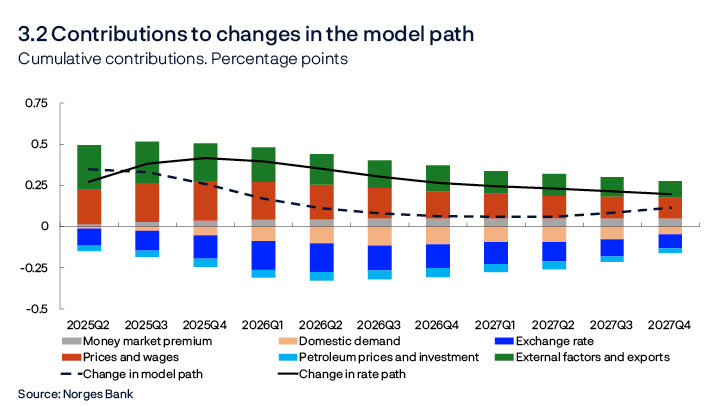
The main contributions to changes in the model path since the previous Report are:
- Underlying inflation has been higher than projected in the previous Report, and the near-term forecasts have also been revised up. In 2024, wage growth was higher than projected in the previous Report and somewhat higher than implied by the driving forces in the model. The near-term forecast of wage growth has also been revised up. Overall, price and wage factors pull up the model path (red bars).
- Inflation among Norway’s main trading partners has been slightly higher than assumed in the previous Report, and the projections have been revised up somewhat for the coming year. Policy rate expectations abroad are also somewhat higher than in the previous Report. Lower growth prospects for Norway’s trading partners in the coming year and a stronger krone exchange rate, in isolation, pull in the direction of lower demand for Norwegian exports, but export growth is nevertheless somewhat stronger than projected in the previous Report. Overall, external factors and exports contribute to a slightly higher model path over the entire forecast horizon (dark green bars).
- The krone exchange rate is stronger than assumed in the previous Report (see “The krone exchange rate”) and is assumed to remain close to the current level. Overall, the krone exchange rate is stronger than implied by the changes in the interest rate differential and other driving forces in the model. This results in a somewhat lower model path (dark blue bars).
- Petroleum prices overall, as incorporated in the model, are slightly lower. The petroleum investment projections have also been revised down somewhat since the previous Report, more than can be explained by the model through lower petroleum prices. Overall, petroleum prices and investment pull down the model path slightly (light blue bars).
- The estimated long-term money-market spread has been revised down slightly since the previous Report. In isolation, this contributes to a less restrictive monetary policy for a given policy rate, thereby pulling the model path up slightly (grey bars).
- Housing investment and household consumption have been weaker than projected in the previous Report and weaker than implied by the model’s relationships, pulling down the model path. House prices have shown a stronger rise than projected in the previous Report, in isolation pulling up the path somewhat. Overall, domestic demand pulls the model path down slightly throughout the projection period (orange bars).
The krone exchange rate
Geopolitical and trade policy uncertainty has increased since the previous Report published in December 2024, with little impact on the krone exchange rate. As measured by the import-weighted exchange rate index I-44, the krone has on average been slightly weaker than projected in the previous Report so far in Q1 but has recently strengthened and is now somewhat stronger than projected. Much of the appreciation followed higher-than-expected consumer price inflation in February, which also resulted in an increase in Norwegian interest rates. Interest rates on NOK-denominated loans are clearly higher than interest rates among an average of Norway’s main trading partners. For interest rates on loans with maturities of up to one year, this difference has increased by 0.25 percentage point since the previous Report, while it is little changed for long-term interest rates. Oil prices are a little lower than in December. Equity prices in the US have fallen but have risen appreciably in the euro area and somewhat less in Norway.
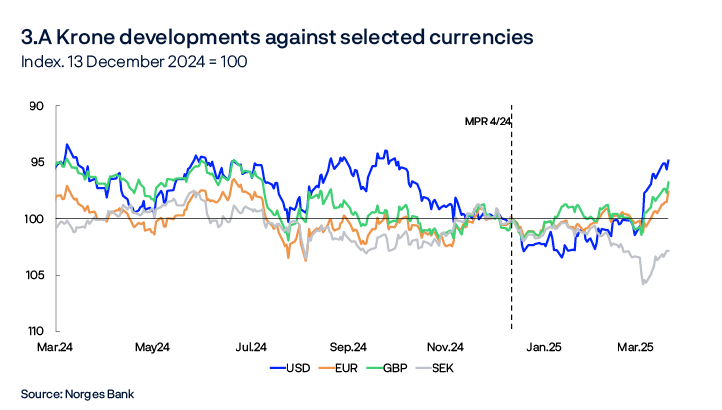
Developments in the krone exchange rate relative to the currencies of Norway’s main trading partners have been mixed (Chart 3.A). The US dollar has depreciated against a number of currencies, including the Norwegian krone. The Swedish krona has moved in the opposite direction, largely strengthening since the beginning of February. The euro and sterling are weaker against the Norwegian krone than in December.
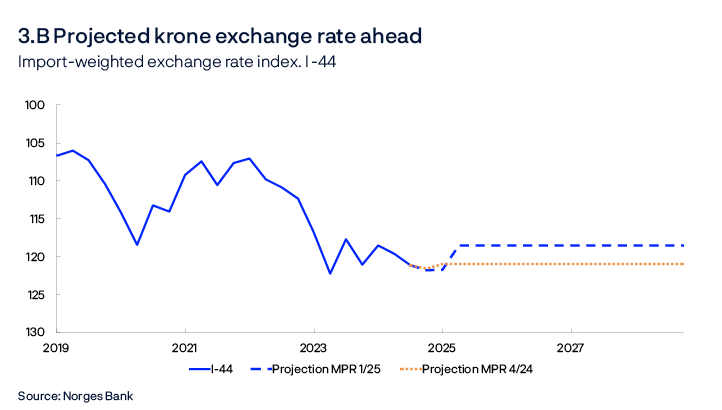
The krone is projected to remain close to the current level ahead. The import-weighted krone exchange rate is projected to remain slightly less than 3% stronger throughout the projection period than projected in the previous Report (Chart 3.B). See also “The effect of monetary policy on the krone exchange rate” for more details about the effect of monetary policy on the krone exchange rate.
- 1 See Section 3.2 of Norges Bank’s Monetary Policy Handbook, Version 2.0, Norges Bank Memo 3/2024 for a more detailed description of how the decision basis is drawn up.
Monetary policy indicators and trade-offs
Simple rule for the money market rate
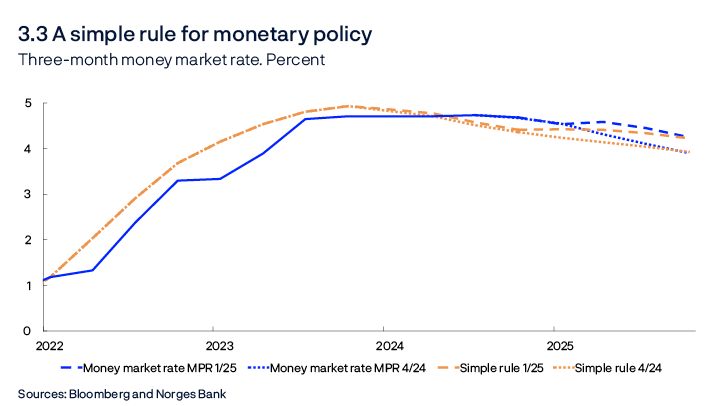
The simple rule for the money market rate has been updated since the previous Report (see box below). Compared with the previous Report, the rule now indicates a money market rate that is approximately 0.30 percentage point higher for the coming year than the corresponding rule would have indicated based on the data available in Monetary Policy Report 4/2024 (Chart 3.3), due to a projected small increase in the output gap and higher inflation in the coming year. At the end of 2025, the simple rule is at about the same level as the projection for the money market rate.
Simple interest rate rule as a cross-check of monetary policy
Estimated simple interest rate rules are often used to provide a simple description of average monetary policy reaction patterns. However, the actual rate may deviate somewhat from that implied by the simple rule, as the central bank takes into account extensive data that are not captured in full by the simple rule. Such data may include the duration of different shocks, variations in the assumed strength of monetary policy transmission and financial conditions. Nevertheless, a simple interest rate rule can be used to cross-check interest rate setting, partly because it is largely independent of the rest of the modelling system.
The simple rule has been updated since the previous Report. The rule we estimate is given by:

The rule states that the interest rate level at any given time depends on the interest rate in the previous period, it–1, the long-term interest rate level1, , the central bank’s inflation expectations three quarters ahead measured as the deviation from the inflation target, ˆ , and the output gap, ŷt. Inflation expectations are measured as the four-quarter rise in prices. Expectations three quarters ahead provide information about expected inflation in the coming period and tend to be less volatile compared with inflation in the current quarter, which may fluctuate more. For the output gap, the gap in the current quarter is included. The output gap provides an estimate of capacity utilisation based on a series of indicators and models and tends to fluctuate less from one quarter to the next.
The rule is estimated using data between 2001 Q2 and 2024 Q4 and thus includes relationships during the pandemic, the period of rates at 0% and the period of high inflation in recent years. The equation gives the following coefficient estimates: ρ = 0.82, γi* = 0.78, γπ = 0.83 og γy = 1.17. 2
Policy rate expectations
Market policy rate expectations further out can provide an indication of how market participants have interpreted new information and how they expect Norges Bank will react. Market expectations have risen since December and are now above the policy rate path from the previous Report throughout the projection period (Chart 3.4), with one-year ahead expectations showing the strongest increase. The upward revision of market expectations is broadly in line with the upward revision of the policy rate path.
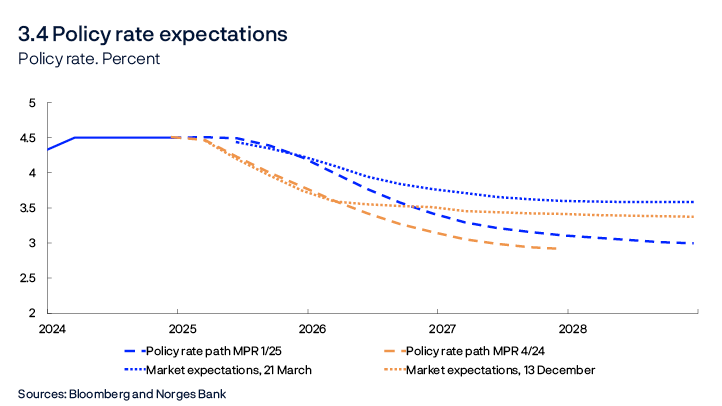
The difference between the market interest rate level and the Bank’s policy rate path further out in the projection period may reflect different policy rate expectations and the fact that term premiums rise with maturity, which means that the market’s actual policy rate expectations may deviate from market-implied policy rates.2 The term premium is a risk premium that partly reflects the uncertainty relating to the future interest rate level and is the investor’s compensation for assuming a higher risk level.
Market policy rate expectations among Norway’s trading partners
As a small, open economy, Norway’s financial markets are closely intertwined with trading partner markets, and Norway’s interest rate level cannot deviate substantially from foreign rates over time. Changes in foreign interest rates can impact the krone exchange rate. Expectations of foreign interest rates now indicate that policy rates among Norway’s main trading partners will continue to fall through 2025, before levelling off and rising somewhat towards the end of the projection period (Chart 3.5). Policy rate expectations abroad are somewhat higher than projected in the previous Report, in particular further out.
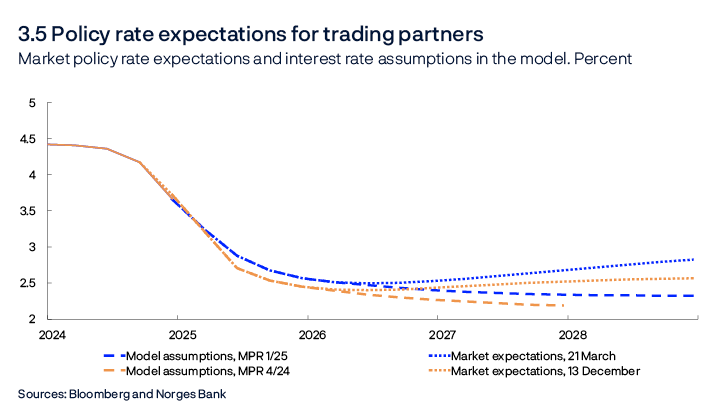
Market policy rate expectations abroad are higher than the central banks’ own estimates of neutral interest rates for trading partners.3 As there is considerable uncertainty about the level of future policy rate expectations, partly due to possible changes in the term premium on market interest rates, the modelling system is conditioned on the foreign market interest rates only in the first year (Chart 3.5). Thereafter, foreign interest rates are assumed to move over time towards an interval for a neutral policy rate abroad that is equal to the Bank’s estimate of a neutral interest rate for Norway, less a long-term interest rate differential of around 0.5%.
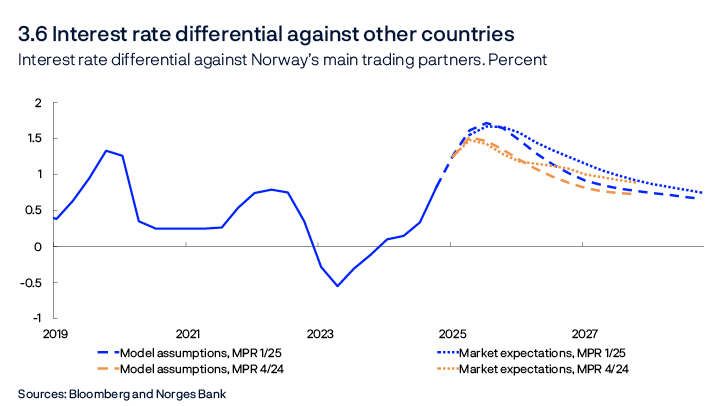
Interest rate differential against other countries
The interest rate differential against Norway’s trading partners has increased from a low level in recent years (Chart 3.6). The chart shows the interest rate differential measured both as the difference between market interest rates in Norway and abroad and between the interest rate forecast and the Bank’s assumptions for interest rates abroad. By both measures, the interest rate differential is higher than in the previous Report for the coming years. At the end of the projection period, the market-based measure is around 0.8 percentage point, while the interest rate differential based on our model assumptions is about 0.7 percentage point, a little higher than the long-term interest rate differential assumed. This may reflect the fact that the policy rate is slightly higher than our estimate of the neutral policy rate interval (see also Chart 3.8).
Expected real interest rate
Over the past year, the Bank’s estimate of the expected real money market rate has been higher than the estimate of the neutral level, which lies in the interval between 0% and 1% (Chart 3.7).4 Key factors determining developments ahead:
- The money market rate forecast is somewhat higher than in the previous Report, contributing to a slightly higher expected real interest rate.
- The inflation projections have been revised up, in particular in the near term, pulling in the direction of a lower real interest rate.
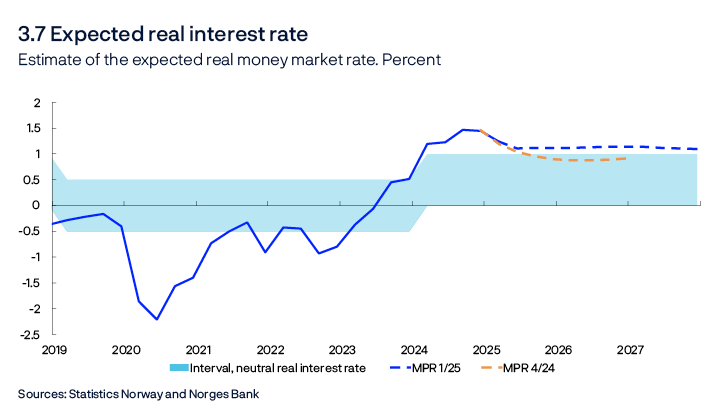
The projection of the expected real interest rate is broadly unchanged in the short term but then remains slightly above the projection from the previous Report from the second half of 2025. The expected real interest rate will lie slightly higher than the Bank’s neutral real interest rate interval over the entire forecast horizon.
Household and corporate interest rates
In pace with the rise in the policy rate, household and corporate interest rates increased substantially in 2022 and 2023. The forecasts in this Report indicate the following:
- The policy rate will most likely be reduced in the course of 2025. The policy rate path is consistent with a gradual decline thereafter to 3% by the end of 2028 (Chart 3.8).
- The forecast indicates a slightly slower reduction in the policy rate in the coming years than in the previous Report.
- The money market spread has fallen recently, and the projection for the long-term money market spread has also been revised down by 0.05 percentage point to 0.15%.
- The interval for the neutral policy rate increases by 0.05 percentage point and ranges between 1.85% and 2.85% from 2025 Q1 as a result of lower long-term money market spreads. The interval for the neutral money market rate will remain unchanged between 2% and 3%.
- The money market rate will evolve in pace with the policy rate ahead.
- The interest rate on new corporate loans, measured as a weighted average of bank and bond debt, has fallen somewhat in recent months, mainly driven by lower interest rates on new bank loans. The corporate interest rate is expected to move broadly in pace with the money market rate ahead.
- Deposit rates are expected to fall when the policy rate is reduced further out.
- Residential mortgage rates are projected to decline when the policy rate is reduced. The mortgage rate is projected to be around 4.5% at the end of 2028.
Trade-offs between inflation, output and employment
The trade-offs between quickly returning to target and promoting high and stable output and employment are reflected in the Committee’s assessment and the inflation and output gap forecasts. Forecasts for the policy rate, inflation and output gap forecasts are shown in the chart in the Comittee’s assessment. The points in Chart 3.9 show the output gap and inflation gap (the difference between inflation and the target) forecasts one to three years ahead in different reports. The location of the points in the chart depend on the shocks to the economy and the monetary policy response to the shocks.5
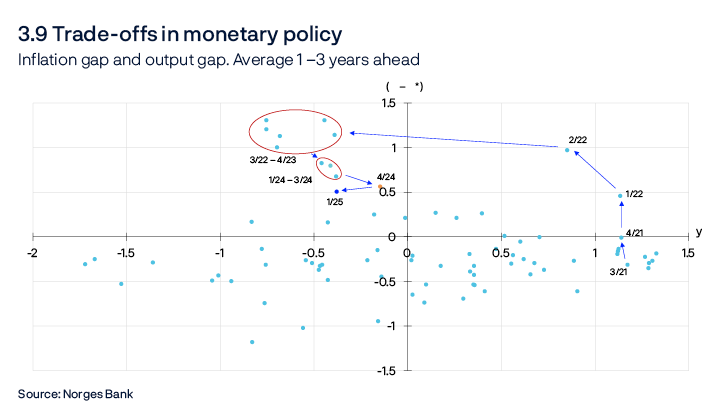
In this Report, the outlook suggests slightly lower inflation but a wider negative output gap one to three years ahead than in the previous Report. This is partly because the interval applied has moved one quarter ahead but also because the state of the economy has changed. The positive inflation gap and negative output gap in the forecasts means that a higher policy rate path than in the forecast would bring inflation closer to target but also widen the negative output gap. On the other hand, a lower policy rate path would boost the activity level but bring inflation further away from target.
- 2 See Benum, A., V.Ø. Opheim and E.S. Wasberg (2023) “Estimations of the term premium on Norwegian government bonds”, Government Debt Memo 3/2023. Norges Bank.
- 3 See Bank of England (2025), Monetary Policy Report, February 2025; ECB (2025), Economic Bulletin, Box 8; Federal Reserve (2025), FOMC Economic Projections, March 2025; and Riksbanken (2024), Seim, A. Neutral Interest Rate – Meaning, Limitations and Assessment. Sveriges Riksbank, 26 November.
- 4 See box in Monetary Policy Report 2/2024.
- 5 For a more detailed explanation of the chart, see box in Section 2.4 in Norges Bank’s Monetary Policy Handbook, Version 2.0, Norges Bank Memo 3/2024.
Boxes
A trade conflict will affect the Norwegian economy through various channels
Higher international trade barriers could lead to lower global growth and higher global inflation. A trade conflict of a certain scale will most likely slow activity growth in Norway through various channels. The overall impact on inflation is more uncertain.
In recent months, the US announced and imposed a series of new tariffs on goods imports from Canada, China and Mexico. On 4 March, the US imposed a 25% import tariff on most goods from Canada and Mexico, but soon thereafter delayed the implementation of tariffs on all goods covered by the trade agreement USMCA. In addition, the US administration imposed a general tariff of 25% on US steel and aluminium imports, which also covers Norway. Canada and China have responded by imposing tariffs on a range of US goods and have announced that additional tariffs may be implemented. Moreover, the US president has announced that a tariff of 25% will be put on goods imported from the EU. If the announced tariffs on goods from Canada, the EU and Mexico are introduced, the US will have increased import protection to about the same level as during the protectionist period of the 1930s (Chart 3.A).
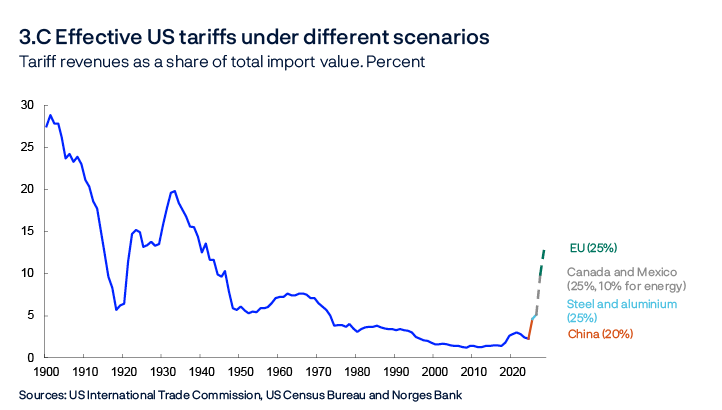
The US president has also announced the possibility of a reciprocal tariff intended to harmonise effective tariffs between the US and an unspecified number of other countries. The US administration has also voiced the possibility of imposing general tariffs on a selection of products such as cars, copper, timber and lumber, semiconductors and pharmaceutical products.
There is considerable uncertainty regarding the ultimate scale and the duration of the different trade measures and the extent to which other countries will reciprocate, which makes it difficult to quantify the effects on both the global and Norwegian economy. This box is therefore limited to a discussion of the main channels through which higher trade tariffs could affect the Norwegian economy.
The tariffs that have been implemented are assumed to have little impact on the Norwegian economy. However, the impact may be larger if the conflict escalates. Higher tariffs on Norwegian exports to the US, and possibly to other countries, will have a direct negative impact on domestic activity. A global trade conflict, defined as a reciprocal increase of tariffs between a number of countries, will also indirectly impact the Norwegian economy through the impact on global output, inflation and interest rates.
Direct channels
The increased tariffs on exports of steel and aluminium to the US imposed on 12 March affect less than 1% of Norway’s overall exports of steel and aluminium and will have little impact on domestic activity. If the US imposes a reciprocal tariff on Norwegian exports, the impact on the Norwegian economy could be much greater.
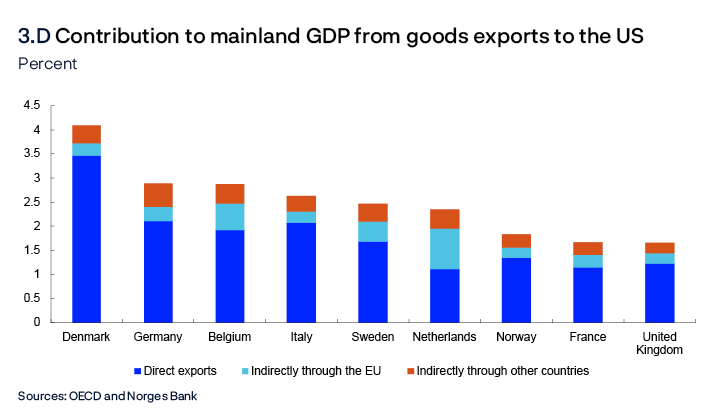
Norway’s direct goods exports to the US, excluding oil and gas, contribute about 1.3% to mainland Norway’s GDP. Sector-wise, aquaculture and retail trade make up the largest contribution of 0.77 percentage point combined. For some goods, for example aeroplane parts, construction machinery and furniture, exports to the US account for a significant share of total revenues. However, Norwegian exports will also be influenced indirectly when the US increases tariffs on other countries. This is due to the nature of global supply chains, whereby some of Norway’s exports to other countries are used as intermediate inputs to goods ultimately destined for the US market. Including these exports, the contribution increases to 1.8% of mainland Norway’s GDP (Chart 3.D).1
Domestic and international exporters can to some degree dampen the negative impact of an eventual US trade barrier by seeking out new markets for their products. If goods intended to be exported to the US are diverted to a third country, these countries may choose to impose protective tariffs to shield domestic producers, provided for under the WTO agreement. When the US imposed tariffs on steel and aluminium in 2018, the EU imposed protective tariffs on steel imports from most countries. However, Norway, Iceland, and Lichtenstein were exempt. A general tariff on US goods imports from the EU may lead the EU to impose protective tariffs on a wide range of imported goods. So far, there is little evidence that Norway will respond to higher global tariffs by introducing trade restrictions of its own.
Indirect channels
A trade conflict will affect global economic developments, which could have spillover effects on the Norwegian economy. The global effects will depend on the size of the tariffs, the number of countries involved, the goods and services affected and the duration of the conflict. However, there is a broad consensus among economists that a global trade conflict of a certain scale most likely will pull down global activity growth and contribute to higher cost growth and price pressures in the short term.2
Experience indicates that higher tariffs pass through quickly to domestic producer prices, while the pass through to consumer prices is more limited.3 This could imply that the impact on global inflation will be fairly muted and temporary. On the other hand, in the current situation where inflation is already above inflation targets in many countries, higher prices could fuel inflation expectations and keep inflation higher for longer.
Moreover, the price effects may be amplified by global supply chains. The production of many goods, such as cars, occurs in several stages, where semi-finished products are processed before being sent cross-border for further processing at the next stage. Tariffs imposed on many stages of the supply chain could result in a significant increase in overall costs and hence price inflation. Both prices and output could also be impacted by supply-side disruptions resulting from producers attempting to find alternative suppliers at different stages of the supply chain.4
A trade conflict escalation could amplify the current trend of rising global trade fragmentation. Trade tensions and geopolitical uncertainty could lead to firms increasingly choosing to create supply chains with like-minded countries or executing a larger share of the production processes domestically to avoid supply chain risk. Global trade promotes economic growth through knowledge dissemination and increased competition. A further fragmentation of the global economy and increased protectionism could therefore reduce global growth potential in the long term and lead to increased inflation impulses.
There is significant uncertainty surrounding internaitonal trade policy. Uncertainty may alone dampen global economic activity. Among other things, increased trade uncertainty could lead to investment plans being postponed.5 Increased trade tensions also impact the financial markets. In addition, households may spend less.
It is not obvious how the ongoing trade conflict will impact international interest rates. A slow-down in activity growth would suggest lower policy rates, whereas higher cost pressure would pull in the opposite direction. If higher tariffs are passed on to prices relatively quickly in a situation where inflation is still above the inflation targets of many countries, the goal of stabilising inflation and anchoring inflation expectations means in isolation that it will take time before we see a further reduction in global interest rates.
Possible direct and indirect effects on the Norwegian economy
Evidence suggests that a global trade conflict would largely act as a negative supply-side shock, which would also have economic spillovers on Norway even if Norwegian exports were to avoid direct tariffs on a large scale. Higher global prices will push up Norwegian import prices for both finished goods and intermediate goods, which, in isolation, will increase overall inflation. At the same time, prices for some products could be reduced if global producers faced with tariffs seek out new markets, which in turn would dampen inflation. Reduced activity resulting from weaker global demand will also pull down inflation. Were Norway to be more extensively affected by tariffs on goods exports to the US or other countries, a further dampening of both output and inflation could occur. The path for inflation will also depend on movements in the krone exchange rate.
The projections in this Report take into account the tariffs already implemented. Higher tariffs have reduced overall growth projections somewhat for Norway’s trading partners compared with the December Report. If new trade policy restrictions are introduced in the very near term, this may pull down growth projections further.
- 1 The calculations are based on a compilation of country-specific input-output tables from the OECD which document the flow of goods and services between different industries and countries. See Documentation Note 2/25: “Calculations of value-added shares in the Box ‘A trade conflict will affect the Norwegian economy through various channels’ (MPR 1/25)”. Forthcoming.
- 2 Barattieri A., M. Cacciatore and F. Ghironi (2021) “Protectionism and the business cycle”. Journal of International Economics, 129 and Bergin, P. R. and G. Corsetti (2023) “The macroeconomic stabilization of tariff shocks: What is the optimal monetary response?”. Journal of International Economics, 143.
- 3 See Amiti, M., S. J. Redding and D. Weinstein (2019) “The Impact of the 2018 Tariffs on Prices and Welfare”. Journal of Economic Perspectives, 33 (s4), pp 187-210 and Cavallo, A., G. Gopinath, B. Neiman and J. Tang (2021) “Tariff Pass-Through at the Border and at the Store: Evidence from US Trade Policy”. American Economic Review: Insights, 3 (s1), pp 19–34.
- 4 See Grossman, G, M., E. Helpman, and S. J. Redding (2024) “When Tariffs Disrupt Global Supply Chains”. American Economic Review, 114 (s4), pp 988–1029.
- 5 See Caldara, D., M. Iacoviello, P. Molligo, A. Prestipino and A. Raffo (2020) “The economic effects of trade policy uncertainty”. Journal of Monetary Economics, 109, pp 38-59 and Boer, L. and M. Rieth (2024) “The Macroeconomic Consequences of Import Tariffs and Trade Policy Uncertainty”. IMF Working Papers 24/13.
Key drivers of real wage growth
Wages account for a large share of business costs, and wage growth is therefore a key factor influencing the path of inflation ahead. Wages are also the main source of household income and hence wage growth adjusted for consumer price inflation (real wage growth) will be an important factor for households’ income and consumption. Following many years of high and relatively stable real wage growth at the end of the 1990s and the beginning of the 2000s, real wage growth has been lower and more variable over the past ten years (Chart 3.E, left panel). This box explains the key drivers of real wage growth in more detail.
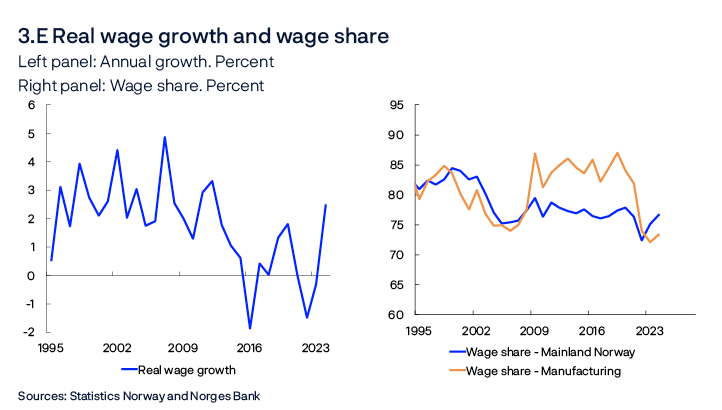
Over time, firms’ capacity to pay wages will determine wage growth, in line with the principles governing the Norwegian model of wage determination. Somewhat simplified, the overall wage-paying capacity of Norwegian firms is dependent on their selling prices and on productivity. Over the past few years, the share of income comprising labour costs (wage share) for firms in mainland Norway has been close to the historical average (Chart 3.E, right panel). However, there are large differences between industries. The part of the manufacturing sector exposed to international competition participates in wage negotiations first. Results from these negotiations set the norm for the rest of the economy. Over the past few years, the wage share in manufacturing has been markedly lower than the historical average.
Both productivity growth and selling prices in manufacturing can vary greatly from year to year. For example, prices may be affected by the krone exchange rate and global conditions, leading to uncertainty about the wage-paying capacity in manufacturing in the short term. Thus, from year to year, wage growth will deviate from the level compatible with a stable wage share. Changes in wage growth resulting from large changes in the wage share will usually contribute to a gradual normalisation of the wage share. In the shorter term, other factors also impact wage growth. For example, labour market tightness and consumer price inflation may come into play. Our empirical models show that wage growth in industries excluding manufacturing may be affected by industry-specific conditions, in addition to the wage norm set by manufacturing.
Over the past few years, consumer price inflation has slowed considerably, and a key question is how disinflation will in isolation affect wage growth. The Technical Reporting Committee on Wage Settlements’ (TBU) consumer price inflation projection, which forms the basis for wage determination in manufacturing, is 2.7% for 2025, and was 4.1% in 2024. Most of Norges Bank’s wage growth models show a positive relationship between expected consumer price inflation and wage growth. In other words, higher (lower) inflation expectations have usually correlated with higher (lower) wage growth. Calculations of the pass-through from expected consumer price inflation to wage growth vary considerably from model to model but indicate far from a full pass-through. Table 3.A shows the consumer price pass-through estimated in some of the models used to forecast wage growth.1 The figures show the effect of a one percentage point increase in inflation expectations on wage growth for 2025. The models use TBU’s projection as an indicator of expected consumer price inflation for 2025.
Table 3.A Pass-through from inflation to wage growth using different empirical models
|
Model / analysis |
Pass-through estimate for 2025 |
|---|---|
|
VAR mainland Norway |
0.14 |
|
VAR manufacturing |
0.13 |
|
Error correction model |
0.36 |
The coefficients in Table 3.A are estimated based on an aggregate time series of macro variables. Inflation was relatively stable through the estimation period, which could impact the reliability of the models. The estimates are therefore uncertain, and the results vary significantly depending on the choice of estimation period and the control variables included.
Norges Bank’s Expectations Survey enables us to utilise the cross-sectional variation of the respondents’ inflation and wage expectations at a given time to learn more about how altered inflation expectations impact wage growth expectations. These data vary more and therefore can be used to supplement analyses of aggregated data. Over time, the surveyed social partners’ wage expectations have also correlated closely with actual wage growth (see box in Monetary Policy Report 1/2024).
To uncover how inflation expectations affect wage expectations, the relationship between respondents’ 12-month ahead inflation expectations and nominal wage growth expectations for the current year is examined.2
The responses of experts (including social partners and economists in the financial sector and academia), business leaders and households are used. The following regression is estimated, where E(w)i is expected wage growth for the current year, E(π)i is 12-month ahead inflation expectations and Wt–1 is wage growth for the previous year:
E(w)i = β1E(π)i + β2Wt–1 + other control variables + εt
Consumer price inflation for 2024 Q4, productivity growth, capacity utilisation, oil prices, exchange rates and wage share for mainland Norway are included as control variables.3
The results imply that inflation expectations have a positive effect on expected wage growth (Table 3.B). The coefficients are positive and significant for all three groups. The coefficients are low throughout, but largest among social partners and business leaders. The results also imply that aggregated wage growth for the previous year is important for wage growth expectations for the current year. Together with the empirical models, the results imply that lower expected consumer price growth does not in isolation contribute to a correspondingly large fall in nominal wage growth.4 In isolation, the results suggest that real wage growth will be lower during periods of increasing consumer price inflation, and real wage growth will increase during periods of disinflation.
Table 3.B Estimated coefficients for different respondents of Norges Bank’s Expectations Survey
|
Social partners |
Economists |
Business leaders |
Households |
|
|---|---|---|---|---|
|
12-month ahead inflation expectations |
0.21*** |
0.15*** |
0.21*** |
0.07*** |
|
Wage previous year |
0.43*** |
0.65*** |
0.64*** |
0.61*** |
The empirical models and the above analysis imply that factors other than inflation, such as wage-paying capacity, will usually affect wage growth more. Productivity growth directly affects firms’ wage-paying capacity: higher productivity growth results in firms having a higher capacity to pay wages before profitability is affected. The models show a clear relationship between productivity growth and wage growth adjusted for inflation (real wage growth). When real wage growth was high in the 2000s, so was productivity growth. Over the past 10 years, both real wage growth and productivity growth have been lower. Productivity growth is expected to rise somewhat ahead, but to be relatively weak when compared with the start of the 2000s.
In addition to productivity growth, Norwegian firms’ selling prices are also important for their wage-paying capacity. Some of the low estimated pass-through from consumer price growth to wage growth must be seen in light of the disparity between Norwegian producer prices and consumer prices facing households. Historically, the covariance between consumer price inflation and producer price inflation, measured using the deflator for mainland GDP, has been relatively low (Chart 3.F, left panel). Over the past 20 years, firms’ prices have increased more than consumer prices reflecting the dampening effect that imported goods prices have had on consumer price inflation, while the rise in export prices has been relatively high. Higher producer price inflation than consumer price inflation means that real wages measured from the producers’ perspective (real producer wages) have grown less than real household wages. Over time we see that it is real wage growth measured with real producer wages that has moved most closely in line with productivity (Chart 3.F, right panel).
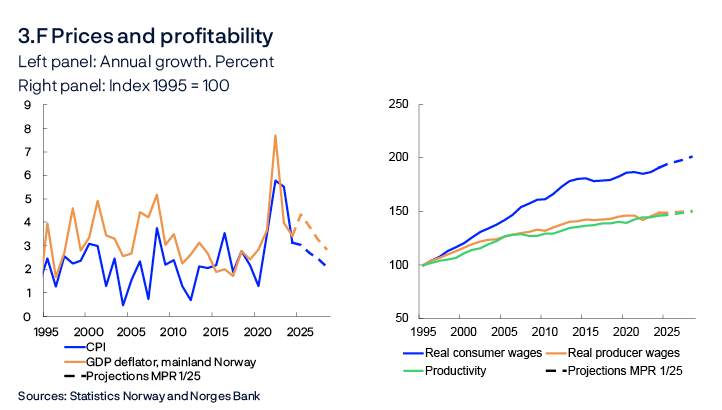
We project that producer price inflation will increase somewhat faster than overall consumer price inflation ahead, this is related to the Norwegian government’s proposed measures to reduce electricity prices and low imported inflation. This provides the foundation for household real wage growth to remain elevated over the coming years, despite continued low productivity growth.
- 1 The VAR models are documented in Matsen, K. A. (2025) “Models for forecasting annual wage growth”. Staff Memo 4/2025. Forthcoming. Norges Bank. The error correction model is documented in Brubakk, L., K. Hagelund and E. Husabø (2018) “The Phillips curve and beyond – Why has wage growth been so low?”. Staff Memo 10/2018. Norges Bank. The coefficients in table 3.A are based on an updated estimation of the model.
- 2 The analysis uses responses from Norges Bank’s Expectation Survey from Q1 in the period 2012-2025
- 3 See Documentation Note 1/2025: “The calculations behind the box ‘Key drivers of real wage growth” for further details of the analysis. Forthcoming.
- 4 There exists potential uncertainty in the causality between expected wages and expected inflation. Our estimates are in line with the findings in recent studies that use more sophisticated techniques (randomised information treatments) to solve this problem. Abberger, K., A.K. Funk, M. Lamla, S. Lein and S. Siegrist (2024) “The Pass-Through of Inflation Expectations into Prices and Wages: Evidence from an RCT Survey”. CEPR Discussion Paper, No. 19595, Buchheim, L., S. Link and S. Möhrle (2024) “Inflation and Wage Expectations of Firms and Employees”. IZA Discussion Paper Series, No. 17269, Savignac, F. , E. Gautier, Y. Gorodnichenko, O. Coibion (2024) “Firms’ Inflation Expectations: New Evidence from France”. Journal of the European Economic Association, 22 (s2), pp 2748–2781.
The effect of monetary policy on the krone exchange rate
Norges Bank does not have a policy target for the krone. The exchange rate is still something that we are concerned with because of its importance for inflation and activity in the Norwegian economy. A weaker krone will normally increase inflation, partly through higher prices for imported goods and services, and increase demand for domestic goods. At the same time, monetary policy affects the krone exchange rate.
Etst+1 – st = (it – i*t) – rpt
This equation, which follows from the theory of uncovered interest parity (UIP), states that an investor must earn the same expected risk-adjusted return on investments in two different countries when measured in a common currency.1 If the interest rate differential against other countries is positive, the return on a risk-free investment will be higher in Norway than abroad. To make investing in both markets attractive, the krone must then be expected to depreciate.
The UIP theory is a component of Norges Bank’s main model, NEMO.2 If the interest rate differential increases unexpectedly, the krone, according to this model, will appreciate immediately, but depreciate thereafter.3
This box explores how unexpected policy rate changes affect the krone exchange rate. What happens if Norges Bank sets a higher policy rate than expected by the market? Changes in market policy rate expectations upon publication of the policy rate decision will to a large extent reflect new information from Norges Bank about the policy rate and rate path. Chart 3.G shows changes in the one-year swap rate – a measure of short-term money market rate expectations in the coming year – and changes in the krone exchange rate against the euro.4 Each point in the chart illustrates the relationship between the change in market policy rate expectations and the krone exchange rate on the date of publication of the policy rate decision for all policy rate decisions in the period 2001–2024. As the chart seeks to isolate the effect of the policy rate decision, changes in the swap rate and the exchange rate are shown during a 30-minute window, from 10 minutes prior to publication to 20 minutes after publication.
Chart 3.G shows that an unexpected increase in market policy rate expectations coincides with a strengthening of the krone. Following the policy rate decision in December 2023, when the policy rate was increased by 0.25 percentage point, the swap rate increased by 0.24 percentage point. At the same time, the krone exchange rate strengthened by 0.88%. This is shown by the green point furthest to the right. The average gradient for the period 2001–2024 is -5.0, which means that the krone exchange rate strengthened by 5% on average upon a swap rate increase of 1 percentage point. The result is about the same if looking at the corresponding relationship between other currency pairs, such as the US dollar, Swedish krona and British pound.

Chart 3.G also shows the relationship between market policy rate expectations and the krone exchange rate for three different time periods: 2001–2009, 2010–2019 and 2020–2024. The pass-through from unexpected policy rate changes to the krone exchange rate was stronger in the middle period than it was in the 2000s and so far in the 2020s. This is shown by the orange, blue and green lines.
Swap rates and other market interest rates largely reflect the market’s monetary policy outlook, but unexpected policy rate changes usually do not fully pass through to all market interest rates on the publication date. Chart 3.H shows how an unexpected 1 percentage point policy rate increase impacts the EUR/NOK exchange rate in the days following the decision.5 The shaded areas show confidence intervals of one and two standard deviations. On average, the exchange rate strengthens by around 2% on the publication date.6 This is in line with the effect in NEMO of an unexpected policy rate increase and empirical studies for other countries.7 Chart 3.H also shows that the krone exchange rate remains between 2% and 4% stronger in the two months following the unexpected policy rate hike. The exchange rate then weakens gradually towards the level prior to the policy rate decision. However, as shown in the chart, the duration of the effect on the exchange rate is highly uncertain.
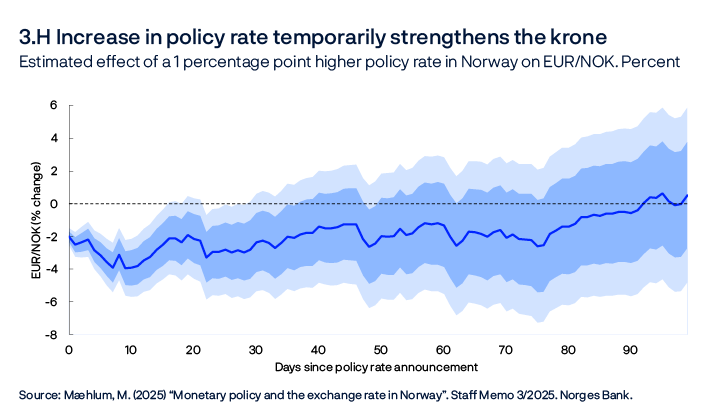
According to the theory described above, unexpected policy rate changes abroad will also impact the value of the krone against the currency of the country or jurisdiction where the rate is changed. Chart 3.I shows how an unexpected policy rate increase of 1 percentage point in the euro area impacts the EUR/NOK exchange rate. The krone depreciates in both the near term and over the next two months before gradually appreciating towards the level prior to the policy rate increase. Policy rate changes abroad thus have an impact on the krone exchange rate similar to that of policy rate changes in Norway, but with the opposite sign.
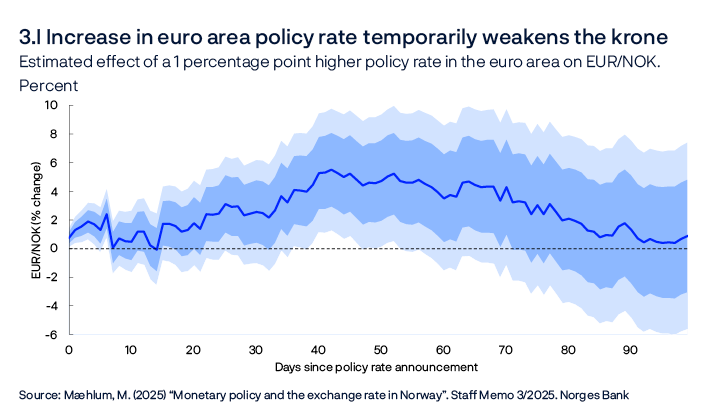
The results referred to in this box show that monetary policy has an effect on the exchange rate. Norges Bank’s krone projections assume a short-term effect of unexpected policy rate changes in line with the results above. The size of the assumed effect depends on how market interest rates are expected to move following a policy rate decision. Beyond policy rate developments, Norges Bank normally has no information other than what the market has already priced into the exchange rate. Hence, it is normally assumed that the movement in the krone exchange rate is relatively flat thereafter.8
- 1 st is log of the nominal exchange rate (higher level denotes weaker exchange rate), i_t is the nominal interest rate in Norway, i*t is the nominal interest rate abroad and rpt is a risk premium in the foreign exchange market. Etst+1 is the exchange rate level that market participants in period t expects for the next period.
- 2 The international literature finds several deviations from pure uncovered interest rate parity, eg by the interest rate differential against other countries’ rates predicting exchange rate movements to a smaller extent than indicated by the theory. See the final paragraph of this box and Engel, C. (2014) “Exchange Rates and Interest Parity”. In Gopinath, G., Helpman, E. and Rogoff, K., editors, Handbook of International Economics, Vol. 4. Elsevier, pp 453–522. However, the empirical literature finds support for unexpected increases in the interest rate differential strengthening the exchange rate.
- 3 This follows from the equation as long as the expected real interest rate differential – the difference between the expected real interest rate (nominal interest rate less market inflation expectations) in Norway and abroad – also increases and long-term expectations for the real exchange rate are unchanged. This applies in NEMO. See also Mæhlum, M. (2025) “Monetary policy and the exchange rate in Norway” Staff Memo 3/2025. Forthcoming. Norges Bank.
- 4 The swap rate also includes a term premium, but it is reasonable to assume that the term premium will not change significantly in the short timeframe around the policy rate decision.
- 5 See Mæhlum, M. (2025) “Monetary policy and the exchange rate in Norway”. Staff Memo 3/2025. Forthcoming. Norges Bank. Chart 3.H shows the results from a local projection of the percent change in the exchange rate a given number of days after the policy announcement on the change in the policy rate. The policy rate change is instrumented by 14 changes in various market rates in the same interval. The instruments, consisting of Forward Rate Agreements and swap rates, reflect changes in market expectations for short money market rates ahead, from 3 months to 10 years.
- 6 The relationship between the krone exchange rate and the one-year swap rate is stronger than the relationship between the krone exchange rate and unexpected changes in the policy rate on the publication date. This is partly due to unexpected changes in the policy rate not passing fully through to the one-year swap rate. The swap rate reflects market expectations of both current and future policy rates. This is why the swap rate normally increases by less than one percentage point when the policy rate increases unexpectedly by one percentage point.
- 7 See Kravik, E. and Y. Mimir (2019) “Navigating with NEMO”. Staff Memo 5/2019. Norges Bank. See also Bolhuis, M. A., S. Das and B. Yao (2024) “A new dataset of high-frequency monetary policy shocks”. IMF Working Papers 24/224. IMF. For an average of 12 advanced economies, the authors find that an unexpected 1 percentage point increase in the policy rate is associated with a 2.1% appreciation of the exchange rate in the near term.
- 8 A large body of research has found that it is difficult to beat random walk forecasts for the exchange rate. See eg Eichenbaum, M.S., B.K. Johannsen and S.T. Rebelo (2021) “Monetary Policy and the Predictability of Nominal Exchange Rates”, Review of Economic Studies, 88, pp 192–228.
Annex
Detailed tables of projections
Table 1 International projections
|
Change from projections in Monetary Policy Report 4/2024 in brackets |
Weights1 Percent |
Percentage change from previous year |
||||
|---|---|---|---|---|---|---|
|
2024 |
2025 |
2026 |
2027 |
2028 |
||
|
GDP |
||||||
|
US |
12 |
2.8 (0.1) |
1.9 (-0.2) |
1.7 (-0.2) |
1.8 (0) |
1.6 |
|
Euro area |
47 |
0.8 (0) |
0.9 (-0.2) |
1.4 (0) |
1.5 (0.1) |
1.4 |
|
UK |
15 |
0.9 (0) |
1 (-0.5) |
1.5 (0.2) |
1.4 (0) |
1.3 |
|
Sweden |
18 |
1 (0.4) |
1.8 (-0.1) |
2.3 (-0.1) |
2.2 (0.2) |
1.6 |
|
China |
8 |
5 (0.3) |
4.5 (0) |
3.8 (0.3) |
4 (0.6) |
3.7 |
|
5 trading partners1 |
100 |
1.4 (0.1) |
1.5 (-0.2) |
1.8 (0) |
1.9 (0.2) |
1.6 |
|
Prices |
||||||
|
Underlying inflation2 |
3 (0) |
2.6 (0.2) |
2.2 (0) |
2.1 (0) |
2.1 |
|
|
Wage growth2 |
4.4 (0.1) |
3.4 (0) |
3.2 (0) |
3 (0) |
2.9 |
|
|
Prices for consumer goods imported to Norway,including freight rates3 |
2.7 (0.2) |
1 (0.9) |
0.7 (0.4) |
0.7 (0) |
0.9 |
|
|
Prices for intermediate goods imported to Norway4 |
0.1 (0) |
1.8 (0.8) |
1.7 (0.2) |
1.5 (0) |
1.5 |
|
Table 2a Consumer prices. Twelve-month change. Percent
|
2024 |
2025 |
||||||
|---|---|---|---|---|---|---|---|
|
Dec |
Jan |
Feb |
Mar |
Apr |
May |
Jun |
|
|
Consumer price index (CPI) |
|||||||
|
Actual |
2.2 |
2.3 |
3.6 |
||||
|
Projections MPR 4/24 |
2.8 |
2.3 |
2.6 |
2.4 |
|||
|
Projections MPR 1/25 |
2.7 |
2.7 |
2.7 |
2.9 |
|||
|
CPI-ATE |
|||||||
|
Actual |
2.7 |
2.8 |
3.4 |
||||
|
Projections MPR 4/24 |
2.8 |
2.6 |
2.7 |
2.7 |
|||
|
Projections MPR 1/25 |
3.4 |
3.2 |
3.1 |
3.2 |
|||
Sources: Statistics Norway and Norges Bank
Table 2b House prices. Monthly change. Seasonally adjusted. Percent
|
2024 |
2025 |
||||||
|---|---|---|---|---|---|---|---|
|
Dec |
Jan |
Feb |
Mar |
Apr |
May |
Jun |
|
|
Actual |
1.0 |
1.4 |
0.9 |
||||
|
Projections MPR 4/24 |
0.4 |
0.5 |
0.4 |
0.4 |
|||
|
Projections MPR 1/25 |
0.7 |
0.6 |
0.5 |
0.5 |
|||
Sources: Eiendomsverdi. Finn.no. Real Estate Norway and Norges Bank
Table 2c Registered unemployment (rate). Percent of labour force. Seasonally adjusted
|
2024 |
2025 |
||||||
|---|---|---|---|---|---|---|---|
|
Dec |
Jan |
Feb |
Mar |
Apr |
May |
Jun |
|
|
Actual |
2.1 |
2.0 |
2.0 |
||||
|
Projections MPR 4/24 |
2.1 |
2.1 |
2.1 |
2.1 |
|||
|
Projections MPR 1/25 |
2.0 |
2.0 |
2.0 |
2.0 |
|||
Sources: Nav and Norges Bank
Table 2d GDP for mainland Norway. Quarterly change.1 Seasonally adjusted. Percent
|
2024 |
2025 |
|||
|---|---|---|---|---|
|
Q3 |
Q4 |
Q1 |
Q2 |
|
|
Actual |
0.5 |
-0.4 |
||
|
Projections MPR 4/24 |
0.3 |
0.3 |
||
|
Projections MPR 1/25 |
0.6 |
0.4 |
||
- 1 Quarterly figures based on monthly national accounts.
Sources: Statistics Norway and Norges Bank
Table 3 Projections of main economic aggregates
|
Change from projections in Monetary Policy Report 4/2024 in brackets |
Percentage change from previous year (unless otherwise stated) |
|||||
|---|---|---|---|---|---|---|
|
Constant 2022 prices (NOK bn) 2024 |
2024 |
Projections |
||||
|
2025 |
2026 |
2027 |
2028 |
|||
|
Prices and wages |
||||||
|
CPI |
3.1 (-0.1) |
3.0 (0.4) |
2.7 (-0.1) |
2.5 (0.1) |
2.1 |
|
|
CPI-ATE |
3.7 (0.0) |
3.4 (0.7) |
2.9 (0.2) |
2.3 (-0.1) |
2.1 |
|
|
Annual wages |
5.6 (0.4) |
4.5 (0.3) |
4.0 (0.3) |
3.6 (0.3) |
3.3 |
|
|
GDP deflator, mainland Norway |
3.4 (0.3) |
4.3 (0.6) |
3.8 (0.3) |
3.3 (0.2) |
2.9 |
|
|
Real economy1 |
||||||
|
Gross domestic product (GDP) |
5857 |
2.1 (0.0) |
2.3 (-0.1) |
0.0 (-0.1) |
0.0 (0.0) |
-0.3 |
|
GDP, mainland Norway2 |
3729 |
0.6 (-0.3) |
1.2 (-0.2) |
1.2 (-0.2) |
1.4 (0.0) |
1.4 |
|
Output gap, mainland Norway (level) |
0.2 (0.1) |
0.1 (0.0) |
-0.3 (-0.2) |
-0.4 (-0.2) |
-0.3 |
|
|
Employment, persons, QNA |
0.6 (0.0) |
0.8 (0.1) |
0.5 (-0.2) |
0.7 (0.0) |
0.7 |
|
|
Registered unemployment (rate, level) |
2.0 (0.0) |
2.0 (-0.1) |
2.2 (0.0) |
2.2 (0.0) |
2.1 |
|
|
Demand1 |
||||||
|
Mainland demand2 |
3750 |
0.1 (-0.3) |
1.7 (-0.6) |
2.6 (0.4) |
2.3 (0.3) |
1.9 |
|
– Household consumption |
1858 |
1.1 (-0.1) |
2.2 (-0.4) |
2.5 (0.7) |
1.9 (0.2) |
1.6 |
|
– Business investment |
381 |
-3.4 (0.7) |
1.7 (-0.9) |
2.8 (0.1) |
2.4 (0.3) |
2.5 |
|
– Housing investment |
157 |
-19.1 (-0.2) |
-11.4 (-8.9) |
8.4 (-1.9) |
10.6 (2.4) |
8.2 |
|
– Public demand |
1354 |
2.7 (-0.8) |
2.4 (0.0) |
2.1 (0.3) |
1.9 (0.2) |
1.5 |
|
Petroleum investment2 |
215 |
9.6 (-0.4) |
4.0 (0.0) |
-8.0 (-2.0) |
-4.0 (1.0) |
-4.0 |
|
Mainland exports2 |
1071 |
3.8 (-0.2) |
3.2 (0.7) |
1.4 (-0.7) |
1.9 (-0.6) |
2.4 |
|
Mainland imports2 |
1497 |
3.9 (1.1) |
2.2 (0.8) |
3.1 (0.4) |
3.1 (0.3) |
2.8 |
|
House prices and debt |
||||||
|
House prices |
3.0 (0.1) |
8.1 (1.8) |
7.8 (-0.7) |
6.5 (0.0) |
5.1 |
|
|
Household credit (C2) |
3.5 (-0.1) |
3.8 (0.0) |
4.0 (0.2) |
4.0 (0.2) |
4.2 |
|
|
Interest rate, exchange rate and oil price |
||||||
|
Policy rate (level) |
4.5 (0.0) |
4.4 (0.3) |
3.7 (0.3) |
3.2 (0.2) |
3.0 |
|
|
Import-weighted exchange rate (I-44) (level) |
120.3 (0.1) |
118.5 (-2.5) |
117.5 (-3.5) |
117.5 (-3.5) |
117.5 |
|
|
Policy rate, trading partners (level) |
4.1 (-0.1) |
2.8 (0.1) |
2.5 (0.1) |
2.6 (0.1) |
2.8 |
|
|
Oil price, Brent Blend. USD per barrel |
80.5 (0.0) |
71.9 (-1.3) |
67.9 (-2.9) |
67.1 (-2.1) |
67.0 |
|
|
Household income and saving1 |
||||||
|
Real disposable income excl. dividend income |
3.7 (-0.5) |
3.3 (0.0) |
2.8 (0.2) |
2.5 (0.4) |
2.3 |
|
|
Saving ratio excl. dividend income (rate, level) |
2.6 (1.1) |
2.6 (0.1) |
2.7 (-0.2) |
3.0 (-0.4) |
3.0 |
|
|
Fiscal policy |
||||||
|
Structural non-oil deficit as a percentage of GPFG3 |
2.7 (0.0) |
2.7 (0.2) |
2.9 (0.4) |
2.8 (0.3) |
2.8 |
|
- 1 All figures are working-day adjusted.
- 2 Annual figures based on monthly national accounts.
- 3 Government Pension Fund Global measured at the beginning of the year.
Sources: Eiendomsverdi, Finn.no, LSEG Datastream, Ministry of Finance, Norwegian Labour and Welfare Administration (Nav), Real Estate Norway, Statistics Norway and Norges Bank