Norges Bank’s Monetary Policy and Financial Stability Committee decided to keep the policy rate unchanged at 4.5% at its meeting on 18 December. Based on the Committee’s current assessment of the outlook, the policy rate will most likely be reduced in March 2025.
International inflation has slowed markedly since the peak
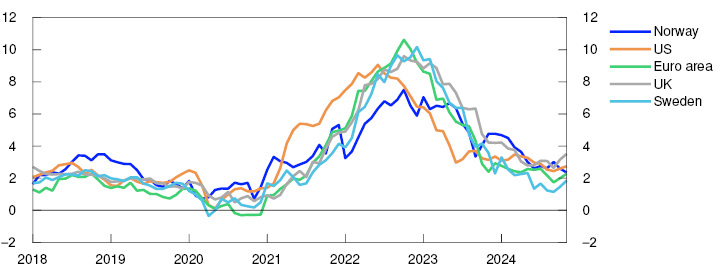
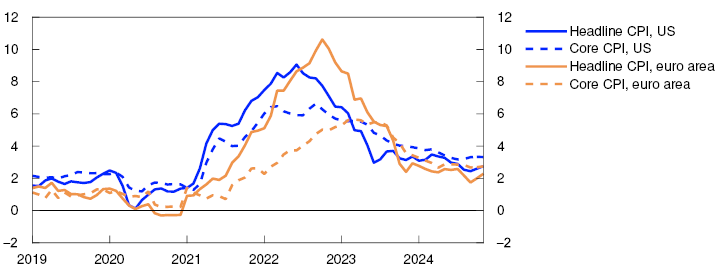
Consumer price inflation among Norway’s main trading partners has declined markedly since the peak in 2022 and has moved closer to inflation targets. Core inflation has also fallen markedly but is somewhat higher than overall consumer price inflation. Economic growth in the US has been high in both 2023 and 2024. Growth is expected to soften next year, but a more expansionary fiscal policy will contribute to sustaining growth. Euro area economic growth has picked up somewhat this year after close to zero growth through 2023. Trade policy uncertainty ahead is likely to dampen growth, but growth is nevertheless expected to firm a bit going forward. Economic growth for trading partners as a whole is expected to pick up somewhat over the next year.
Consumer prices. Twelve-month change. Percent
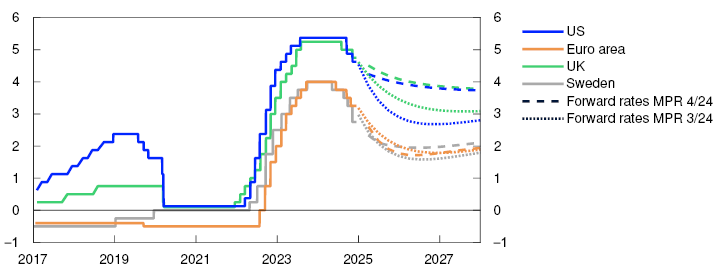
Central banks among Norway’s main trading partner countries started reducing their respective policy rates earlier this year in response to lower inflation. For trading partners as a whole, policy rate expectations are a little higher than in September. The market expects fewer rate cuts by the US Federal Reserve ahead, while the European Central Bank (ECB) is expected to lower its policy rate a bit faster.
Norwegian policy rate expectations have increased since September, and market pricing indicates that the policy rate will be reduced in the course of the first quarter of 2025. As expected, the krone is at broadly the same level as in September. The Norwegian money market spread has fallen and is projected to remain lower ahead than previously assumed. Oil prices are little changed since September, while gas prices have risen.
Import-weighted exchange rate index. I-44

Stronger growth in the Norwegian economy
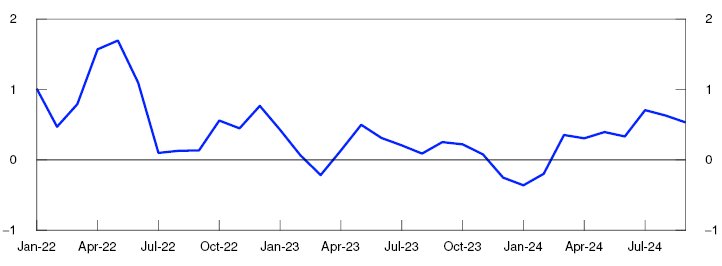
Growth in the Norwegian mainland economy was low in 2023 but has accelerated slightly through 2024, with third-quarter growth exceeding projections. Strong growth in public demand has contributed to underpinning economic activity, while a sharp fall in housing investment has dampened activity. Household consumption increased in Q3. New home sales have risen a little further in recent months but are still very low, and it will likely take time before housing investment starts to rise again. In the secondary market, house prices have increased further since September.
GDP for mainland Norway. Three-month moving average. Percent
Norges Bank’s Regional Network enterprises expect overall growth to pick up a little through winter. Wide differences remain across industries, with strong growth in oil services activity and weakening activity in the construction industry.
Overall output in the Norwegian economy appears to have been around potential since the beginning of 2024. Registered unemployment has shown little change since September and was 2.1% in November, in line with the September projections. According to LFS data, unemployment has remained stable at around 4% since March 2024. Employment increased a little in Q3, as projected in September. Job vacancies remain elevated, and Regional Network contacts expect moderate employment growth over the next months.
Growth in the Norwegian economy is projected to be somewhat lower over the next half-year than in Q3. Solid growth in purchasing power is expected to lift consumption, and combined with high public demand, to contribute to increased economic activity. Low housing investment will likely continue to have a dampening impact on activity in 2025. Activity in the mainland economy is expected to be higher in 2025 than projected in September, supported by among other things a more expansionary fiscal policy, an increase in household spending and higher petroleum investment than previously assumed.
Inflation has continued to fall
Inflation has continued to slow since the September Report. The 12-month rise in the consumer price index (CPI) slowed to 2.4% in November, while CPI inflation adjusted for tax changes and excluding energy products (CPI-ATE) increased to 3.0% in November, in line with that projected. The average of other underlying inflation indicators has also increased to about 3%.
Wage growth has increased in recent years, reflecting high price inflation, a tight labour market and strong profitability in some business sectors. Wage growth is projected to reach 5.2% in 2024. Wage growth is projected to slow to 4.2% in 2025, which is slightly below the September projection. The projection is a little higher than the wage expectations of the social partners, as measured in Norges Bank’s Expectations Survey and somewhat lower than Regional Network wage expectations.
High labour cost growth will likely continue to contribute to keeping domestic goods and services inflation elevated in 2025. Imported goods inflation has slowed markedly this year and is expected to remain low into next year. Overall underlying inflation is projected to show little change in the coming quarters.
Norges Bank’s Expectations Survey indicates little change in long-term inflation expectations in Q4, remaining somewhat above the 2% inflation target.
CPI and CPI-ATE. Twelve-month change. Percent

Policy rate unchanged at 4.5%
The operational target of monetary policy is annual consumer price inflation of close to 2% over time. Inflation targeting shall be forward-looking and flexible so that it can contribute to high and stable output and employment and to countering the build-up of financial imbalances.
In recent years, the policy rate has been raised significantly to tackle high inflation. Since December 2023, the policy rate has been held at 4.5%. The interest rate has contributed to cooling down the Norwegian economy and to dampening inflation. Unemployment has edged up from a low level. Inflation has fallen markedly from the peak, but the rapid rise in business costs is expected to restrain further disinflation.
The Committee judges that a restrictive monetary policy is still needed to stabilise inflation around target, but that the time to begin easing monetary policy is soon approaching. In its discussion, the Committee noted that activity in the Norwegian economy appears to be holding up better than previously projected. On the other hand, inflation has moved closer to target, and inflation pressures appear to have been slightly more subdued than previously assumed. The Committee does not want to restrict economic activity more than needed to bring inflation down to target within a reasonable time horizon.
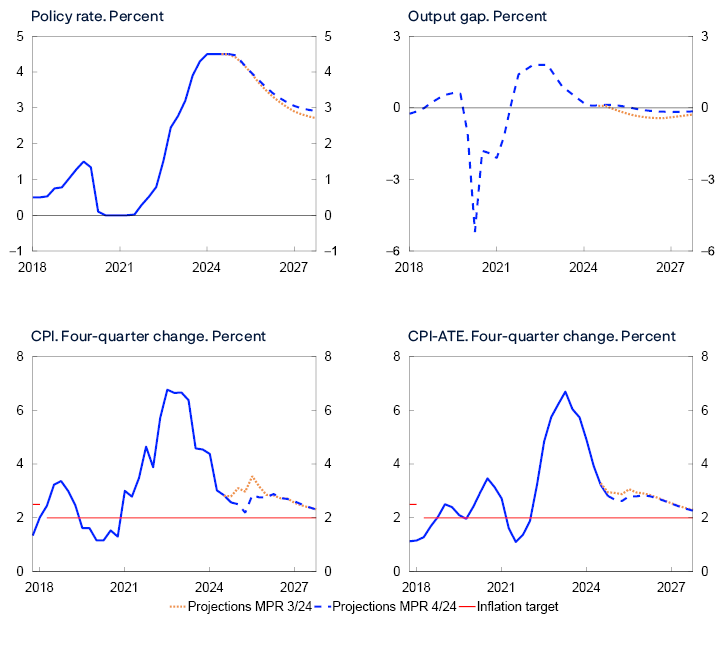
The forecast in this Report implies a gradual reduction in the policy rate from 2025 Q1. The forecast is little changed relative to the September forecast but indicates a somewhat smaller rate reduction in the coming years. Unemployment will likely increase a little, albeit slightly less than projected in September. Inflation is projected to be slightly above 2% at the end of 2027.
There is substantial uncertainty about the outlook for both the global and Norwegian economy. The Committee was concerned with the risk of an increase in international trade barriers. Higher tariffs will likely dampen global growth, but the implications for price prospects in Norway are uncertain. The Committee also noted that inflation has slowed faster than projected over the past year. If prospects suggest that inflation will be lower or unemployment higher than currently projected, the policy rate may be lowered faster than currently envisaged. On the other hand, wage and price inflation could remain elevated for longer than projected, for example should the krone weaken or capacity utilisation increase. A higher policy rate than currently envisaged may then be required.
The Committee unanimously decided to keep the policy rate unchanged at 4.5%. Based on the Committee’s current assessment of the outlook, the policy rate will most likely be reduced in March 2025.
- 1 Period: January 2018 – November 2024.
- 2 Period: 1 January 2020 – 17 December 2024. A higher I-44 index indicates a weaker krone exchange rate. The scales are inverted.
- 3 Period: January 2022 – September 2024.
- 4 Period: January 2018 – November 2024. CPI-ATE: CPI adjusted for tax changes and excluding energy products.
- 5 Period: 2018 Q1 – 2027 Q4. Projections from 2024 Q3 for MPR 3/24 and 2024 Q4 for MPR 4/24 for the policy rate, the CPI and the CPI-ATE. The output gap measures the percentage deviation between mainland GDP and estimated potential mainland GDP. CPI-ATE: the CPI adjusted for tax changes and excluding energy products.
Ida Wolden Bache
Pål Longva
Øystein Børsum
Ingvild Almås
Steinar Holden
18 December 2024
1. The global economy
Consumer price inflation among Norway’s main trading partners has declined markedly since the peak in 2022 and has been approaching inflation targets. Core inflation is higher but projected to decline further in the coming months. Compared with September, the market expects fewer rate cuts by the US Federal Reserve, while the European Central Bank (ECB) is expected to lower its policy rate a little faster.
Global growth is expected to pick up
Growth among trading partners has remained steady in 2024 owing to higher real wages and lower policy rates. Trading partner GDP growth increased slightly from Q2 to Q3 and was a little higher overall than projected in the September Report.
Unemployment has remained low in the euro area but has edged up in the US since the beginning of 2024. Overall output among Norway’s main trading partners is likely a bit below potential.
There is uncertainty related to developments in the conditions for international trade. International trade tariffs will likely increase but their scale and timing are unknown. Expectations of protectionist measures per se may lead to lower investment and impact sectors and countries not directly subjected to higher tariffs. The projections in this Report are consistent with the introduction of new protectionist measures that hold back growth in international trade in the coming years.
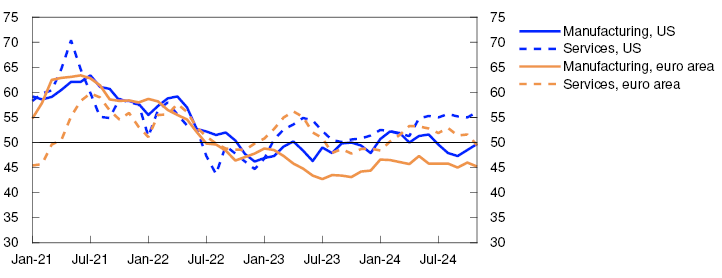
In Europe, activity has picked up slightly since 2023, but growth remains low. Activity indicators for the service sector have fallen and remain low for manufacturing (Chart 1.1). Developments are particularly weak in the manufacturing sector in Germany and France. Trade policy uncertainty, fiscal tightening in the euro area and higher energy prices are likely to dampen growth in Europe ahead. However, increase in real wages and lower interest rates will lift activity. Higher defence spending and energy investment are also likely to boost GDP growth in the years ahead. In the UK, expansionary fiscal policy will push up growth in 2025. Overall economic growth among Norway’s European trading partners is expected to pick up in the coming years.
PMI. Manufacturing and services
In China, higher expected tariffs on Chinese goods may push up exports in the very near term but higher tariffs will likely pull down activity ahead. Weak property market developments will likely dampen economic activity in the quarters ahead. Chinese authorities have already announced specific measures to prop up GDP growth and additional economic stimulus packages will likely be introduced further ahead. However, a shrinking labour force and high debt among local authorities and state-owned firms will likely lead to lower growth ahead.
Higher equity indexes and increased house prices have supported growth in US household wealth, which together with solid income growth, have underpinned brisk consumption and economic growth. A more expansionary fiscal policy and lower policy rates may lift growth ahead, while higher tariffs may stifle growth somewhat. In addition, lower immigration may weaken labour supply growth and contribute to dampening GDP growth. Overall, US economic growth is expected to decline ahead.
Trading partner GDP growth is projected to pick up from 2024 to 2025 before stabilising at just under 2% annual growth to the end of the projection period (Annex Table 1). On balance, projections are little changed compared with the September Report. Overall capacity utilisation among trading partners will likely remain a little below a normal level over the coming years.
The overall growth projection for trading partners in 2025 is in line with the latest projections from Consensus Forecasts but a little lower than the OECD’s Economic Outlook projection from December.
Core inflation is expected to decline further
Although consumer price inflation among Norway’s main trading partners has fallen significantly since the peak, disinflation among many trading partners appears to have slowed in recent months. Underlying consumer price inflation remains somewhat higher than overall consumer price inflation (Chart 1.2).
Consumer prices. Twelve-month change. Percent
Services inflation remains around 4% in both the US and Europe (Chart 1.3), likely reflecting tight labour markets and elevated wage growth in several countries, as well as rent inflation in the US. Goods inflation is very low in Europe and negative in the US.
Consumer prices. Services and goods excluding food and energy. Twelve-month change. Percent

In the US, short-term market inflation expectations are higher than in September. Long-term market expectations are close to inflation targets in both the euro area and the US. The decline in wage growth among trading partners is likely to continue in 2025. Core inflation among Norway’s four main trading partners as a whole is projected to edge down from 3% in 2024 to a little over 2% in 2027. The projections for inflation in 2025 and 2026 are slightly higher than in the September Report.
Higher policy rate expectations in the US
Central banks in the US, the euro area, UK and Sweden have cut their respective policy rates since the September Report. In the US, the UK and Sweden, central banks are expected to cut policy rates somewhat further, but market participants expect fewer cuts than they did in September (Chart 1.4). US policy rate expectations reflect prospects for higher economic growth than previously expected and for consumer price inflation to fall to target somewhat further out. In the euro area, policy rate expectations have declined slightly compared with the September Report. Overall, policy rate expectations among trading partners are higher than at the time of the September Report.
Policy rates and estimated forward rates. Percent
Since September, long-term interest rates have risen in the US and the UK but are little changed in the euro area. In equity markets, US equity indexes have risen in particular, while European equity indexes are little changed since the September Report. Global credit premiums are broadly unchanged.
Higher risk of increased trade barriers
There is uncertainty related to developments in the conditions for international trade ahead. This adds to uncertainty regarding developments in economic activity and inflation. The risk of more extensive trade barriers has increased following the November US election. Higher tariffs will likely soften growth for both export and import countries. The effects may propagate through value chains and thereby impact sectors and countries not directly subjected to higher tariffs. Expectations of protectionist measures per se may lead to lower investment, and lower growth in international trade can lead to a fall in global growth in the longer term, reflecting weaker competition and slower international technology transmission. In addition, uncertainty related to the timing and scope of tariff increases may lead to financial market volatility. Higher tariffs on goods will likely also push up consumer price inflation in countries that introduce import tariffs. The climate and energy transition and ongoing wars in a number of countries also add to uncertainty concerning developments in the global economy ahead.
Higher gas and electricity prices
Electricity prices in Norway have risen since the September Report. Prices have risen the most in South Norway, primarily as a result of higher electricity prices on the Continent. Oil prices are little changed. The rise in Norges Bank’s price indexes for imported intermediate and consumer goods remains muted.
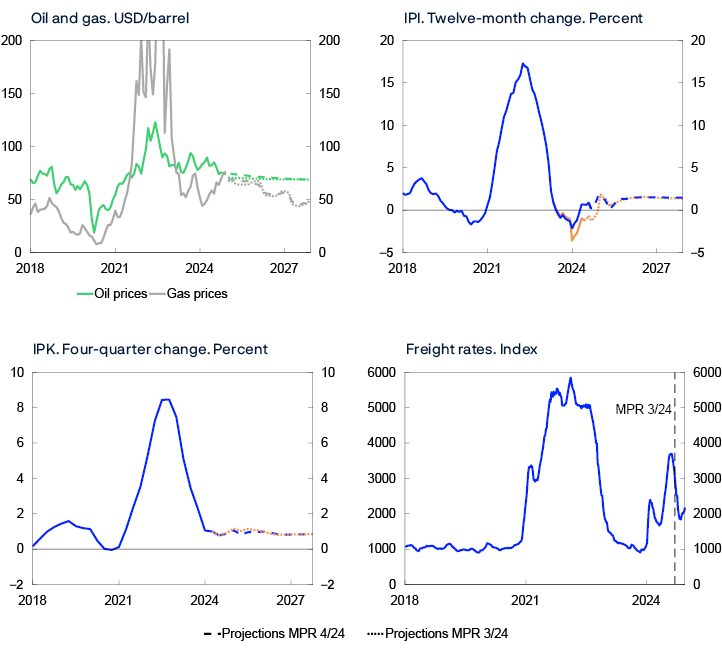
Oil prices have shown little change since September and are around USD 75 per barrel. At the beginning of December, OPEC+ extended the production cuts that have underpinned oil prices in recent years. This extension may reflect lower growth in global oil consumption, particularly in China, and prospects for higher growth in non-OPEC oil production in 2025. Futures prices indicate that oil prices ahead will be somewhat below the average for 2024 so far (Table 1.A). Oil prices may fall further if OPEC+ increases production more than assumed owing to ample spare production capacity and a low market share. In addition, expectations of protectionist measures may lead to lower global growth and lower oil consumption. On the other hand, an escalated regional conflict in the Middle East may result in a rise in oil prices.
Table 1.A Commodity prices
|
Percentage change from projections |
Average price (2010–2019) |
Realised prices and futures prices1 |
|||||
|---|---|---|---|---|---|---|---|
|
2022 |
2023 |
2024 |
2025 |
2026 |
2027 |
||
|
Oil, USD/barrel |
80 |
101 |
83 |
81 (1) |
73 (4) |
71 (2) |
69 (0) |
|
Dutch gas, EUR/MWh |
20 |
124 |
41 |
34 (5) |
40 (9) |
34 (5) |
29 (6) |
|
Coal, EUR/tonne |
66 |
290 |
118 |
104 (2) |
106 (1) |
110 (3) |
111 (4) |
|
Carbon allowance prices, EUR/tonne |
10 |
81 |
84 |
65 (0) |
66 (-1) |
68 (-1) |
70 (-1) |
|
German electricity, EUR/MWh |
42 |
256 |
102 |
90 (13) |
89 (3) |
83 (2) |
77 (3) |
|
Nordic electricity, øre/kWh |
32 |
142 |
66 |
45 (3) |
39 (-15) |
42 (-13) |
45 (-10) |
|
Electricity in South Norway, øre/kWh |
31 |
206 |
84 |
59 (11) |
53 (-7) |
54 (-8) |
57 (-7) |
|
Electricity in Northern Norway and Central Norway, øre/kWh |
32 |
38 |
43 |
33 (-3) |
26 (-18) |
32 (-10) |
37 (-4) |
|
Aluminium, USD/tonne |
1945 |
2706 |
2255 |
2424 (2) |
2612 (3) |
2638 (1) |
2650 (-1) |
|
Copper, USD/tonne |
6761 |
8829 |
8486 |
9150 (0) |
9148 (-3) |
9358 (-2) |
9460 (-1) |
|
Steel, USD/tonne |
463 |
722 |
622 |
585 (0) |
597 (1) |
- |
- |
|
Wheat, USD/tonne |
210 |
202 |
331 |
212 (-1) |
210 (-9) |
225 (-7) |
225 (-7) |
|
Maize, USD/tonne |
183 |
143 |
271 |
168 (0) |
175 (0) |
178 (-2) |
181 (0) |
European gas prices have risen since the September Report and gas futures indicate higher prices in 2025 than in 2024. This partly reflects Russia cutting remaining gas exports via Ukraine and the fact that growth in the global liquid natural gas (LNG) supply is expected later than previously assumed. Furthermore, a cold start to winter has increased gas consumption in the power sector while the lack of wind has reduced wind power production. Even though gas inventories are at a high level, they have fallen faster than at the beginning of this winter compared with the same periods in previous years. For the years following 2025, futures prices indicate lower prices, reflecting an increased supply of LNG.
The rise in gas prices and low wind power production have driven up German electricity prices since September (Chart 1.A). Futures prices have also risen and indicate that German electricity prices in 2025 will be broadly at the same level as in 2024. For subsequent years, futures prices indicate a decline.
Øre/kWh
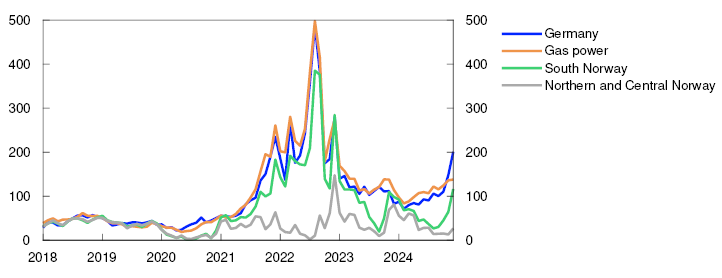
In Norway, electricity prices have risen from a low level in September, mostly in South Norway. The rise in prices in South Norway is due to higher prices on the Continent and in the UK. In addition, electricity prices normally rise at the onset of winter. Nevertheless, prices in Norway remain lower than in Germany. Futures prices indicate that electricity prices in Norway will be somewhat lower in 2025 than in 2024. Lower expected electricity prices in Norway than on the Continent reflect relatively high reservoir levels and Norway’s continued electricity surplus.
The rise in the index of international price impulses to imported intermediate goods (IPI) is low and has moved down from a high level.3 Like the IPI, the growth in the index of international price impulses to imported consumer goods (IPK) has been stable in recent months, close to pre-pandemic levels. The forecast indicates that growth ahead will be around current levels.
In recent years, there has been considerable volatility in freight rates owing to a number of disruptions in shipping. Since the September Report, freight rates have declined from high levels but have increased slightly in recent weeks (Chart 1.B). A number of market participants have pointed to higher expected tariffs as a driving force, and therein an increased desire to frontload deliveries. Freight rates are assumed to normalise and eventually decline to pre-pandemic levels.
- 1 Futures prices at 13 December 2024.
Sources: LSEG Datastream and Norges Bank
- 2 Period: January 2018 – December 2024. Gas power is a weighted average of gas prices and emission allowance prices.
- 3 Higher growth in 2024 mainly reflects a technical revision of the index, with more producer prices included in the calculation. For a more detailed description of the index, see Brubakk, L., K. A. Matsen, K. Mjølnerød, Ø. Robstad and E. Werenskiold (2024) “Charting the upstream: An indicator for imported input goods prices”. Staff Memo 5/2024. Norges Bank.
- 4 Period: January 2018 – December 2027. For oil and gas prices, projections for MPR 4/24 and MPR 3/24 are futures prices. International price impulses to imported intermediate goods (IPI). International price impulses to imported consumer goods (IPK). All series are measured in international currency terms.
- 1 Period: January 2021 – November 2024. Survey of purchasing managers. Diffusion index centred around 50.
- 2 Period: January 2019 – November 2024. Core CPI is consumer prices excluding energy and food in the US and consumer prices excluding energy, food, tobacco and alcohol in the euro area.
- 3 Period: January 2019 – November 2024. Consumer prices for services excludes owner-occupiers’ estimated housing costs.
- 4 Period: 1 January 2017 – 31 December 2027. Daily figures through 13 December 2024. Quarterly figures from 2024 Q4 for MPR 3/24 and 2025 Q1 for MPR 4/24. Estimated forward rates at 13 September for MPR 3/24 and at 13 December for MPR 4/24. For the euro area, the ECB’s deposit facility rate is shown.
2. Financial conditions
Higher interest rate expectations point to somewhat tighter financial conditions than at the time of the September 2024 Monetary Policy Report. The average residential mortgage rate is a little lower than projected. The krone exchange rate is approximately the same as in the September Report.
Market policy rate expectations have risen
Market policy rate expectations for the coming years rose following the publication of the September Report and have since risen further, which is also in line with higher US policy rate expectations. Norwegian inflation data from the beginning of December also resulted in higher rate expectations. Market pricing now indicates expectations of a rate cut in 2025 Q1 and further reductions thereafter to somewhat below 3.75% in the period to end-2025 (see Chart 4.2 on page 49). Market policy rate expectations are close to the policy rate path in this Report through 2025 and somewhat higher further out in the projection period.
Average residential mortgage rate slightly lower than projected
The average interest rate on outstanding floating and fixed-rate residential mortgages was 5.6% at end-October, slightly lower than projected in the September Report. Interest rates for new fixed-rate mortgages are appreciably lower than for floating-rate mortgages. Since the September Report, more households have chosen fixed rates, increasing the share of such loans somewhat. Even though the share is still low, it has contributed to pulling down the average residential mortgage rate slightly. The average floating interest rate has also been slightly lower than projected, which may indicate somewhat stronger lending market competition than previously assumed.
The average residential mortgage rate is projected to remain close to current levels in the near term, then to edge down when the policy rate is lowered (Chart 2.1). The projection for the residential mortgage rate through 2025 is slightly lower than in the September Report owing to signs of stronger competition. While new capital requirements that enter into force in 2025 will reduce funding costs for small and medium-sized banks, the effect will be the opposite for the largest banks. The effect on lending rates is uncertain but is assumed to be minimal overall.
Interest rates. Percent
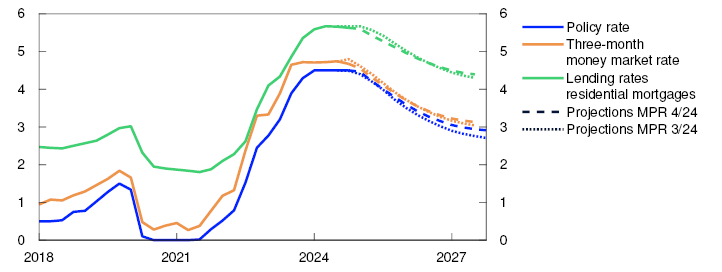
The average interest rate on household deposits was 3.1% at the end of October, unchanged from September Report. Deposit rates are projected to remain close to current levels in the coming period before gradually declining with a reduction in the policy rate.
Corporate lending rates are little changed
In October, the interest rate on new floating-rate corporate loans was 6.6%, measured as a weighted average of bank and bond debt. This was broadly unchanged from the September Report (Chart 2.2). Over the past year, bank lending rates have risen while bond yields have fallen somewhat.
Interest rate on new floating-rate NOK finance for non-financial corporates. Percent
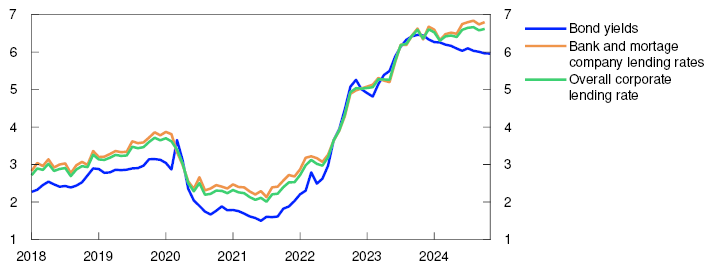
The interest rate on corporate bank loans is based on three-month Nibor, which has fallen slightly since the September Report. The Nibor risk premium has fallen and is lower than projected in September. In this Report, the projection for the Nibor-premium ahead is revised down to 0.2 percentage point (Chart 2.3), reflecting government plans for a NOK 82bn reversal from its account to the Government Pension Fund Global (GPFG) in 2025.3 The kroner in the government’s account will be sold in the foreign exchange market and contribute to higher structural liquidity in the banking system ahead. Projections for the Nibor-premium are close to the market’s pricing of forward premiums.
Money market premium. Percentage points

In October, the margin above Nibor paid by firms for new bank loans was broadly unchanged from the level in the September Report. Likewise, risk premiums in the corporate bond market have not changed significantly since September. Costs for fixed-rate long-term corporate loans have risen somewhat on the back of higher long-term swap rates since September. Issuance activity among mainland non-financial corporates remains high.
The equity market is also a source of corporate financing. Since the September Report, the Oslo Børs Benchmark Index has advanced by around 3%, with seafood, financial, technology and materials sectors making the largest contributions. Developments have been weakest in real estate, where equity prices have declined somewhat since September.
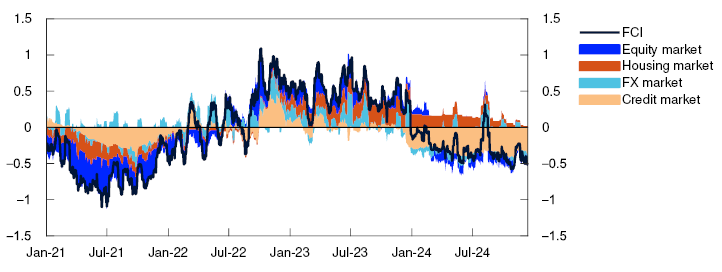
Amid higher market policy rate expectations than in September, financial conditions have tightened somewhat since the previous Report. Norges Bank’s Financial Conditions Index (FCI) summarises other financial conditions that affect households, banks and non-financial firms. Overall, this index is little changed since September (Chart 2.4).
Financial Conditions Index (FCI). Standard deviation from mean
Krone exchange rate broadly as expected
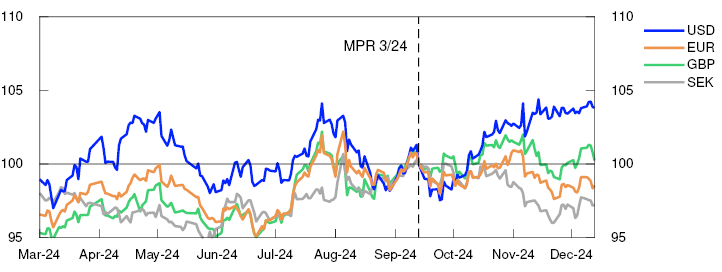
The import-weighted exchange rate is little changed since the September Report. So far in 2024 Q4, the krone exchange rate has, on average, been broadly as expected. The interest rate differential against an average of Norway’s main trading partners has risen by just under 0.5 percentage point since September. Oil prices are little changed, while global equity prices have risen. Krone developments against different trading partner currencies have been mixed (Chart 2.5). The krone has depreciated against the US dollar and pound sterling and strengthened against the euro and the Swedish krona.
Index. 13 September 2024 = 100
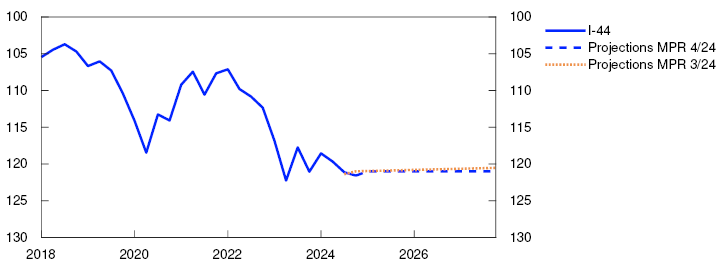
The krone is expected to show little change upon publication of this Report, given that the forecast of the policy rate path is broadly similar to the market-implied path. The krone exchange rate is expected to remain approximately unchanged thereafter throughout the projection period (Chart 2.6), implying a krone exchange rate close to the September projection.
Import-weighted exchange rate index. I-44
- 1 Period: 2018 Q1 – 2027 Q4. Projections from 2024 Q3 for MPR 3/24 and from 2024 Q4 for MPR 4/24. The residential mortgage rate is the average rate on outstanding mortgage loans to households from the sample of banks and mortgage companies included in Statistics Norway’s monthly interest rate statistics.
- 2 Period: January 2018 – November 2024.
- 3 In 2022, a reversal of NOK 70bn was carried out. The consequences of this reversal were discussed in detail in the box on page 21 of Monetary Policy Report 4/2021.
- 4 Period: 1 January 2017 – 31 December 2027. Five-day moving average. Latest observation on 13 December 2024. Projections from 2024 Q3 for MPR 3/24 and 2024 Q4 for MPR 4/24. The premium in the Norwegian money market rate is the difference between the three-month money market rate and the expected policy rate.
- 5 Period: 1 January 2021 – 13 December 2024. The Financial Conditions Index (FCI) provides an overall picture of the price and availability of different types of financing beyond that indicated by the policy rate and future policy rate expectations. The FCI provides an indication of how tight or loose financial conditions are, compared with the average from 3 January 2003 – 13 December 2024. A higher index value indicates tighter financial conditions. For more on the Norwegian FCI, see Monetary Policy Report 4/2022 and Bowe, F., K. R. Gerdrup, N. Maffei-Faccioli and H. Olsen (2023): “A high-frequency financial conditions index for Norway”, Norges Bank Staff Memo 1/2023.
- 6 Period: 1 March 2024 – 13 December 2024. For all currencies in the chart, the exchange rate is against NOK. 13 September 2024 = 100. An increase in the series means that NOK has depreciated against the foreign currency.
- 7 Period: 2018 Q1 – 2027 Q4. Projections from 2024 Q3 for MPR 3/24 and 2024 Q4 for MPR 4/24. A higher index value for I-44 denotes a weaker krone exchange rate. Scales are inverted.
3. The Norwegian economy
Inflation has declined markedly since end-2022. Output appears to be around potential. The employment-to-population ratio has declined gradually from a high level, and unemployment has changed little in recent months.
Capacity utilisation is projected to remain around the current level in the period to summer, declining slightly thereafter. Unemployment is projected to rise slightly. Strong labour cost growth will likely restrain further disinflation. Inflation is projected at just over 2% towards end-2027.
3.1 Output and demand
Higher activity in the Norwegian economy
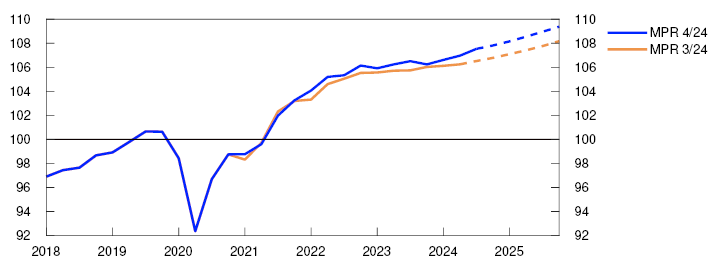
After a rapid post-pandemic recovery, growth in the Norwegian economy slowed through 2023. In 2023 Q4, mainland GDP was at about the same level as in 2022 Q4. Activity has picked up again in 2024. Mainland GDP rose somewhat more from Q2 to Q3 than projected in September, and updated national accounts data also show somewhat higher growth through the first half of 2024 (Chart 3.1). Both household consumption and public sector demand have been higher than previous data indicated, while housing and business investment have been lower. According to Statistics Norway, the data revisions to the national accounts are slightly more extensive than normal.
GDP for mainland Norway. Constant prices. Index. 2019 = 100
Norges Bank’s Regional Network contacts report that growth appears to have remained steady so far in Q4 and may accelerate somewhat into 2025. Oil service contacts report continued high growth, and there are prospects of continued high growth into 2025. Service contacts report a sharp rise in corporate demand, particularly related to cloud solutions, information security and artificial intelligence. Construction output has been falling since the beginning of 2023, but the pace of decline appears to be softening somewhat.
The upturn in the Norwegian economy is projected to continue through 2023 Q4 and 2025 Q1, but growth is expected to be somewhat lower than in Q3. The projections are in line with Regional Network expectations and the SMART forecasts (see box on page 27 on Norges Bank’s system for model analysis in real time).
After declining in 2023, private consumption is likely to rise in 2024, driven by increased household income (Chart 3.2). Growth in public demand has been high, petroleum investment has risen sharply, and the past krone depreciation has pushed up exports. At the same time, the rise in interest rates and high costs have squeezed housing and business investment.
GDP for mainland Norway. Annual change. Contribution to annual change. Percentage points
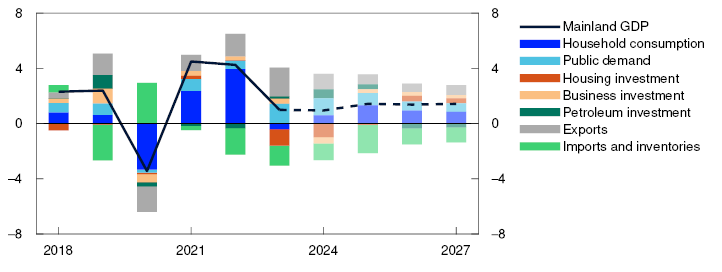
In the projections, mainland economic growth increases from 0.9% in 2024 to 1.4% in 2025, where it remains in 2026 and 2027. The projections for 2024 and 2025 have been revised up since the September Report, while projections further ahead are little changed. Consumption growth is projected to accelerate in 2025 and both housing and business investment to rise through 2025, with prospects for lower interest rates supporting the upswing. Growth in public demand is projected to continue but at a slower pace than in recent years. Petroleum investment is also projected to expand next year, but to edge down thereafter.
Increase in household purchasing power
In 2023, higher interest rates and high inflation led to a 1.5% fall in household real disposable income excluding dividend income (Chart 3.3). This is the largest annual decline since the start of the data series in 1978. However, households limited the decline in consumption by reducing saving. Many are likely to have drawn on savings accumulated during the pandemic.
Real disposable income and private consumption. Annual change. Percent
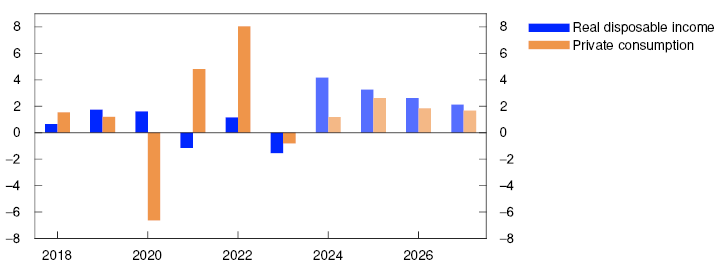
There are prospects for real disposable income growth of just over 4% in 2024. After a fall in real wages in both 2022 and 2023, wages are now rising markedly faster than prices, and even though employment growth has slowed, it has remained positive. Consumption appears to be increasing less than income. This means that household saving is picking up again. However, the saving ratio remains lower than the average for the 2010s.
Consumption rose more than projected from 2024 Q2 to Q3. At the same time, updated national accounts data show that consumption has been higher than assumed since 2022.
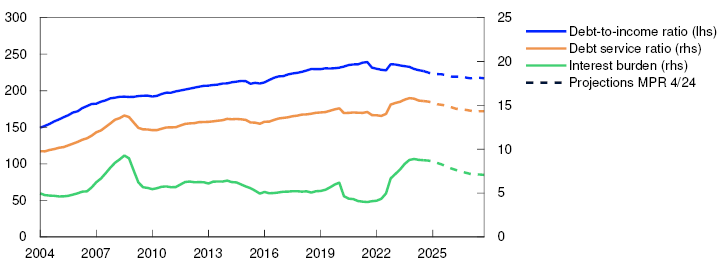
Overall consumption is projected to pick up further ahead, with a lower policy rate expected to boost consumption. High household debt largely consisting of floating-rate loans means that interest expenses will decline somewhat when the policy rate is reduced (Chart 3.4). Together with prospects for continued real wage growth, this supports a further rise in real disposable income. Consumption is expected to grow somewhat less, which will result in a somewhat higher saving ratio that is also slightly higher than projected in September.
Percent
Improved purchasing power and lower interest rates are also projected to lift housing investment. There are signs of an increase in housing market activity. Sales in the secondary housing market are high and have risen somewhat recently and new home sales have edged up from a very low level (Chart 3.5). The rise in prices in the secondary housing market has accelerated and remained slightly higher than projected in the September Report. Changes to the lending regulations may also lead to a somewhat faster rise in prices. Following several years of house price decline in real terms, there are now prospects for house prices to rise somewhat faster than consumer prices ahead and somewhat more than projected in the September Report.
Chart 3.5 Decline in housing investment5
Housing investment. Constant 2022 prices. In billions of NOK.
Primary and secondary housing market sales. Total past 12 months. Index. 2019 = 100
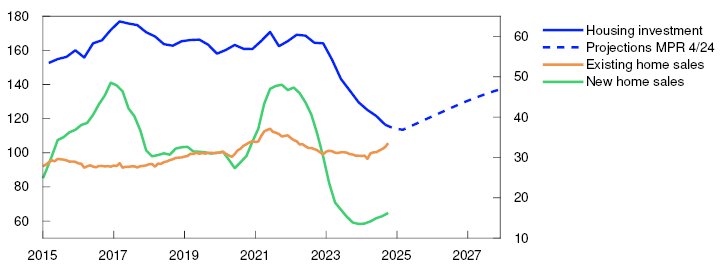
However, it appears that it is taking time for residential construction to increase. Housing investment declined more than projected from 2024 Q2 to Q3, and updated national accounts data also show weaker developments in previous quarters. Housing investment has now fallen by more than a third since 2022, the largest decline in more than 30 years. Construction contacts in the Regional Network expect output to continue to decline in 2025 Q1. Housing investment is projected to grow through the rest of 2025, but to remain lower than projected in September throughout the projection period.
Increase in exports and petroleum investment
Mainland exports have expanded rapidly in recent years, partly due to post-pandemic normalisation. The krone depreciation has also been a contributing factor. The rise in exports from firms that supply oil and renewable energy firms has been particularly pronounced over the last couple of years (Chart 3.6). Global offshore oil investment has been high, and there has been strong growth in demand relating to offshore wind projects. The increase is projected to continue ahead, but with somewhat weaker growth than in recent years. Growth in other mainland exports is also projected to slow. Demand is rising among Norway’s trading partners, but the positive impulses from the past krone depreciation will gradually weaken. After markedly stronger growth in mainland exports than imports in 2023 and 2024, growth in net exports is expected to weaken ahead.
Selected demand components. Constant 2022 prices. In billions of NOK
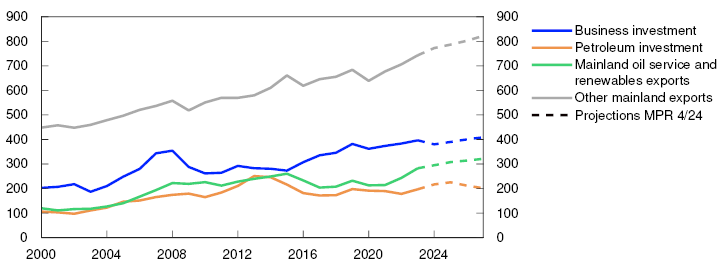
Petroleum sector investment increased markedly in 2023 and is set to increase by about as much again in 2024, reflecting the launch of a number of development projects in 2022 in response to the petroleum tax package and high petroleum prices. There are prospects for investment to rise somewhat further in 2025 and more than projected in the September Report. The upward revision primarily reflects the most recent investment intentions survey from Statistics Norway, which indicates stronger-than-anticipated growth. Investment is projected to decline from 2026. The ongoing development projects will be completed and there are prospects that new development projects will be smaller in scale.
Following an increase in recent years, mainland business investment will likely decline in 2024. Higher interest rates and high costs have dampened investment. At the same time, updated national accounts data show that investment since 2022 has been clearly lower than previous data indicated. Business investment is now somewhat lower than in 2019, the final year before the pandemic, but is projected to pick up in the coming years (Chart 3.6). In addition to lower interest rates further out, increased digitalisation and projects associated with the climate and energy transition contribute to higher investment (see box on power sector investment on page 45).
Strong growth in public demand
Public demand has increased substantially in recent years and updated national accounts data show higher growth than previously. Growth in 2023 was at its strongest since 2009 and is set to be almost as high in 2024. Higher defence spending has contributed to the increase, but most of the growth is attributable to higher general government demand (Chart 3.7).
Constant 2022 prices. Change from 2019 Q4 and contribution to change. Percent
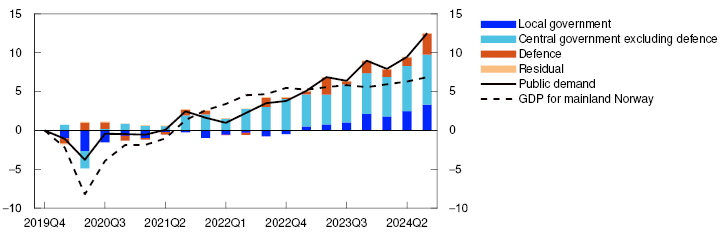
Growth in public demand is assumed to slow in 2025, in line with the projections in the National Budget and the budget compromise in the Storting (Norwegian parliament). The structural non-oil budget deficit is projected to increase from 10.7% of trend GDP for mainland Norway in 2024 to 11.7% in 2025. The deficit in 2025 is 1.0 percentage point higher than assumed in the previous Report. The projections imply that petroleum revenue spending will amount to 2.5% of the Government Pension Fund Global (GPFG) ahead and be lower than the expected real return on the GPFG.
The projections are uncertain
The projections for the Norwegian economy are uncertain. There are wide variations in developments across sectors, and high inflation and sizeable shocks in recent years make it more demanding to interpret developments. While previous national accounts data indicated weak growth in the Norwegian economy, updated data show more normal growth rates.
There is, among other things, uncertainty surrounding housing market developments ahead. Housing investment has fallen more than projected in recent years. Investment is assumed to increase through 2025, but a number of Regional Network contacts report longer decision-making processes and project postponements and cancellations. Greater difficulty attracting foreign labour may also restrain the increase. However, substantial declines in housing investment have previously been followed by relatively rapid upswings. It can therefore not be ruled out that residential construction will eventually pick up faster than currently projected. Stronger purchasing power and lower interest rates may also contribute to higher-than-assumed house price inflation.
Following the US election this autumn, the risk of international trade conflicts has risen. Should many countries erect substantial trade barriers, Norwegian exports may prove weaker than currently assumed, partly because growth among Norway’s trading partners will slow, but also because Norwegian firms could then face increased tariffs or other trade barriers. At the same time, the risk of trade conflicts per se may also dampen investment in Norway. Major trade policy changes may have a substantial impact on financial markets, and may also dampen growth ahead.
SMART – System for Model Analysis in Real Time
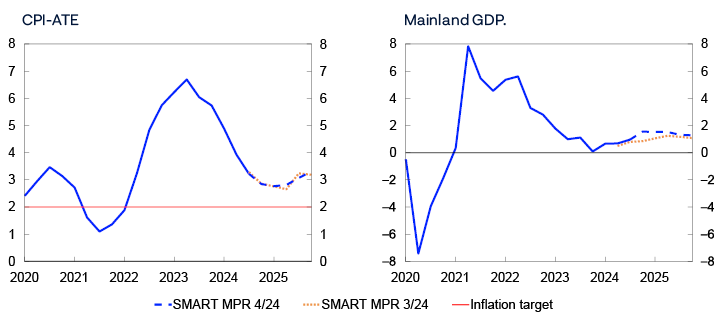
The System for Model Analysis in Real Time (SMART) is Norges Bank’s platform for forecasting models.1 In SMART, forecasts from a broad set of different models are weighted based on their historical forecasting properties. Since the September Report, the SMART forecasts for mainland GDP have been revised up while the model forecasts for CPI-ATE are little changed.
Models are useful tools for assessing the outlook for the Norwegian economy but will not capture all factors that have a bearing on developments. The Bank’s projections and model forecasts may therefore differ.
The SMART system now indicates broadly the same inflation as in the September Report (Chart 3.A, left panel). The modelling system forecasts a four-quarter change in the CPI-ATE of 2.8% both in 2024 Q4 and in 2025 Q1. The SMART forecasts indicate somewhat higher inflation through 2025.
The SMART mainland GDP forecasts have been revised up since the September Report (Chart 3.A, right panel). The modelling system forecasts four-quarter growth of 1.5% both in 2024 Q4 and 2025 Q1, but somewhat slower growth through the rest of the year. The upward revision partly reflects higher growth in Q3 than in the SMART forecast.
Four-quarter change. Percent
- 1 Bowe, F., I.N. Friis, A. Loneland, E. Njølstad, S.S. Meyer, K.S. Paulsen and Ø. Robstad (2023) “A SMARTer way to forecast”. Staff Memo 7/2023. Norges Bank.
- 2 Period: 2020 Q1 – 2025 Q4. CPI-ATE: CPI adjusted for tax changes and excluding energy products. Projections from 2024 Q3 for MPR 3/24 and from 2024 Q4 for MPR 4/24. The SMART modelling system for short-term projections is based on historical relationships. It combines empirical models based on previous forecasting properties.
- 1 Period: 2018 Q1 – 2025 Q4. Projections from 2024 Q3 for MPR 3/24 and from 2024 Q4 for MPR 4/24.
- 2 Period: 2018–2027. Projections from 2024. Petroleum investment data include investment in international shipping. Public demand = public consumption + public investment.
- 3 Period: 2018–2027. Projections from 2024. In the forecasts for disposable real income, projections for the CPI are used as the deflator.
- 4 Period: 2004 Q1 – 2027 Q4. Projections from 2024 Q4 for MPR 4/24. Debt-to-income ratio is debt as a share of disposable income. Disposable income is after-tax income less interest expenses. Debt service ratio is interest expenses and estimated principal payments on loan debt as a percentage of after-tax income. Interest burden is interest payments as a percentage of after-tax income.
- 5 Period: 2015 – October 2024. Housing investment to 2027. Projections from 2024 Q4 for MPR 4/24. The frequency of primary housing market data is converted from bi-monthly to monthly by extrapolating the data while also retaining the series trend (Denton-Cholette).
- 6 Period: 2000–2027. Projections from 2024.
- 7 Period: 2019 Q4 – 2024 Q3.
3.2 Labour market
Moderate employment growth
The employment-to-population ratio has fallen gradually from a high level over the past two years (Chart 3.8). Registered unemployment has increased somewhat from a low level but is still slightly lower than before the pandemic. Employment rose slightly in 2024 Q3, in line with projections in the September Report.
Employment to population ratio. Aged 15–74. Percent

Employment growth has continued over the past year, but there are wide differencesacross sectors. Overall, employment growth in the private sector dampened mainland growth somewhat. Construction in particular is pulling down growth. The public sector has helped sustain overall employment growth over the past year, partly due to strong growth in the health and social services sector.
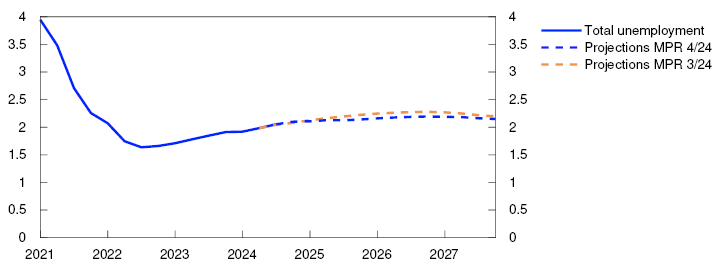
Unemployment, as measured by the Norwegian Labour and Welfare Administration (Nav), has been stable in recent months. In November, registered unemployment adjusted for seasonal variations was 2.1%, in line with the September projection (Chart 3.9). Unemployment, as measured by the Labour Force Survey (LFS), has risen more than registered unemployment in the past two years, but has changed little recently. LFS unemployment has remained at 4.0% since March, close to the pre-pandemic level.
Registered unemployed as share of the labour force. Seasonally adjusted. Percent
Stable development in job vacancies
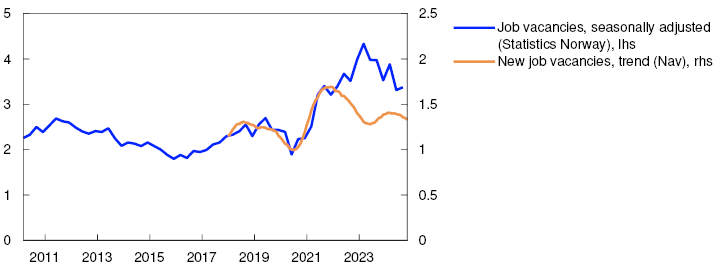
The stock of vacancies in Statistics Norway’s sample survey remains at a high level but has fallen in 2024 (Chart 3.10). Nav’s statistics indicate that even though the inflow of new vacancies has declined somewhat, it remains somewhat higher than before the pandemic. Overall, the number of vacancies indicate solid labour demand.
Number of job vacancies as a share of the labour force. Percent
Refugees boost labour supply
The total labour supply has increased in 2024, both as a result of higher employment and higher unemployment than in 2023. This partly reflects the large inflow of Ukrainian refugees, and the number of Ukrainian refugees in Norway is expected to continue to increase in 2025. Ukrainian refugees are also projected to contribute to increasing the labour supply ahead (see further discussion on page 30). It is assumed that growth for the rest of the population will be stable ahead, in line with Statistics Norway’s population projections.
The number of temporary foreign workers in Norway edged up in 2024 Q3 and thereby lifts the labour supply somewhat. The number is little changed compared with 2023. This is despite both a marked fall in construction employment and the krone depreciation’s negative impact on the value of wages in foreign currency terms over the past couple of years. Looking ahead, the number of temporary foreign workers is projected to pick up in pace with higher construction activity.
Employment is projected to rise somewhat in the near term. According to preliminary register-based data, the number of wage earners rose somewhat in October, and Regional Network contacts expect moderate employment growth in the period to the end of the year and the beginning of 2025. The public sector is expected to continue to lift overall employment growth somewhat in the near term.
In 2025, employment is projected to pick up slightly but somewhat less than mainland GDP growth, reflecting a projected pick-up in productivity growth. Further out, employment growth is expected to remain stable and close to growth in the working age population. The projections indicate that the employment-to-population ratio will remain relatively stable.
In the projections, employment increases slightly less than the labour force in the coming years, and unemployment increases a little. Unemployment is projected to reach 2.2% at the beginning of 2026, remaining close to this level thereafter. It is assumed that slightly more Ukrainian refugees will enter the Norwegian labour market, but that the main impact on overall unemployment is now behind us (see further discussion in the box below). The unemployment projections are slightly lower than in the September Report.
Capacity utilisation is levelling off
Capacity utilisation has declined over the past couple of years and is now close to a normal level. Capacity utilisation is expected to remain broadly at current levels in the period to summer 2025 before declining slightly and remaining close to a normal level through the projection period. The projections have been revised up slightly from 2025 compared with the September Report.
Capacity utilisation, or the output gap, is a measure of the intensity with which the economy makes use of its resources. The output gap is defined as the percentage difference between actual output and potential output in the mainland economy. Potential output is determined by productivity and the highest sustainable level of employment consistent with stable wage and price inflation, hereinafter referred to as N*. Norges Bank estimates the output gap based on an overall assessment of various indicators and models, where particular weight is given to labour market developments.
Capacity utilisation declined from a high level through 2023 (Chart 3.B). Growth in the Norwegian economy was weak, and unemployment rose somewhat. At the same time, a steadily declining share of Norges Bank’s Regional Network contacts reported capacity constraints and labour shortages.
The increase in unemployment has slowed in 2024, and unemployment is close to the level Norges Bank considers to be consistent with output at potential. At the same time, Norwegian economic growth has picked up slightly in the course of 2024 and the number of job vacancies remains at a high level. The share of firms reporting capacity constraints and labour shortages has also increased through 2024 and was close to its historical average in Q4. Overall, this indicates that output has levelled off at around potential.
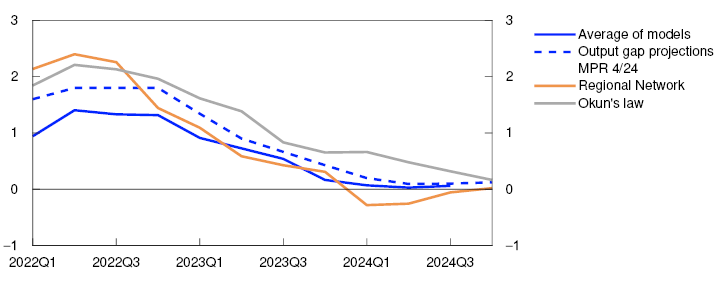
The average of the models in Norges Bank’s modelling system for the output gap also indicates that capacity utilisation declined markedly through 2023 but levelled off in 2024 (Chart 3.B).1 Approximately half of the models now indicate a negative gap, while the other half indicate a positive gap. However, the majority of the models show a relatively flat path through 2024. As a whole, the models also indicate that output is close to potential.
Percent
Revised national accounts data show that productivity has been higher in recent years than previously assumed. Potential output is therefore currently assessed to have been slightly higher than previously projected. Productivity growth has picked up in 2024 (Chart 3.C) but remains moderate.
Percent
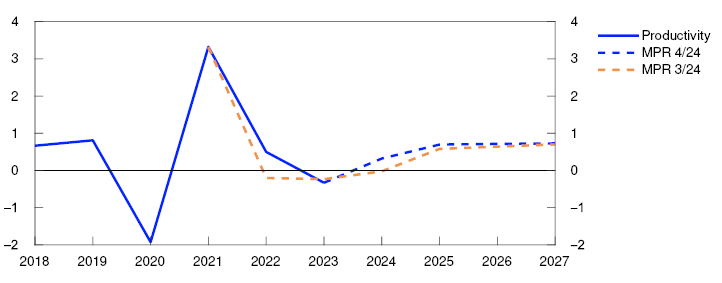
Productivity growth is projected to be slightly higher ahead than in recent years. The weakness in productivity growth over the past two years must be viewed in the context of the cyclical downturn in the Norwegian economy. In a cyclical downturn, it is normal for firms to reduce activity faster than their workforce, resulting in a temporary decline in productivity growth. This has likely contributed to lower actual productivity growth than underlying trend productivity (Table 3.A). It also appears that the share of Regional Network enterprises retaining more labour than normal is somewhat higher than the share with lower retention (Chart 3.D). This indicates that there is room for higher productivity growth as activity picks up ahead. Compared with the previous Report, projections are little changed in the longer term. This reflects the assessment that underlying productivity growth has not changed materially (see further discussion on page 41).
Is the share by which the workforce can be reduced while maintaining current output levels lower, equal to or higher than normal? Share of enterprises

Table 3.A Output and potential output5
|
Change from projections in Monetary Policy Report 3/2024 in brackets |
Percentage change from previous year |
|||||
|---|---|---|---|---|---|---|
|
2004–2013 |
2014–2023 |
2024 |
2025 |
2026 |
2027 |
|
|
GDP, mainland Norway |
3 |
1.8 |
0.9 (0.3) |
1.4 (0.3) |
1.4 (0.1) |
1.4 (-0.1) |
|
Potential output |
2.8 |
1.7 |
1.6 (0.3) |
1.5 (0.1) |
1.6 (0.1) |
1.5 (0.1) |
|
N* |
1.5 |
1 |
0.9 (0) |
1 (-0.1) |
0.9 (-0.1) |
0.8 (0) |
|
Trend productivity |
1.4 |
0.7 |
0.7 (0.3) |
0.5 (0.1) |
0.7 (0.1) |
0.7 (0.1) |
The assessment of potential output has been revised up slightly since September, reflecting somewhat higher productivity. N* is slightly lower than in the September Report. The inflow of Ukrainian refugees is projected to continue to increase in 2025, but slightly less than in the September Report, in line with official projections. Historical experience shows that it takes some time for refugees to find employment. It is assumed that they will gradually lift N*, but that the increase will be slightly lower than envisaged in the September Report.
Growth in the Norwegian economy is projected to be close to growth in potential output in the coming quarters. Projected GDP growth is in line with Regional Network expectations and suggests that output will also remain close to potential in the coming quarters.
In 2025, output is expected to increase slightly less than potential output. Capacity utilisation is therefore likely to decline somewhat with a slight increase in unemployment. The output gap is projected to bottom out at -0.2% at the end of 2026. The projections have been revised up slightly from the September Report.
There is substantial uncertainty associated with the output gap projections ahead. If the output gap proves to be larger than currently projected, unemployment could turn out lower and wage growth higher than currently projected. On the other hand, productivity growth may increase more rapidly and more than currently envisaged. In that case, potential output will increase and may contribute to lower capacity utilisation and higher unemployment.
- 1 Norges Bank uses the average of the models documented in Hagelund, K., F. Hansen and Ø. Robstad (2018) “Model estimates of the output gap”. Staff Memo 4/2018. Norges Bank. Based on a new assessment, the model using real credit, which has long been markedly lower than the other models, has been excluded. The average, excluding the real credit models, performs better along the valuation outlined in the Staff memo than the average including the real credit model.
- 2 Period: 2022 Q1 – 2024 Q4. Regional Network is a direct estimate of the output gap based on the average of the capacity utilisation indicators in the Regional Network and the historical correlation with Norges Bank’s output gap projection where the Regional Network indicator leads by one quarter. Okun’s law is based on an estimated deviation from the trend in registered unemployment as a percentage of the labour force.
- 3 Period: 2018–2027. Projections from 2024 for MPR 3/24 and MPR 4/24. GDP per employee.
- 4 The questions were asked as part of a special feature in the Regional Network survey for 2024 Q4. Enterprises were first asked by how much they could reduce their workforce while maintaining current output levels.They were then asked whether this share was “lower”, “equal” or “higher” than normal. The shares do not necessarily sum exactly to 100. This discrepancy is due to participating Regional Network contacts that did not provide respones in the special feature.
- 5 The contributions from N* and trend productivity do not necessarily sum exactly to the annual change in potential output due to rounding.
- 1 Period: 2005 Q1 – 2027 Q4. Projections from 2024 Q4. N* is an estimate of the highest level of employment that can be maintained over time without driving up wage and price inflation.
- 2 Period: 2021 Q1 – 2027 Q4. Projections from 2024 Q3 for MPR 3/24 and from 2024 Q4 for MPR 4/24.
- 3 Period: Statistics Norway: 2010 Q1 – 2024 Q3. Nav: January 2018 – November 2024. Owing to a break in Nav’s statistics at the beginning of 2018, only data since January 2018 are included.
3.3 Prices and wages
Wage growth is high
Wage growth is high after having risen gradually in the years following the pandemic owing to high inflation, a tight labour market and strong profitability in some business sectors.
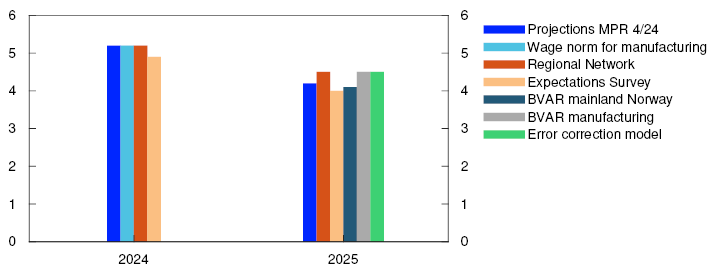
Wage growth is expected to reach 5.2% in 2024, unchanged from 2023 and in line with the wage norm. In Norges Bank’s Expectations and Regional Network surveys, wage growth is also expected to be close to the wage norm (Chart 3.11). Expectations are little changed compared to earlier in 2024, and there is little difference in contacts’ expectations across industries. Wage growth slightly higher than 5% is consistent with updated wage growth data.
Annual wage growth. Percent
Slower wage growth expected in 2025
High export prices and the krone depreciation in 2023 have contributed to sound profitability in some manufacturing segments in recent years. A strong ability to pay wages may also contribute to keeping wage growth elevated ahead. On the other hand, lower inflation and slightly lower capacity utilisation are expected to dampen wage growth.
Wage growth is expected to slow to 4.2% in 2025, slightly below the September projection. The projection is a little higher than the wage expectations of the social partners, as measured by Norges Bank’s Expectations Survey and somewhat lower than the Regional Network expectations. Norges Bank’s wage models indicate wage growth of slightly over 4% in 2025 (Chart 3.11). Compared with the September Report, lower consumer price inflation pulls down the wage projections, while higher capacity utilisation pulls in the opposite direction.
Inflation has slowed markedly
Inflation has slowed markedly since the end of 2022 (Chart 3.12). In November, the 12-month rise in the consumer price index (CPI) was 2.4%, which was somewhat lower than projected in the September Report. Underlying inflation, as measured by the CPI adjusted for tax changes and excluding energy products (CPI-ATE), rose to 3.0%, as projected in the September Report. The average of underlying inflation indicators has moved in pace with the CPI-ATE in recent months.
CPI and underlying inflation indicators. Twelve-month change. Percent

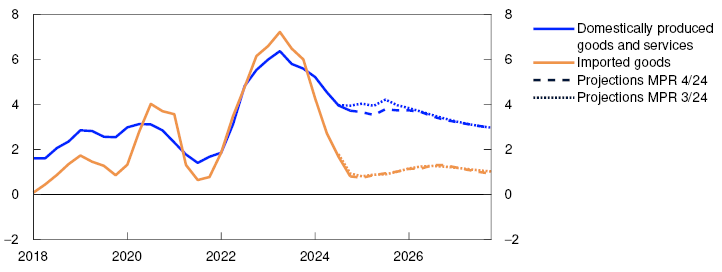
Over the past year and a half, the fall in imported goods inflation has been particularly pronounced (Chart 3.14). Domestically produced goods and services inflation has slowed less than CPI-ATE inflation. Rent growth remains high, but the rise in prices for other services, eg cultural services, has also remained elevated. Energy prices have risen through autumn but are still lower than one year ago and are dampening overall inflation.
Domestically produced goods and services and imported goods in the CPI-ATE. Four-quarter change. Percent
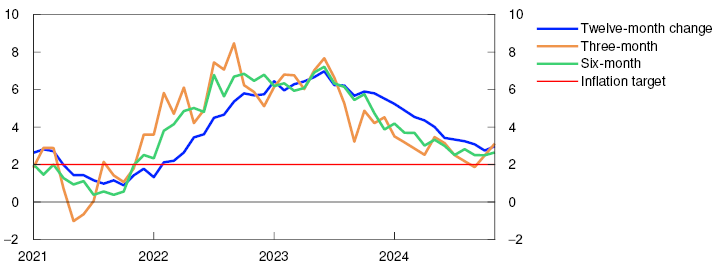
Inflation is normally measured as the 12-month change in the CPI, which helps filter out noise from monthly data but also means that changes in measured inflation respond with a lag to changes in the pace of inflation. Shorter-term measures of inflation, such as three and six-month annualised inflation, have declined faster than 12-month inflation in 2024 (Chart 3.13). The decline in these indicators has however softened through autumn, which may indicate slower disinflation in the period ahead.
CPI-ATE. Annualised change. Seasonally adjusted. Percent
Inflation projected to decline gradually
In the projections for the coming quarters, inflation changes little in the coming quarters and remains slightly below 3%, which is slightly lower than projected in the September Report. This reflects slightly lower overall inflation than expected in recent months. In November, inflation may have been pushed up slightly by the fact that seasonal sales, related to Black Friday, were not fully captured in the CPI. The seasonal rise in prices in December is therefore assumed to be lower in 2024 than in 2023.
Productivity has been higher than projected in September, which in isolation reduces growth in corporate costs. Productivity growth ahead is also expected to be slightly higher than projected in the previous Report. Wage growth is also projected to be slightly lower in 2025. Overall, this contributes to slightly lower projected inflation in 2025 than in the September Report. Further out, the projections show little change and indicate a decline in CPI-ATE inflation in line with a continued decline in wage growth.
Low imported goods inflation
Imported goods inflation has declined considerably since summer 2023 and is pulling down inflation. Price impulses to imported consumer goods, as measured by the IPK, have declined markedly in recent years and are now at close to pre-pandemic levels (Chart 1.B).
Looking ahead, the rise in the IPK is expected to remain stable at current levels, reflecting the fact that the effect of substantial cost shocks in the wake of the pandemic have now faded. The krone exchange rate is broadly as projected in the September Report. The largest effects of the krone depreciation in 2023 are assumed to have passed through to consumer prices. Overall imported consumer goods inflation is projected to remain low over the remainder of the projection period. The projections are little changed since September.
Domestic conditions expected to keep inflation elevated
Domestically produced goods and services inflation remain high and is keeping inflation above the inflation target. It is expected to take time for domestically produced goods and services inflation to return to levels consistent with the inflation target, reflecting high expected wage growth relative to productivity growth ahead.
Overall, CPI inflation is projected to show little change in the coming year before declining towards the end of the projection period. The CPI projections have been revised down more than the CPI-ATE projections. This is because the rise in energy prices has been lower than assumed in the September Report and electricity futures are lower than in September. Petrol futures are little changed since September.
High real wage growth in 2024 and 2025
Real wage growth is expected to be high in 2024 (Chart 3.15). In the projections, real wage growth, as measured against the CPI, softens ahead but remains high in 2025.
Annual change. Percent
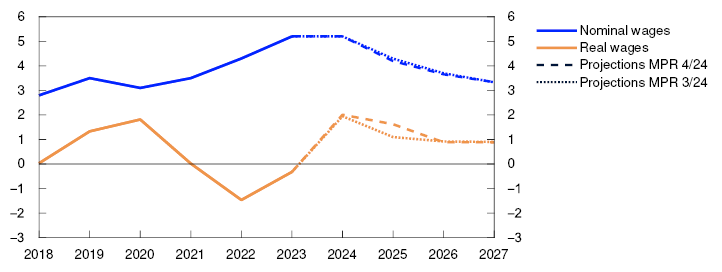
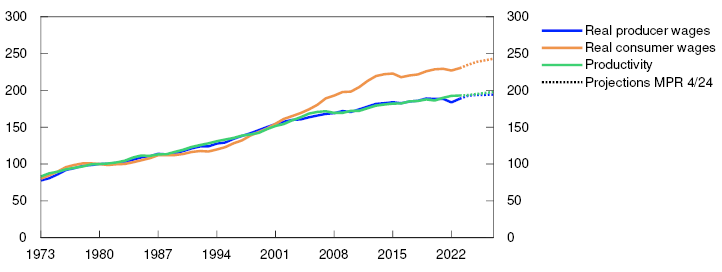
In the projections, real wages increase faster than productivity through the projection period. Projected real wage growth is nevertheless consistent with a stable wage share, due to projected terms of trade gains. Imported inflation is low and expected to change little ahead. At the same time, domestically produced goods and services inflation is projected to remain high throughout the entire projection period. Historically, Norwegian firms’ prices have tracked domestic inflation closer than overall CPI inflation. This means that real wage growth for Norwegian firms (real producer wages) will rise less than for households (real consumer wages) and track productivity more closely (Chart 3.16).
Index. 1980=100
Uncertainty surrounding price and wage inflation
Rapid disinflation in recent years indicates that the risk of very high entrenched inflation has abated. This is also reflected in inflation expectations, which still remain somewhat above 2% but are appreciably lower than one year ago (Chart 3.17). The inflation uncertainty index is also lower and now closer to a normal level than 12 months earlier (see discussion on page 39).
Inflation expectations ahead. Percent

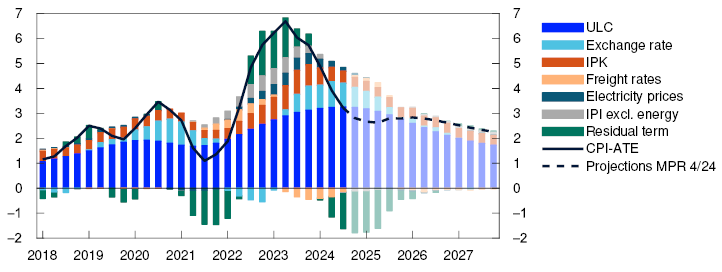
In recent years, there have been substantial deviations between consumer price inflation and what the historical relationship between inflation and key cost drivers would imply (as illustrated by residual terms in Chart 3.18). When inflation was high, prices rose faster than implied by historical relationships. Conversely, inflation has recently declined more than implied by historical relationships. The rise in consumer prices and cost drivers are expected to pick up again in tandem towards the end of the projection period. This assumes that historical relationships have not changed materially following a period of high inflation. If there is a break in the relationships, inflation may also fall faster ahead than assumed. Conversely, inflation may be higher than assessed if the entire cost increase in recent years (as indicated in Chart 3.18) is fully offset by higher selling prices ahead.
Contribution to four-quarter change in CPI-ATE. Percentage points
In the projections, imported consumer goods inflation changes little ahead and remains close to a historical average through the projection period, provided that domestic consumer goods affected by international prices are not hit by new shocks ahead. The risk of international trade conflicts has increased. If many countries impose high barriers to trade, this could have a substantial impact on prices in Norway. Higher tariffs or other barriers may lead to higher international prices, including for goods imported to Norway. On the other hand, some firms may choose to reduce prices to maintain sales. In Norway, inflation will also depend on movements in the krone exchange rate, which in turn depend on changes in the international interest rate outlook. At the same time, substantial changes in trade policy may have a considerable impact on financial markets, which may also affect the krone.
The wage share for manufacturing is low compared with a historical average. For mainland Norway, however, the overall wage share is at more normal levels, and there are wide differences across sectors, which add to the uncertainty around wage growth ahead and hence also around domestic inflation.
Indicators of uncertainty in the near and medium term
Expectations and projections of future economic developments will always be subject to considerable uncertainty. As an aid in understanding macroeconomic uncertainty, Norges Bank uses a modelling framework to quantify the uncertainty surrounding developments in three key macroeconomic variables: mainland GDP, consumer prices and house prices.1 The models help shed light on the uncertainty surrounding a set of point estimates. One of several possible risk indicators is derived from the simple modelling framework. A combination of discretion and model estimates will always be used for the Bank’s overall assessment of risk ahead.
In this box, the difference between the median and the 95th and 5th percentiles in the modelling framework’s estimated range of outcomes ahead, are used, respectively, as a measure of upside and downside risk. The charts show the estimated upside and downside risk for the different variables over time. They illustrate both changes in the size of the estimated range of outcomes, as measured by the difference between the 95th and 5th percentiles, and whether there is significant asymmetry between upside and downside risk.
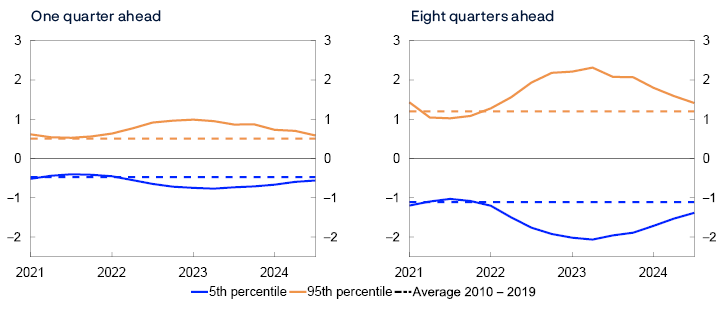
Inflation uncertainty, as measured by the difference between the 95th and 5th percentiles, increased substantially through 2022, with a particular rise in upside risk. Uncertainty has since moved down gradually and become more centred, and both near-term and medium-term uncertainty are now more in line with their historical averages (Chart 3.E).
Spread between percentiles and median from quantile regressions. Four-quarter change in CPI-ATE. Percentage points
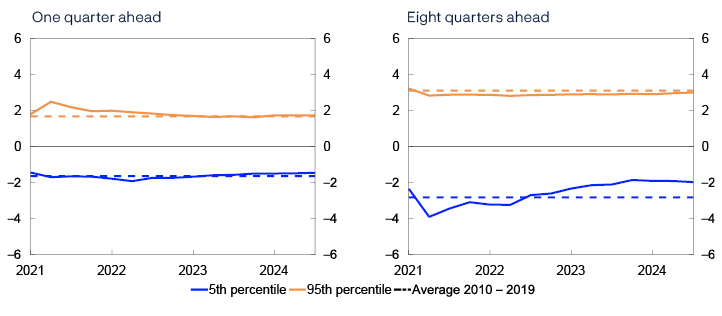
The models indicate that near-term uncertainty surrounding mainland GDP growth is balanced and close to normal levels (Chart 3.F, left panel). Medium-term uncertainty is somewhat below the average from the 2010s, with somewhat lower recent downside risk (Chart 3.F, right panel).
Spread between percentiles and median from quantile regressions. Four-quarter change in mainland GDP. Percentage points
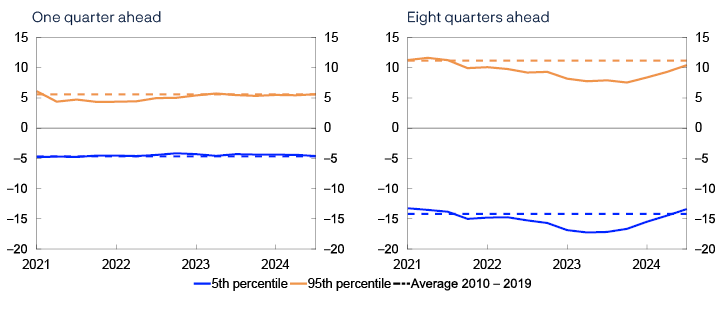
In the near term, uncertainty regarding house price inflation is also centred and close to its historical average (Chart 3.G, left panel). In the medium term, downside risk has been higher than normal for a couple of years but has recently moved down again (Chart 3.G, right panel).
Spread between percentiles and median from quantile regressions. Four-quarter change in house prices. Percentage points
- 1 The models use quantile regressions with different indicators to estimate the distribution of the different variables ahead. See a more detailed description in Bowe F., S.J. Kirkeby, I.H. Lindalen, K.A. Matsen, S.S. Meyer and Ø. Robstad (2023) “Quantifying macroeconomic uncertainty in Norway”. Staff Memo 13/2023. Norges Bank.
- 2 Period: 2021 Q1 – 2024 Q3. The charts show developments in the difference between the 5th and 95th percentiles from the median for the model estimated distribution of consumer price inflation one and eight quarters ahead, respectively. Broken lines indicate average 5th and 95th percentiles between 2010 and 2019
- 3 Period: 2021 Q1 – 2024 Q3. The charts show developments in the difference between the 5th and 95th percentiles from the median for the model estimated distribution of GDP growth one and eight quarters ahead, respectively. Broken lines indicate average 5th and 95th percentiles between 2010 and 2019.
- 4 Period: 2021 Q1 – 2024 Q3. The charts show developments in the difference between the 5th and 95th percentiles from the median for the model-estimated distribution of house price inflation one and eight quarters ahead, respectively. Broken lines indicate average 5th and 95th percentiles between 2010 and 2019.
- 1 Period: 2024–2025. Expectations Survey: Social partners’ annual wage growth expectations. Regional Network: Expected wage growth in own enterprise.
- 2 Period: January 2018 – October 2024. CPI-ATE: The consumer price index adjusted for tax changes and excluding energy products. Average: Average value of the 12-month change for other underlying inflation indicators (CPIM, CPIXE, 20 percent trimmed mean, weighted median, CPIXV, CPI-sticky prices and CPIF) and CPI-ATE. Indicators: Highest and lowest 12-month change for underlying inflation indicators.
- 3 Period: 2018 Q1 – 2027 Q4. CPI-ATE: the consumer price index adjusted for tax changes and excluding energy products. Projections from 2024 Q3 for MPR 3/24 and from 2024 Q4 for MPR 4/24.
- 4 Period: January 2021 – November 2024. Three and six months refer to average annualised monthly change over the different periods.
- 5 Period: 2018–2027. Projections from 2024. Real wages: Nominal annual wage growth adjusted for CPI inflation.
- 6 Period: 1973–2027. Projections from 2024. Real producer wages are labour costs deflated by the GDP deflator for mainland Norway. Real consumer wages are labour costs deflated by consumer prices. Productivity is mainland GDP per hour worked.
- 7 Period: 2002 Q1 – 2024 Q4. Inflation expectations two years ahead are the average of expectations among households, business leaders, economists and social partners. Inflation expectations five years ahead are the average of expectations among economists and social partners.
- 8 Period: 2018 Q1 – 2027 Q4. Projections from 2024 Q4. Decomposition of individual contributions from different cost components.
Underlying productivity growth
New national accounts data show that productivity growth has been slightly higher over the past couple of years than previously reported. The revised data have little impact on calculations of underlying productivity growth, which is projected by Bank staff to remain at relatively low levels. Developments in recent decades suggest that productivity growth has slowed internationally and across sectors, particularly in manufacturing.
Over time, productivity growth – measured as the change in value added per hour worked – improves living standards. Underlying productivity growth (trend growth), which abstracts from temporary fluctuations, is important for monetary policy when considering how rapidly the economy and purchasing power can grow without inflation following suit, among other things. Projections of underlying productivity growth therefore constitute a fundamental premise for monetary policy analysis.
Measured productivity growth will typically vary to some degree from year to year and over business cycles, without necessarily reflecting structural changes in production technology or processes. To gain a more accurate impression of underlying productivity growth, which better captures lasting efficiency gains, it is therefore beneficial to examine productivity growth over slightly longer periods.
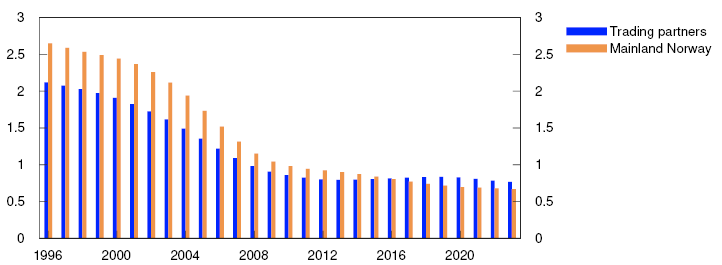
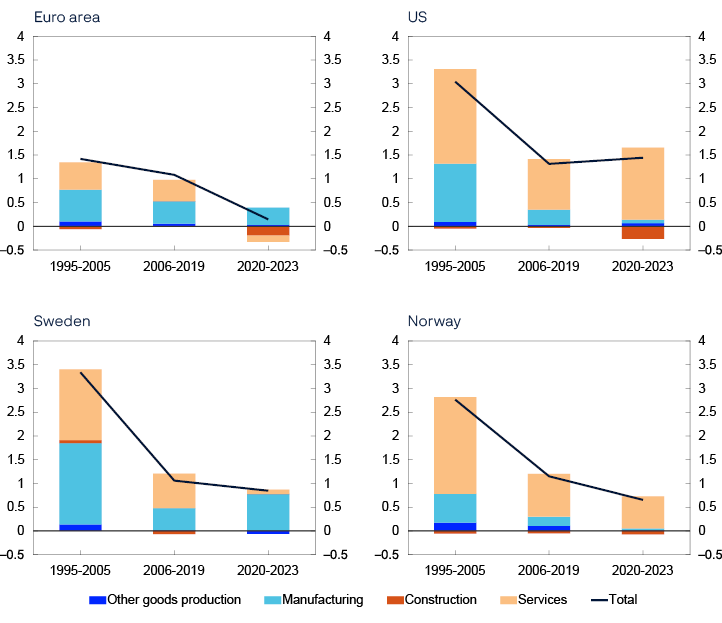
Underlying productivity growth has trended down in most developed economies over the past couple of decades. In both Norway and among Norway’s main trading partners, underlying productivity growth has more than halved since 2000 (Chart 3.H).1 The figures suggest a gradual convergence in international growth rates, and annual trend growth is currently well below 1% for both mainland Norway and a weighted average of Norway’s main trading partners.
Percent
Similar productivity data disaggregated by industry suggest that the slowdown in productivity has been relatively broad-based and that compositional effects have a negligible impact.3 Contributions to aggregate productivity growth from different sectors in the euro area, the US, Sweden and mainland Norway, are shown in Chart 3.I. The decline in productivity growth beginning in the run-up to the Great Financial Crisis affected most sectors, but service and manufacturing sectors in particular contributed to the slowdown in underlying productivity growth in these economies overall. Developments in the service sectors in Norway and the US – and to some extent Sweden – likely reflect a degree of normalisation after a period of historically high productivity growth around the turn of the millennium.
Percent
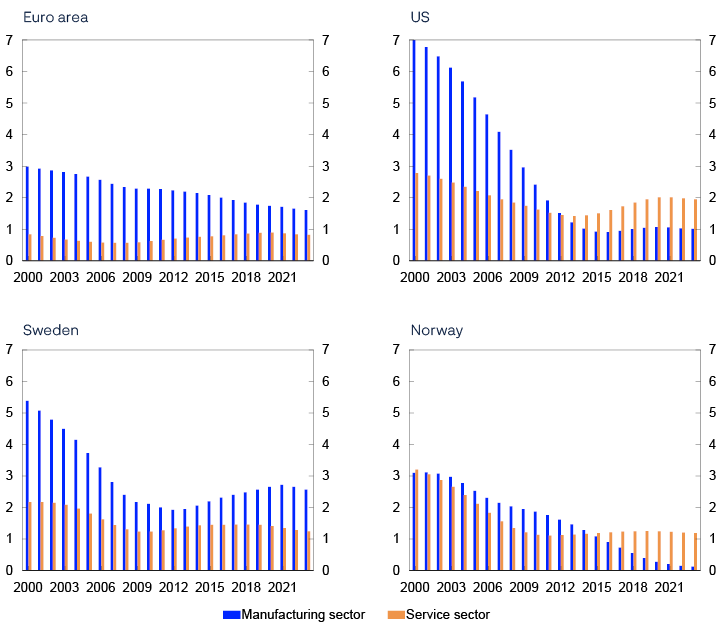
Overall global productivity growth has long been boosted by efficiency improvements within traditional manufacturing industries. This has also been partly true for Norway, although the productivity contribution from manufacturing has been smaller than in many other countries. Most manufactured products are traded globally, and global trade has likely led to a more efficient international division of labour and in addition been an important arena for the dissemination of new technology and improved production methods.
However, in the 2000s, underlying manufacturing productivity growth in many countries declined, at times markedly, and has since approached the more moderate growth rate of the service sector (Chart 3.J). A possible explanation may be that much of the productivity potential arising from globalisation has been gradually exhausted. Even though the decline eventually softened for Norway’s main trading partners, Norwegian manufacturing firms have had relatively weak overall productivity growth over the past decade. However, this has been more than offset by high selling prices relative to input prices, and profitability in manufacturing has remained elevated over the past couple of years. It is ultimately productivity measured in purchasing power that is decisive for prosperity.
Percent
The decline in trend productivity has been fairly consistent internationally and across sectors, suggesting one or more common growth drivers. Extensive research exploring plausible candidates has not reached a broad consensus. Some assert that the period of major productivity-enhancing inventions has passed, and recent technological advances have not had – and never will have – the same potential to raise productivity.6 Productivity has reached a high level in most advanced economies, and almost all low-hanging fruit has already been picked. Others note that even though it takes time for firms to adapt production and workforce to new technological opportunities, the seemingly rapid technological development currently observed, including artificial intelligence, will eventually boost productivity significantly.7
Together with trend employment, underlying productivity growth has a bearing on Norges Bank’s ongoing assessment of the potential output in the economy and thus capacity utilisation. Norges Bank also applies a large selection of models that more directly estimate ongoing capacity utilisation, thus indirectly providing information on potential output and underlying productivity growth, see box on page 30. The various model estimates fairly consistently indicate that trend growth has been relatively flat at a low level for quite some time.
The indication of persistently low underlying productivity growth in the near term is supported by data from Norges Bank’s Regional Network showing pessimism concerning productivity prospects among enterprises. Projections for underlying productivity growth further out in the projection period are largely based on a continuation of historical trends, suggesting fairly moderate trend growth ahead.
Revised national accounts data include a marked upward revision of productivity for mainland Norway in 2022, while the data for 2023 is little changed. The rise is due to, among other things, high activity in oil services and oil-related manufacturing, which likely reflects temporary conditions. Bank staff have nevertheless revised up projections for underlying productivity growth in the coming years marginally compared with the September Report (Table 3.A).
Estimates of hourly productivity are subject to uncertainty. There are known challenges associated with measuring both value added in volume (numerator) and hours worked (denominator). Some studies suggest that official statistics increasingly underestimate actual productivity growth.8 The conclusions in this box must therefore be interpreted with some caution.
- 1 Trend growth projections are obtained by first deriving an HP trend (Hodrick-Prescott, lambda equal to 100) from hourly productivity in level terms – and then calculating the annual growth. A weakness of this method is that the first and last observations in the sample period are weighted relatively high. The growth projections for these years must therefore be interpreted with some caution.
- 2 Period: 1995–2023. Based on data for value-added per hour worked (market value). Shows annual trend growth based on Hodrick-Prescott (HP) filtered productivity data in level terms.
- 3 Here, the focus is on the private sector. Parts of the service sector for which production occurs primarily through public means, such as public administration, defence, education and healthcare are omitted.
- 4 Period: 1995–2023. The chart shows sectoral contribution to average productivity growth in selected periods. In the services sector, services generally provided by the public sector, such as public administration, defence, education, health and social services, are excluded. Average annual growth over the period.
- 5 Period: 1995–2023. Based on data for value-added per hour worked (base value). Shows annual trend growth for manufacturing and services, respectively, based on Hodrick-Prescott (HP) filtered productivity data in level terms.
- 6 See Gordon, R. J. (2018) “Why Has Economic Growth Slowed When Innovation Appears to be Accelerating?”. NBER Working Paper 24554, National Bureau of Economic Research, Inc.
- 7 See Brynjolfsson, E., D. Rock, and C. Syverson (2021) “The Productivity J-Curve: How Intangibles Complement General Purpose Technologies”. American Economic Journal: Macroeconomics, vol. 13(1): 333-72. For a general summary of possible explanations, see eg Goldin, I., P. Koutroumpis, F. Lafond, and J. Winkler (2024). "Why Is Productivity Slowing Down?" Journal of Economic Literature, 62 (1): 196–268.
- 8 Goldin, I., P. Koutroumpis, F. Lafond, and J. Winkler (2024). "Why Is Productivity Slowing Down?" Journal of Economic Literature, 62 (1) : 196–268.
Increased power sector investment
After falling markedly since 2020, investment in the power sector has risen sharply in 2024. Investment in this sector is projected to continue to expand rapidly and to account for almost half of business investment growth in the period between 2024 and 2027. The projected expansion is driven by increased investment in the power grid and in existing hydroelectric power plants. Offshore wind projects are expected to boost investment further in the period to 2030.
Since 2010, power sector investment has accounted for an average of 10% of mainland business investment. Investment was high between 2018 and 2020 owing to strong investment in wind power and offshore cables. Upon completion of offshore cable projects, investment fell markedly, also reflecting the decline in wind power investment to almost zero. In 2023, investment in Norwegian electricity production was at its lowest in over 20 years.
Cuts in greenhouse gas emissions, increased digitalisation and new green industries will increase electricity consumption in the coming years. Electricity production is unlikely to keep pace (Chart 3.K). Together with higher electricity prices on the Continent, lower medium-term power surpluses could result in higher electricity prices in Norway ahead than has been the case in previous decades. This will spur investment in electricity production. The power grid must also be expanded and upgraded to meet higher demand for grid capacity.
Terawatt-hours (TWh)

Policy and regulatory constraints that safeguard important social considerations relating to nature, local community support and indigenous peoples’ rights impact power sector investment to a greater extent than investment in other business sectors. The period between the planning phase and launch of power and grid projects may therefore span many years. Investment in the power sector is therefore less cyclically sensitive than in other mainland business sectors.
Bank staff estimates for power sector investment are based on national accounts data and Statistics Norway’s investment survey. The survey includes data for past investment and projected investment in 2024 and 2025 in production of electricity, transmission and distribution of electricity, and district heating and gas. The staff estimates are also based on electricity futures prices, analyses from the Norwegian Water Resources and Energy Directorate (NVE) and Statnett,2 announced investment plans, news about potential projects and information regarding political decisions that affect power investment conditions.
Power sector investment has picked up considerably since summer 2023 and is projected by Bank staff to increase by 20% in 2024 and by almost 30% in 2025, in line with projections from the most recent investment survey (Chart 3.L). Investment is then expected to increase by a further 5–6% per year in 2026 and 2027.
Constant 2024 prices. In billions of NOK
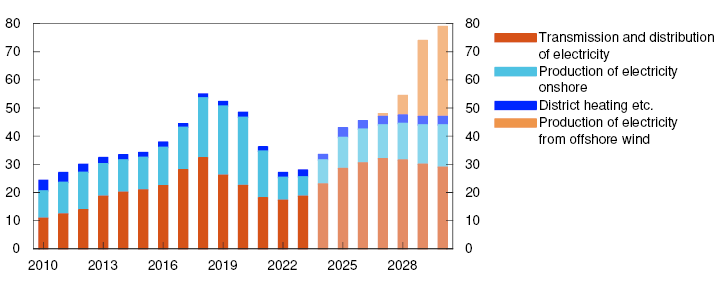
Investment in transmission and distribution of electricity accounts for two-thirds of the projected increase in electricity investment between 2023 and 2027. This investment is driven by the marked rise in grid capacity demand in recent years, which is also expected to rise steeply ahead. Owing to elevated demand, the power grid has reached capacity in many areas and a number of manufacturing projects have been postponed or cancelled due to limited power access. Since grid companies are required to connect new customers and accommodate existing customers, they must invest in grid capacity and upgrade the existing power grid to meet increased demand. Grid investment is likely to remain high in the period between 2028 and 2030.
Investment in the production of electricity is projected to increase substantially in the period between 2023 and 2027 but remain far lower than during the peak between 2018 and 2020. The increase largely reflects higher power sector investment in upgrades and expansions of existing hydroelectric power plants. In a number of cases, investment increases peak capacity, ie the ability to provide electricity is increased for a brief period when electricity prices are high, without necessarily leading to higher overall production. The profitability of such projects has increased recently owing to more volatile electricity prices. Investment in new hydroelectric power plants may also increase somewhat ahead, but the potential is limited as most undeveloped river systems are protected.
The power sector is likely to invest little in onshore wind power over the next few years, as few wind projects have applied for or been granted licenses. However, work on a number of wind power projects has been announced by the power sector. Bank staff therefore expect investment in onshore wind to pick up towards the end of the decade. Investment in solar power plants is also expected to rise from a low level. Some solar projects have been granted licences in recent years, and several have applied for licenses. Investment in district heating is also projected to be higher ahead than in recent years.
Investment in offshore wind may be significant further out. The first bottom-fixed project in Sørlige Nordsjø II is expected to fully commence towards end-2027, with total investment of NOK 60–80bn, most of which is expected in 2029 and 2030. The floating offshore wind project in Utsira Nord is also expected to increase investment during this decade, but mostly in the 2030s. The GoliatVIND project and other offshore wind projects associated with the petroleum industry may result in investment before 2030. Offshore wind investment will largely depend on politically determined framework conditions, including the size of the announced areas and the scope of support schemes.
Demand for electricity is expected to increase in the future, but the extent is uncertain. Several power-intensive projects in hydrogen, batteries and traditional manufacturing have been postponed or cancelled over the past year. If this trend continues, long-term investment in the grid and electricity production may be lower than currently projected by Bank staff.
On the other hand, electricity consumption may be higher than expected if more extensive climate measures are implemented and a larger share of energy consumption is electrified than currently assumed, potentially pushing power sector investment higher than projected.
- 1 Period: 2010–2028. NVE’s projections for 2024, see “Kortsiktig kraftbalanse 2024–2028” [Short-term energy trade balance 2024–2028], published 20 June 2024 (in Norwegian only).
- 2 Bank staff estimates for investment in transmission and distribution of electricity for the period between 2026 and 2030 are based on Statnett’s projection for their own investment in the national transmission grid and projections for investment in regional distribution grids and the national transmission grid on the NVE website (see PlanNett, summary in Statnett (2023): “System development plan for 2023” and data sources from the RME/NVE (2024): “Framskriving av nettleie i lokalt distribusjonsnett 2024–2030” [Projection of electricity distribution charges in local distribution grids 2024–2030]. NVE Report 6/2024 (Norwegian only).
- 3 Period: 2010–2030. Projections from 2024. Figures for 2010–2023 retrieved from Statistics Norway’s investment survey, deflated by the price index for power investments in the national accounts. The price index is expected to increase by 4 percent in 2024 and by 2 percent in 2025.
4. Monetary policy analysis
Prospects for slightly lower price inflation than previously assumed pull down the rate path in Norges Bank’s analysis system. Higher public demand and somewhat higher petroleum investment and private consumption pull in the direction of a higher rate path. A simple monetary policy rule indicates a somewhat lower rate path than the rule indicated in the September Monetary Policy Report.
4.1 The policy rate path and monetary policy objectives
The operational target of monetary policy is annual consumer price inflation of close to 2% over time. Inflation targeting shall be forward-looking and flexible so that it can contribute to high and stable output and employment and to countering the build-up of financial imbalances. The Monetary Policy and Financial Stability Committee’s monetary policy strategy is discussed further on page 4.
The policy rate was kept unchanged at 4.5% at the meeting on 18 December. The policy rate forecast is little changed in the coming year but indicates a somewhat smaller reduction in the coming years. Based on the Committee’s current assessment, the policy rate will most likely be reduced in March 2025. The policy rate is projected to be 2.9% at the end of 2027.
The projections are uncertain. If the economic outlook or the assessment of the functioning of the economy change, the policy rate may prove to be different from the one currently projected.
4.2 New information and assessments
Slightly lower inflation and higher capacity utilisation
To shed light on how developments since the September Report affect the economic outlook, new information and assessments of the economic situation are incorporated into the Bank’s modelling system, while conditioning on the policy rate path from September. This exercise shows the projections for capacity utilisation and inflation that the modelling system would have produced with the policy rate path from September.
In the exercise with the rate path from September, capacity utilisation is higher throughout the projection period (Chart 4.1). Consumer price inflation adjusted for tax changes and excluding energy products (CPI-ATE) remains lower in the period to mid-2026 compared with the September Report.
Projections conditioned on new information concerning economic developments and the policy rate forecast in Monetary Policy Report 3/2024.
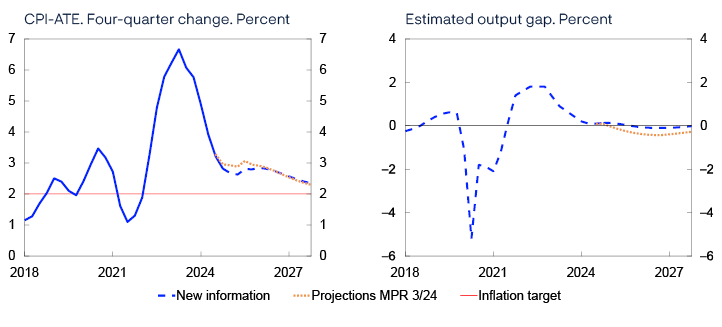
Policy rate expectations are now in line with the policy rate path in the coming period
Market policy rate expectations further out can provide an indication of how market participants have interpreted new information and how they expect Norges Bank to react.
Policy rate expectations are broadly in line with the policy rate path in this Report through 2025 (Chart 4.2). Towards the end of the projection period, market policy rate expectations are above the path.
Policy rate. Percent
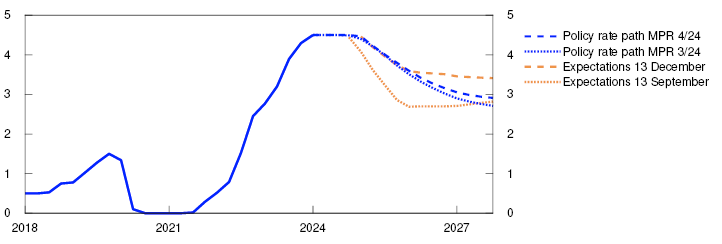
Policy rate expectations have risen since the September Report. Some of this rise occurred after the publication of the Report. Overall, policy rate expectations have risen more than Norges Bank’s policy rate path.
Market policy rate expectations among Norway’s main trading partners overall are higher than in the September Report (Chart 4.3). Market expectations indicate rate reductions in both Norway and among trading partners ahead, although somewhat fewer than previously expected. Policy rate differentials are expected to increase somewhat in the coming period before declining slightly but remain positive throughout the forecast horizon.
Policy rates in Norway and among Norway’s main trading partners. Percent
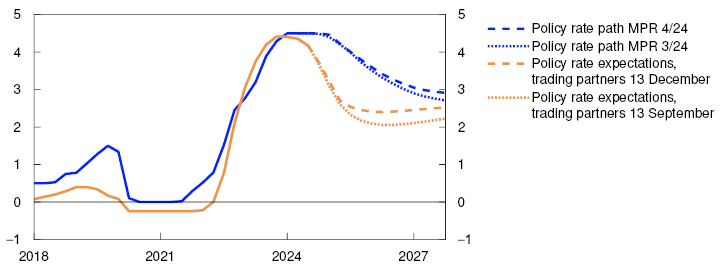
The simple rule indicates a slightly lower money market rate ahead
A simple policy rate rule shows how the money market rate has historically correlated with the output gap and inflation (see Monetary Policy Report 2/2022). The simple rule indicates a slightly lower policy rate in the coming quarters than the rule indicated in the September Report owing to a larger contribution from the downward revision of inflation than the upward revision of the output gap. The level is still slightly higher than the forecast for the money market rate, but the difference is smaller than in the September Report (Chart 4.4).
Three-month money market rate. Percent
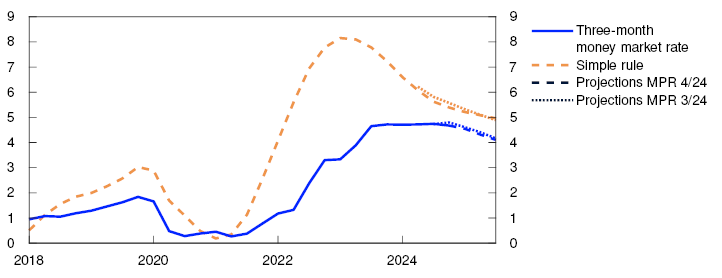
- 1 Period: 2018 Q1 – 2027 Q4. Projections from 2024 Q3 for MPR 3/24 and 2024 Q4 for MPR 4/24. CPI-ATE: CPI adjusted for tax changes and excluding energy products. The output gap measures the percentage deviation between mainland GDP and projected apotential mainland GDP.
- 2 Period: 2018 Q1 – 2027 Q4. Expectations from 13 September for MPR 3/24. Expectations from 13 December for MPR 4/24.
- 3 Period: 2018 Q1 – 2027 Q4. Estimated forward rates from 13 September for MPR 3/24 and 13 December for MPR 4/24. The international policy rate is a trade-weighted average of the policy rates of the Bank of England, the ECB, the Federal Reserve and Sveriges Riksbank.
- 4 Period: 2018 Q1 – 2025 Q3. Projections from 2024 Q3 for MPR 3/24 and 2024 Q4 for MPR 4/24. The rule uses projections three quarters ahead for inflation and projections for the current quarter for the output gap.
4.3 Monetary policy stance and drivers behind changes in the policy rate path
Compared with the September Report, the policy rate forecast is little changed in the coming year but indicates somewhat fewer rate reductions ahead. Inflation projections have been revised down slightly, pushing up the expected real interest rate. Lower money market premiums result in somewhat lower money market rates, which pushes down the expected real interest rate somewhat. On the whole, this results in a forecast of the real interest rate that is broadly unchanged since the September Report (Chart 4.5).
Estimate of the expected real money market rate. Percent
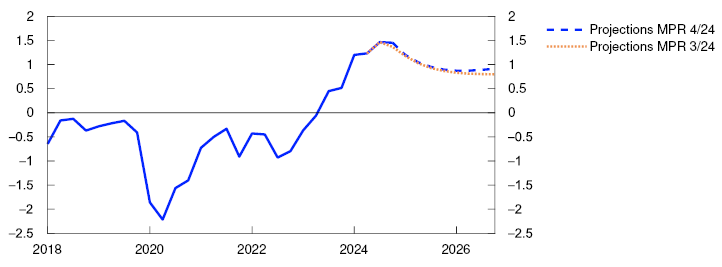
In the forecast, the real interest rate for the coming quarters is slightly higher than the estimated neutral real interest rate (see Monetary Policy Report 2/2024). Both nominal and real interest rates affect consumption and thus activity in the Norwegian economy (see box in Monetary Policy Report 3/2023). Projected nominal residential mortgage rates are slightly lower than projected earlier, which in isolation contributes to slightly higher consumption. Looking ahead, the policy rate is expected to decline somewhat faster than inflation, leading to a lower expected real interest rate. At the end of 2026, the real interest rate is projected to be around 0.9%, which is in the upper range of the neutral real interest rate estimate.
The forecasts indicate somewhat improved policy objective outcomes
The trade-offs between bringing inflation quickly back to target and promoting high and stable output and employment are expressed in the inflation and output gap forecasts. Chart 4.6 illustrates the trade-offs in this and previous reports. The points show the projections of the output gap and inflation (measured as the deviation from the inflation target) one to three years ahead in different reports. The location of the points in the chart depends on the economic shocks and the monetary policy response. In the theoretical literature, a condition for appropriate trade-offs is that inflation gap and output gap forecasts have opposite signs. For example, if both gaps were negative, inflation could approach the target, and output could approach potential with a lower policy rate. In situations where other factors are weighted heavily, such as the risk of financial instability or uncertainty related to the effect of the policy rate, both gaps may nevertheless have the same sign in the forecasts. Over the past two years, the forecasts for the two gaps have been in the north-west quadrant, meaning that output cannot be brought any further up towards potential without moving inflation further from the target. The points have gradually moved closer to the origin, suggesting prospects for somewhat improved overall outcomes for the objectives of monetary policy. This means that the inflation forecast is closer to target and output is closer to potential.
6Inflation gap and output gap. Average 1–3 years ahead
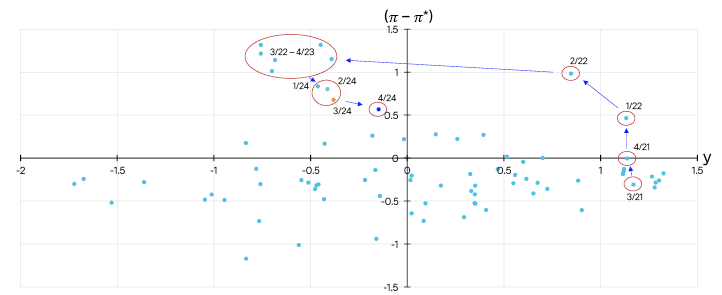
The model-based analysis implies a slightly higher policy rate path
In the decomposition in Chart 4.7, the Bank’s main model NEMO is used to break down the main drivers behind the changes in the policy rate path since the September Report. In macroeconomic models such as NEMO, economic fluctuations that bring inflation away from target and output away from potential, are explained by shocks. The decomposition shows how changes in shocks since the September Report contribute to changes in the policy rate path. Changes in the shocks arise when new data and projections of developments in the coming period differ from what drivers in the model would suggest. The bars show contributions to changes in the model-based path from different types of shocks, and the broken line shows the sum of the bars. The solid line shows the actual change in the rate path.
Cumulative contributions. Percentage points
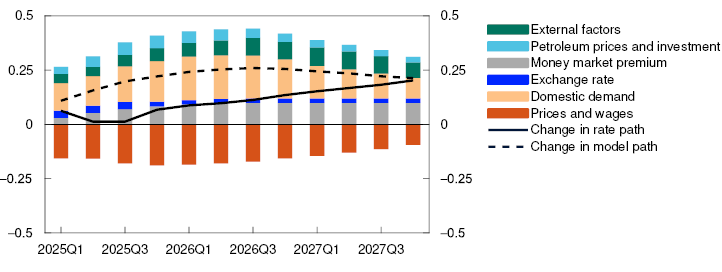
Market pricing now indicates somewhat higher international policy rates than envisaged earlier, and overall economic growth among trading partners has been slightly higher than projected in September. External factors suggest a slightly higher model-based path (green bars).
Since the September Report, gas spot and futures prices have risen. Oil prices are broadly unchanged while futures prices are higher. Overall, petroleum prices are slightly higher than in the September Report. The projections for petroleum investment have been revised up since September, and somewhat more than suggested by the rise in petroleum prices in the model framework. Factors relating to petroleum prices and investment contribute to a slightly higher model-based path (light blue bars).
The money market premium has declined since the September Report and projections ahead have been revised down, suggesting an easing of financial conditions and contributing in isolation to a slightly higher model-based path (grey bars).
The krone exchange rate has moved broadly in line with changes in the interest rate differential and only makes minor contributions to changes in the model-based path (dark blue bars).
The projections for public demand have been revised up since the September Report, and together with somewhat higher near-term consumption projections than can be explained by the model drivers, this pulls up the model-based path. In isolation, lower housing investment than previously assumed and lower projections for the period ahead contribute to a slightly lower model-based path. Overall, domestic demand factors pull up the model-based path (orange bars).
Inflation has been lower than implied by key cost drivers in the model. Near-term inflation projections are lower than in the September Report, which pulls in the direction of a somewhat lower model-based path (red bars).
The model analysis implies a slightly higher policy rate path compared with the September Report. The policy rate path is slightly lower than the model-based path.
- 5 Period: 2018 Q1 – 2026 Q4. The expected real interest rate is the projected money market rate over the next four quarters less projected CPI-ATE inflation over the same period. For 2024 Q4 and in the projection period, the expected real interest rate is estimated based on the projections in this Report. For all previous periods, the expected real interest rate is based on the most up-to-date Monetary Policy Report at the time in question.
- 6 Period: 2005 Q4 – 2024 Q4. The chart shows combinations of forecasts for the output gap (y) and inflation (Π) deviation from the target (Π*) on average one to three years ahead. Each point represents the forecasts in a specific Monetary Policy Report. Forecasting improves the closer the points are to origin, although the points will normally lie further from the origin following larger shocks. Their location in the diagram depends on the monetary policy stance. Often, but not always, an appropriate trade-off will entail a policy rate path that implies that the forecasts for the inflation gap and the output gap have opposite signs. The trade-offs in the monetary policy reports between September 2021 and December 2024 are circled in red.
- 7 Period: 2025 Q1 – 2027 Q4. Projections. The contributions are based on model estimates from the NEMO model, but there is no mechanistic link between news and changes in the bars. The effect of news feeds through with a lag and the interaction between economic variables may result in a reversal of the effect over time. In addition, projections for the near term may entail news with different signs at different times. The effect on the rate path is therefore shown most clearly by the cumulative contributions.
Annex
Detailed tables of projections
TABLe 1 International projections
|
Change from projections in Monetary Policy Report 3/2024 in brackets |
Weights1 Percent |
Percentage change from previous year |
||||
|---|---|---|---|---|---|---|
|
2023 |
2024 |
2025 |
2026 |
2027 |
||
|
GDP |
||||||
|
US |
12 |
2.9 |
2.7 (0.1) |
2.1 (0.3) |
1.9 (0.1) |
1.8 (0.1) |
|
Euro area |
47 |
0.5 |
0.8 (0.1) |
1.1 (-0.2) |
1.4 (-0.2) |
1.4 (-0.1) |
|
UK |
15 |
0.1 |
0.9 (-0.2) |
1.5 (0.2) |
1.3 (-0.2) |
1.4 (0) |
|
Sweden |
18 |
0 |
0.6 (0) |
1.9 (0.1) |
2.4 (0.2) |
2 (-0.1) |
|
China |
8 |
5.3 |
4.8 (0) |
4.5 (0.4) |
3.5 (-0.3) |
3.4 (-0.2) |
|
5 trading partners1 |
100 |
1 |
1.3 (0) |
1.7 (0) |
1.8 (-0.1) |
1.7 (-0.1) |
|
Prices |
||||||
|
Underlying inflation2 |
5.2 |
3 (0) |
2.4 (0.1) |
2.2 (0.1) |
2.1 (0) |
|
|
Wage growth2 |
5 |
4.3 (0) |
3.4 (-0.1) |
3.2 (0) |
3 (0) |
|
|
Prices for consumer goods imported to Norway, |
-0.1 |
2.5 (-0.3) |
0.1 (-0.4) |
0.3 (0.5) |
0.7 (0.1) |
|
Sources: LSEG Datastream and Norges Bank
Table 2a Consumer prices. Twelve-month change. Percent
|
2024 |
2025 |
||||||
|---|---|---|---|---|---|---|---|
|
Sep |
Oct |
Nov |
Dec |
Jan |
Feb |
Mar |
|
|
Consumer price index (CPI) |
|||||||
|
Actual |
3.0 |
2.6 |
2.4 |
||||
|
Projections MPR 3/24 |
3.1 |
2.6 |
2.6 |
3.1 |
|||
|
Projections MPR 4/24 |
2.8 |
2.3 |
2.6 |
2.4 |
|||
|
CPI-ATE |
|||||||
|
Actual |
3.1 |
2.7 |
3.0 |
||||
|
Projections MPR 3/24 |
3.3 |
2.9 |
3.0 |
3.0 |
|||
|
Projections MPR 4/24 |
2.8 |
2.6 |
2.7 |
2.7 |
|||
|
Imported consumer goods in the CPI-ATE |
|||||||
|
Actual |
1.5 |
0.9 |
1.0 |
||||
|
Projections MPR 3/24 |
1.8 |
1.2 |
1.0 |
0.8 |
|||
|
Projections MPR 4/24 |
0.6 |
0.9 |
0.3 |
0.8 |
|||
|
Domestically produced goods and services in the CPI-ATE |
|||||||
|
Actual |
3.9 |
3.6 |
3.9 |
||||
|
Projections MPR 3/24 |
4.0 |
3.8 |
3.9 |
4.2 |
|||
|
Projections MPR 4/24 |
3.8 |
3.5 |
3.9 |
3.7 |
|||
Sources: Statistics Norway and Norges Bank
Table 2b House prices. Monthly change. Seasonally adjusted. Percent
|
2024 |
2025 |
||||||
|---|---|---|---|---|---|---|---|
|
Sep |
Oct |
Nov |
Dec |
Jan |
Feb |
Mar |
|
|
Actual |
0.4 |
0.3 |
0.4 |
||||
|
Projections MPR 3/24 |
0.3 |
0.3 |
0.2 |
0.2 |
|||
|
Projections MPR 4/24 |
0.4 |
0.5 |
0.4 |
0.4 |
|||
Sources: Eiendomsverdi. Finn.no. Real Estate Norway and Norges Bank
Table 2c Registered unemployment (rate). Percent of labour force. Seasonally adjusted
|
2024 |
2025 |
||||||
|---|---|---|---|---|---|---|---|
|
Sep |
Oct |
Nov |
Dec |
Jan |
Feb |
Mar |
|
|
Actual |
2.1 |
2.1 |
2.1 |
||||
|
Projections MPR 3/24 |
2.0 |
2.1 |
2.1 |
2.1 |
|||
|
Projections MPR 4/24 |
2.1 |
2.1 |
2.1 |
2.1 |
|||
Sources: Nav and Norges Bank
Table 2d GDP for mainland Norway. Quarterly change.1 Seasonally adjusted. Percent
|
2024 |
2025 |
|||
|---|---|---|---|---|
|
Q2 |
Q3 |
Q4 |
Q1 |
|
|
Actual |
0.3 |
0.5 |
||
|
Projections MPR 3/24 |
0.3 |
0.2 |
||
|
Projections MPR 4/24 |
0.3 |
0.3 |
||
- 1 Quarterly figures based on monthly national accounts.
Sources: Statistics Norway and Norges Bank
Table 3 Projections of main economic aggregates
|
Change from projections in Monetary Policy Report 3/2024 in brackets |
Percentage change from previous year (unless otherwise stated) |
|||||
|---|---|---|---|---|---|---|
|
Constant 2022-prices |
2023 |
Projections |
||||
|
2024 |
2025 |
2026 |
2027 |
|||
|
Prices and wages |
||||||
|
CPI |
5.5 |
3.2 (0.0) |
2.6 (-0.6) |
2.8 (0.0) |
2.4 (0.0) |
|
|
CPI-ATE |
6.2 |
3.7 (0.0) |
2.7 (-0.3) |
2.7 (-0.1) |
2.4 (0.0) |
|
|
Annual wages |
5.2 |
5.2 (0.0) |
4.2 (-0.1) |
3.7 (0.0) |
3.3 (0.0) |
|
|
Real economy1 |
||||||
|
Gross domestic product (GDP) |
5733 |
0.1 |
2.2 (0.6) |
2.4 (0.6) |
0.1 (-0.4) |
0.0 (-0.5) |
|
GDP, mainland Norway2 |
3703 |
1 |
0.9 (0.3) |
1.4 (0.3) |
1.4 (0.1) |
1.4 (-0.1) |
|
Output gap, mainland Norway (level) |
0.8 |
0.1 (0.0) |
0.1 (0.3) |
-0.1 (0.3) |
-0.2 (0.1) |
|
|
Employment, persons, QNA |
1.3 |
0.6 (0.0) |
0.7 (0.2) |
0.7 (0.0) |
0.7 (-0.1) |
|
|
Registered unemployment (rate, level) |
1.8 |
2.0 (0.0) |
2.1 (-0.1) |
2.2 (-0.1) |
2.2 (0.0) |
|
|
Demand1 |
||||||
|
Mainland demand2 |
3760 |
0.2 |
0.4 (0.8) |
2.3 (0.0) |
2.2 (-0.2) |
2.0 (-0.2) |
|
– Household consumption |
1843 |
-0.8 |
1.2 (0.1) |
2.6 (-0.1) |
1.8 (-0.4) |
1.7 (-0.2) |
|
– Business investment |
397 |
3.4 |
-4.1 (2.3) |
2.6 (2.1) |
2.7 (0.3) |
2.1 (-0.6) |
|
– Housing investment |
194 |
-18.3 |
-18.9 (-2.7) |
-2.5 (-6.5) |
10.3 (0.7) |
8.2 (-0.1) |
|
– Public demand |
1326 |
4.1 |
3.5 (1.4) |
2.4 (0.2) |
1.8 (0.0) |
1.7 (0.0) |
|
Petroleum investment2 |
197 |
10.6 |
10.0 (0.0) |
4.0 (3.0) |
-6.0 (-1.0) |
-5.0 (0.0) |
|
Mainland exports2 |
1026 |
8 |
4.0 (2.3) |
2.5 (-2.4) |
2.1 (0.0) |
2.5 (-0.2) |
|
Imports |
1440 |
-1 |
2.0 (1.1) |
2.3 (-0.9) |
2.4 (0.6) |
2.5 (0.7) |
|
House prices and debt |
||||||
|
House prices |
0.2 |
2.9 (0.0) |
6.3 (0.9) |
8.5 (0.4) |
6.5 (0.1) |
|
|
Household credit (C2) |
3.4 |
3.6 (0.7) |
3.8 (1.0) |
3.8 (0.9) |
3.8 (0.6) |
|
|
Interest rate, exchange rate and oil price |
||||||
|
Policy rate (level) |
3.5 |
4.5 (0.0) |
4.1 (0.0) |
3.4 (0.1) |
3.0 (0.2) |
|
|
Import-weighted exchange rate (I-44) (level) |
119.5 |
120.2 (0.0) |
121.0 (0.1) |
121.0 (0.3) |
121.0 (0.4) |
|
|
Policy rate, trading partners (level) |
3.9 |
4.2 (0.1) |
2.7 (0.2) |
2.4 (0.3) |
2.5 (0.3) |
|
|
Oil price, Brent Blend. USD per barrel |
83 |
81 (0.8) |
73 (4.3) |
71 (2.1) |
69 (0.4) |
|
|
Household income and saving1 |
||||||
|
Real disposable income excl. dividend income |
-1.5 |
4.2 (0.9) |
3.3 (1.1) |
2.6 (-0.4) |
2.1 (-0.4) |
|
|
Saving ratio excl. dividend income (rate, level) |
-0.4 |
1.5 (-0.5) |
2.5 (0.6) |
2.9 (0.6) |
3.4 (0.6) |
|
|
Fiscal policy |
||||||
|
Structural non-oil deficit as a percentage of GPFG3 |
3 |
2.7 (0.0) |
2.5 (0.0) |
2.5 (0.0) |
2.5 (0.0) |
|
|
Structural non-oil deficit as a percentage of trend GDP |
9.6 |
10.7 (0.3) |
11.7 (1.0) |
11.8 (0.9) |
11.9 (0.9) |
|
Sources: Eiendomsverdi, Finn.no, LSEG Datastream, Ministry of Finance, Norwegian Labour and Welfare Administration (Nav), Real Estate Norway, Statistics Norway and Norges Bank