Norges Bank’s Monetary Policy and Financial Stability Committee decided to keep the policy rate unchanged at 4.5% at its meeting on 18 September. Based on the Committee’s current assessment of the outlook, the policy rate will most likely be kept at that level to the end of 2024.
Lower international inflation and expectations of policy rate cuts
Consumer price inflation among Norway’s main trading partners has declined markedly over the past couple of years and is approaching the inflation targets of a number of central banks. Core inflation has also fallen markedly but is somewhat higher than headline inflation. Economic activity among trading partners increased in Q2 broadly in line with projections. In many countries, labour market tightness has eased recently. Oil prices have fallen since June.
Consumer prices. Twelve-month change. Percent
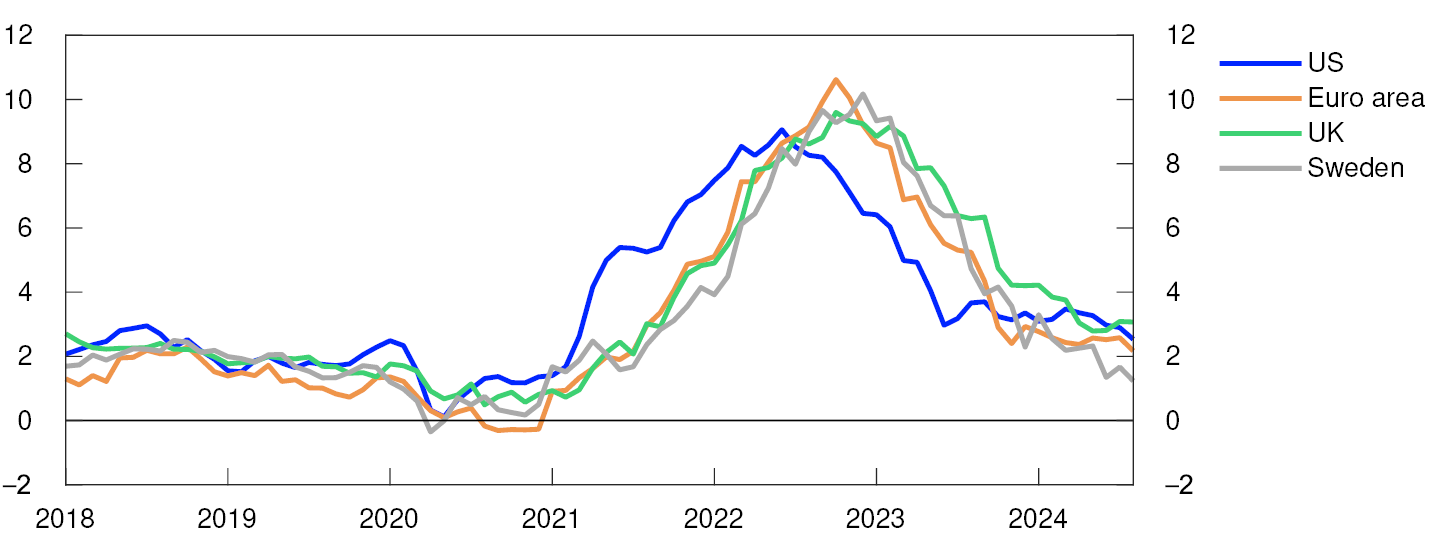
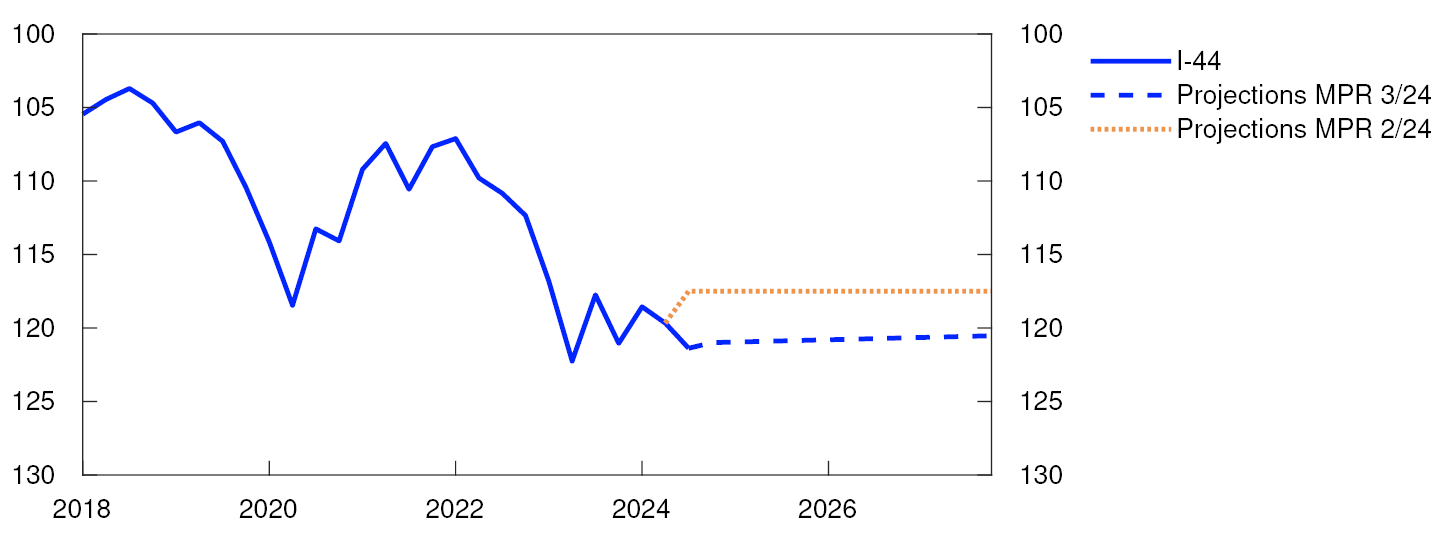
Many central banks have expressed increased confidence that inflation will be close to their inflation targets ahead, and that the current tight monetary policy stance is no longer warranted. Central banks in a number of main trading partner countries have reduced their policy rates, and market expectations indicate further cuts both this year and next. Policy rate expectations have fallen considerably since the June 2024 Monetary Policy Report, and by somewhat more abroad than in Norway. Market pricing indicates a reduction in the Norwegian policy rate towards the end of this year. Long-term interest rates are also lower than at the time of the June Report. The krone has depreciated and is weaker than projected in June.
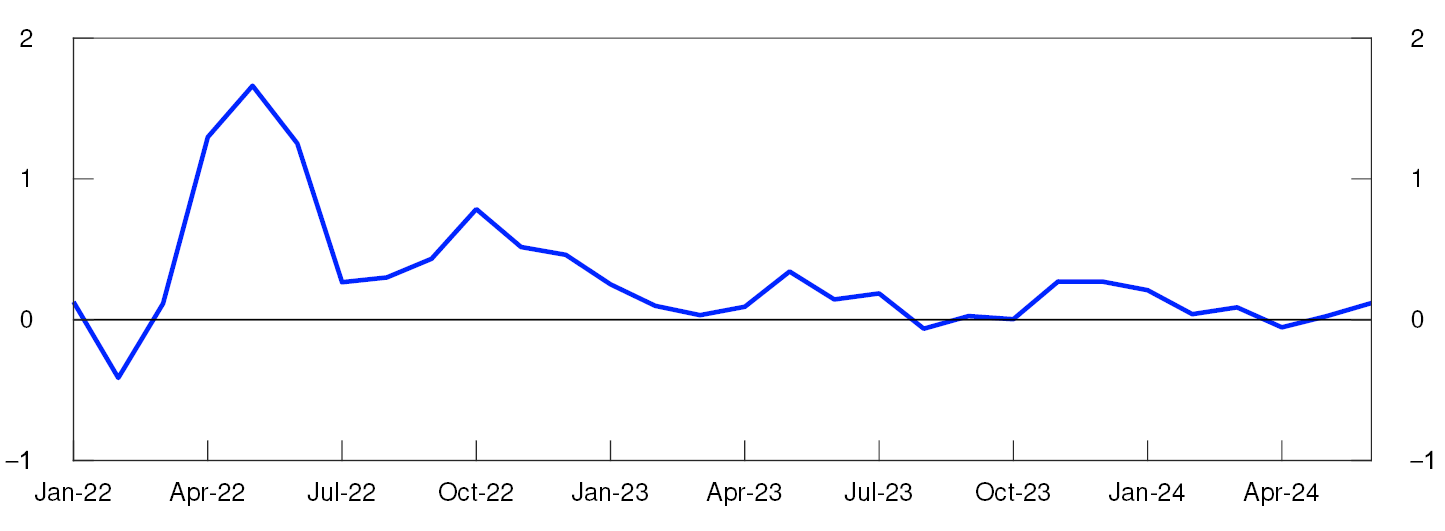
Import-weighted exchange rate index. I-44

Weak growth in the Norwegian economy
Growth in the Norwegian economy was low through last year and has remained sluggish so far this year. In 2024 Q2, growth was slightly lower than expected. Household consumption increased in Q2, but in July slumping car sales contributed to a fall in goods consumption. Housing investment continued to fall in Q2 from an already low level. New home sales have picked up a little so far this year, but it will likely take time before housing investment starts to rise again. In the secondary market, house prices have increased since the June Report, but are slightly lower than projected.
GDP for mainland Norway. Three-month moving average. Percent
Norges Bank’s Regional Network enterprises expect some increase in overall activity in the second half of 2024 and slightly higher growth than in the first half-year. There are still wide differences across industries. Services contacts report solid demand and expect activity to increase further in the near term. Oil services expect continued strong growth. Manufacturing contacts expect weak growth in activity, while construction industry and retail trade contacts expect a decline.
Overall output in the Norwegian economy appears to have been around potential since the beginning of the year. Registered unemployment has shown little change in recent months and was 2.0% in August, as projected in the June Report. LFS unemployment data indicate that unemployment has been stable around 4% since March 2024. Employment was little changed in Q2, broadly as expected.
Growth in the Norwegian economy is set to be slightly lower in the near term than projected in the June Report. Growth is projected to pick up a little in the second half of 2024 but to remain low. In the short term, a decline in housing and business investment will likely weigh down on activity, while an increase in consumption will lift activity. Petroleum investment will likely boost activity both this year and next, with investment now expected to be higher than previously assumed. Public demand will also support activity ahead. In the projection, capacity utilisation is expected to drift further down over the next year with output running at somewhat below potential.
Declining inflation
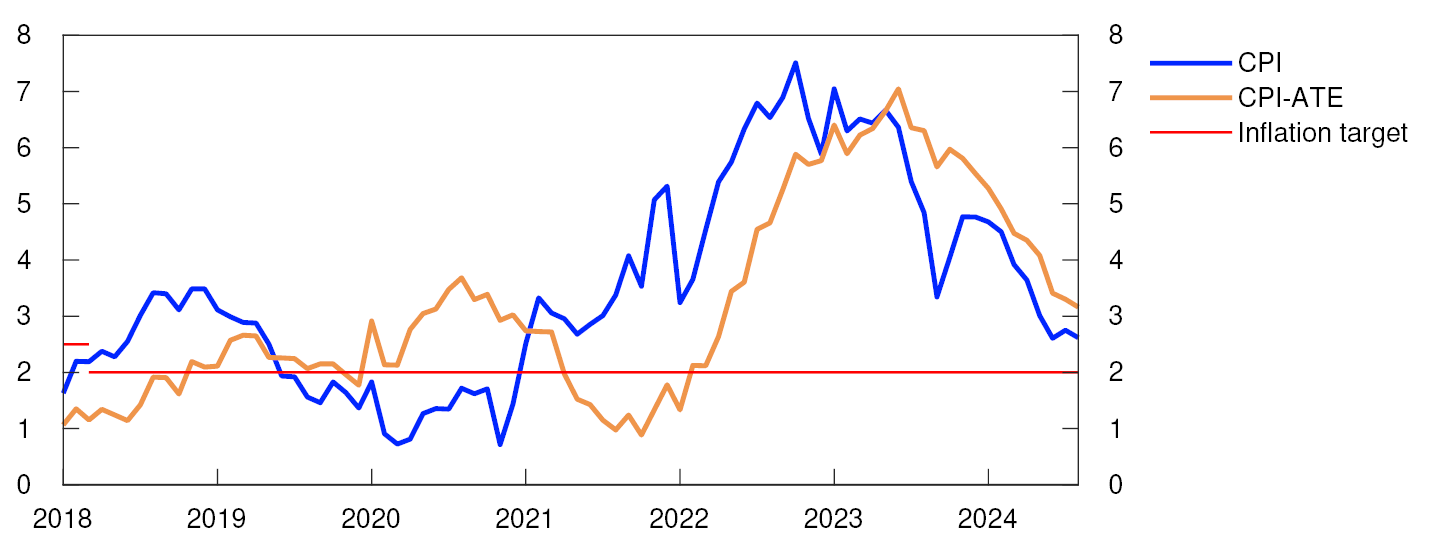
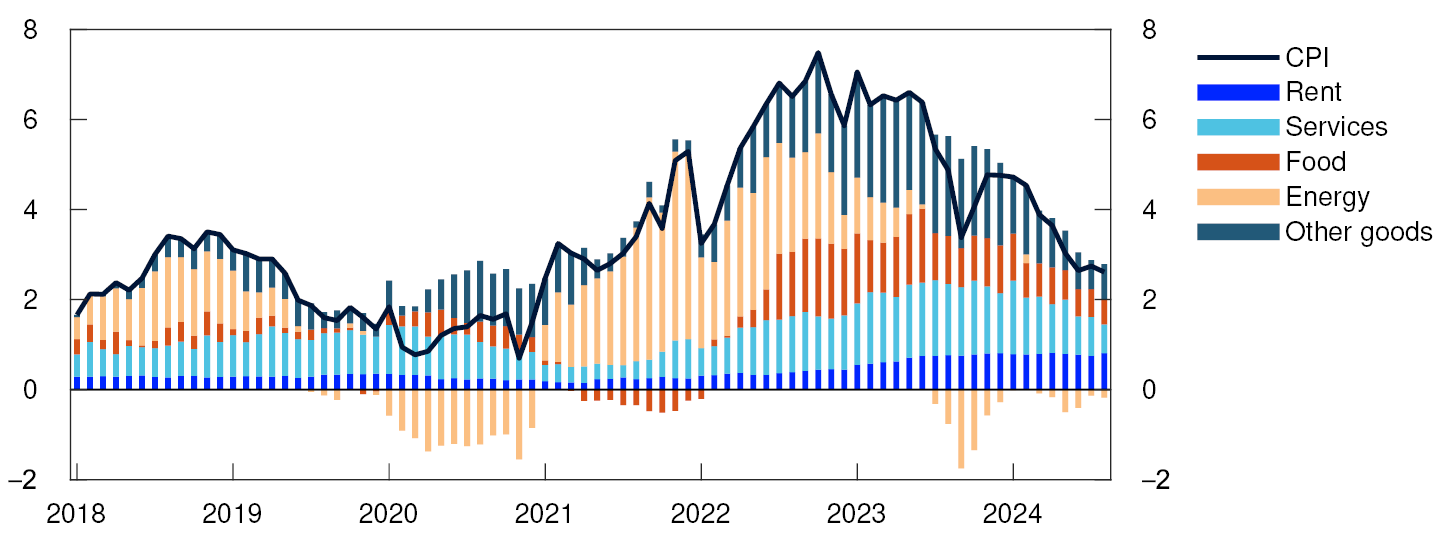
Inflation has fallen further since the June Report and has been lower than expected. In recent months, inflation has been pushed down by a fall in energy prices. In August, the 12-month rise in consumer price index (CPI) moved down to 2.6%, while CPI inflation adjusted for tax changes and excluding energy products (CPI-ATE) slowed to 3.2%. The average of other underlying inflation indicators has also decreased. Reduced child daycare prices dampened inflation in August and will continue to restrain the 12-month rise in consumer prices over the next year. In the near term, low energy prices will dampen inflation.
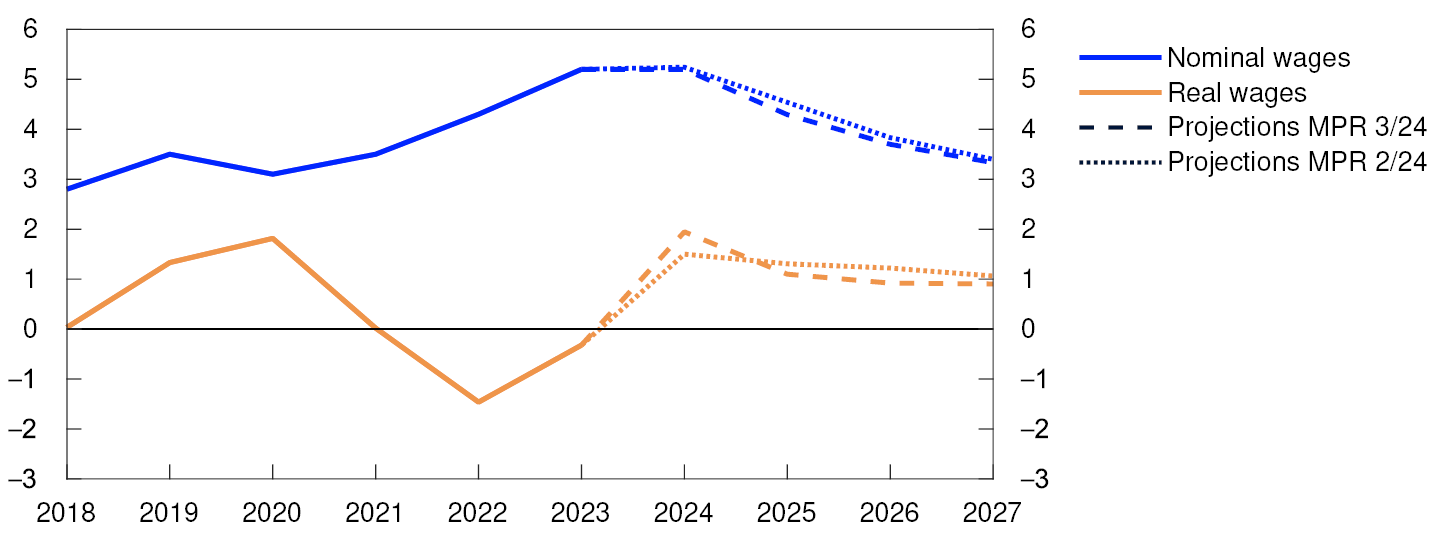
High wage growth and weak productivity growth will contribute to keeping growth in business costs at a high level ahead. Wage growth is projected at 5.2% in 2024, as in the June Report. Wage growth is expected to moderate next year, as indicated by Norges Bank’s Regional Network and Expectations Survey. The social partners have lowered their wage expectations for 2025 since June.
According to the Expectations Survey, long-term inflation expectations fell slightly in Q3 but are still somewhat higher than the 2% inflation target.
CPI and CPI-ATE. Twelve-month change. Percent
Policy rate unchanged at 4.5%
The operational target of monetary policy is annual consumer price inflation of close to 2% over time. Inflation targeting shall be forward-looking and flexible so that it can contribute to high and stable output and employment and to countering the build-up of financial imbalances.
In recent years, the policy rate has been raised significantly to tackle high inflation. Since December 2023, the policy rate has been held at 4.5%. The interest rate has contributed to cooling down the Norwegian economy and to dampening inflation. Unemployment has edged up from a low level. Inflation has declined markedly from its peak, but underlying inflation has not declined to the same extent. Moreover, the rapid rise in business costs and the krone depreciation are expected to restrain further disinflation.
Since the June Report, inflation has been lower than expected. International policy rates appear to be coming down faster. On the other hand, the krone has depreciated. Developments in the Norwegian labour market have been broadly in line with the projections in the June Report.
The Committee judges that a restrictive monetary policy is still needed to bring inflation down to target within a reasonable time horizon. The Committee is concerned with the possibility that if the policy rate is lowered prematurely, inflation could remain above target for too long. On the other hand, an overly tight monetary policy could contract the economy more than needed. In assessing the trade-offs between these considerations, the Committee concluded that it is appropriate to keep the policy rate at today’s level for a period ahead but that the time to ease monetary policy is approaching.
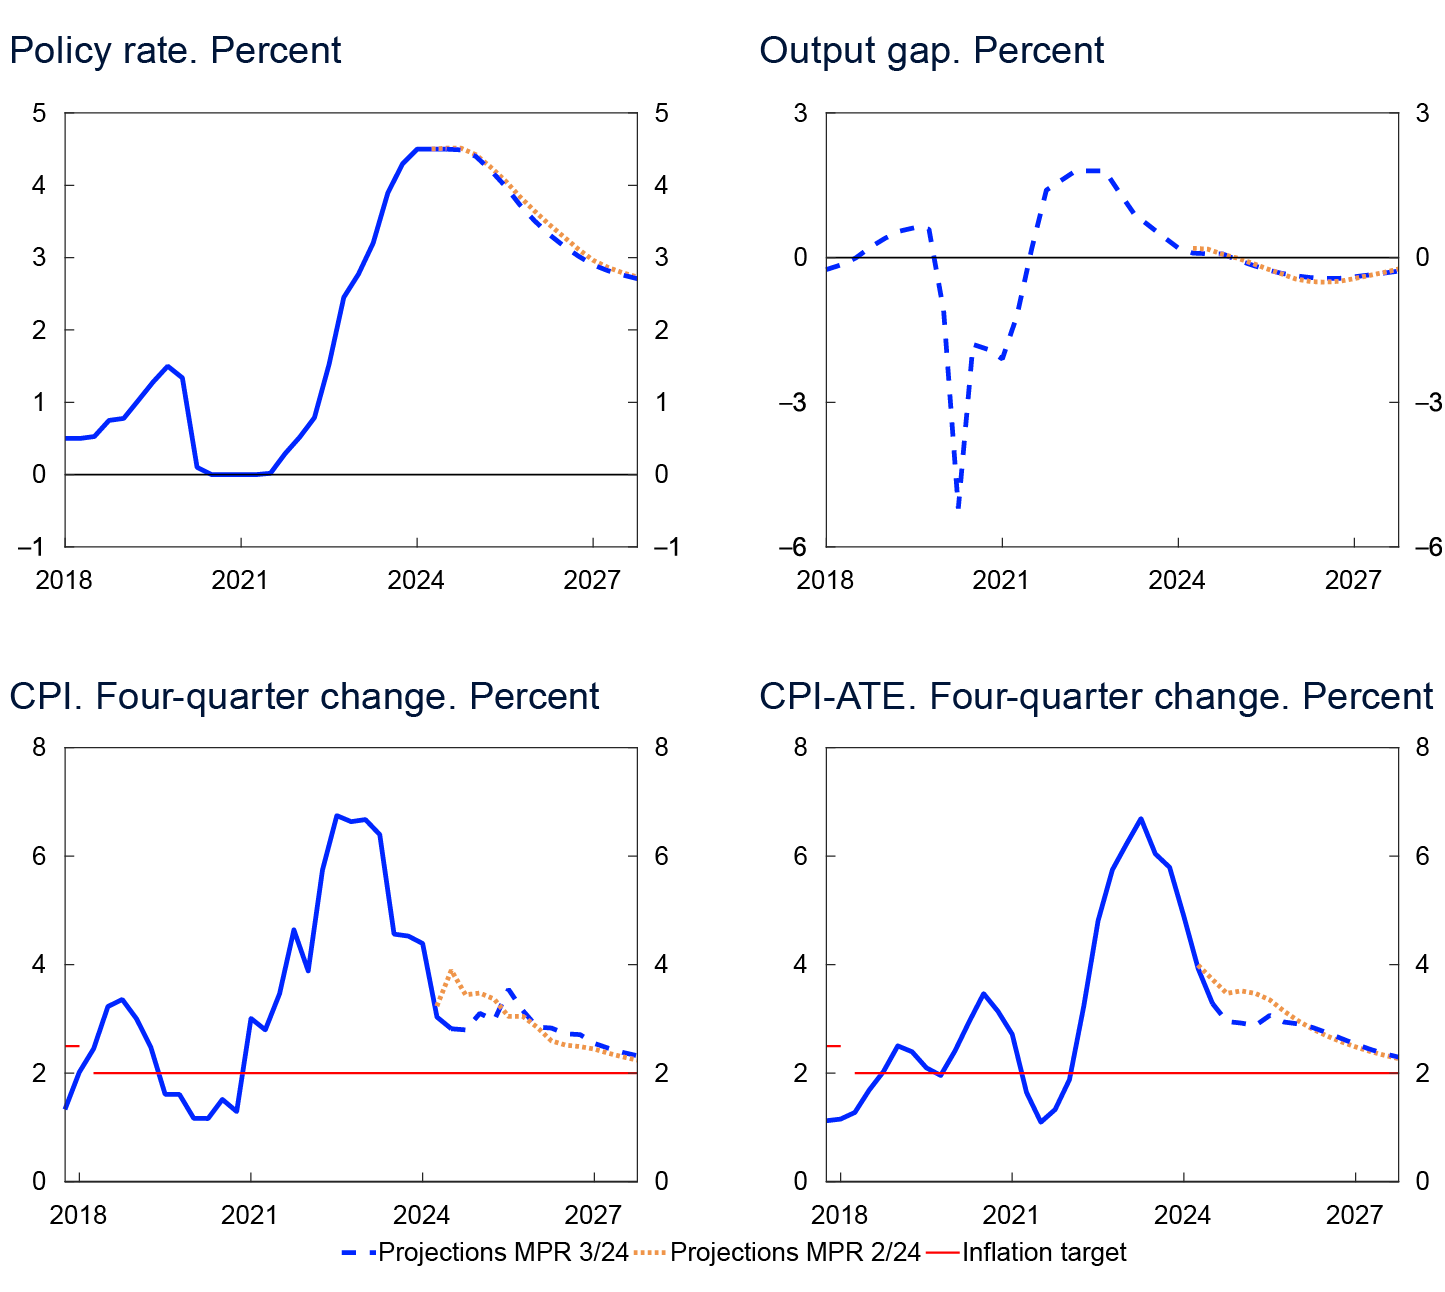
The policy rate forecast in this Report implies that the policy rate will remain at 4.5% to the end of 2024 before being gradually reduced from 2025 Q1. The forecast is little changed from the June Report but indicates a slightly faster decline in the policy rate through 2025. Economic growth is set to pick up slightly in the years ahead. Unemployment will likely edge up. Inflation is projected to approach 2% towards the end of 2027.
There is uncertainty about future developments in the Norwegian economy. In its discussion, the Committee noted in particular that inflation has fallen markedly and been lower than projected for a time. Underlying inflationary pressures may be weaker than currently assumed. If prospects suggest that inflation will return to target faster or there is a more pronounced slowdown in the Norwegian economy, the policy rate may be lowered faster than currently envisaged. On the other hand, the krone has depreciated again. If the krone depreciates further or capacity utilisation increases, wage and price inflation could remain elevated for longer. A higher policy rate than currently envisaged may then be required.
The Committee unanimously decided to keep the policy rate unchanged at 4.5%. Based on the Committee’s current assessment of the outlook, the policy rate will most likely be kept at that level to the end of 2024.
- 1 Period: January 2018 – August 2024.
- 2 Period: 1 January 2020 – 17 September 2024. A higher I-44 index indicates a weaker krone exchange rate. The scales are inverted.
- 3 Period: January 2022 – June 2024.
- 4 Period: January 2018 – August 2024. CPI-ATE: CPI adjusted for tax changes and excluding energy products.
- 5 Period: 2018 Q1 – 2027 Q4. Projections from 2024 Q2 for MPR 2/24 and 2024 Q3 for MPR 3/24 for the policy rate, the CPI and the CPI-ATE. The output gap measures the percentage deviation between mainland GDP and estimated potential mainland GDP. CPI-ATE: the CPI adjusted for tax changes and excluding energy products.
Ida Wolden Bache
Pål Longva
Øystein Børsum
Ingvild Almås
Steinar Holden
18 September 2024
1. The global economy
International consumer price inflation has slowed markedly and is approaching the inflation targets of several of Norway’s trading partners. Unemployment has risen, and wage growth is on the decline in a number of countries. Underlying inflation is projected to slow further. Market participants expect central banks abroad to reduce policy rates at a faster pace and more than anticipated in June.
Core inflation expected to decline
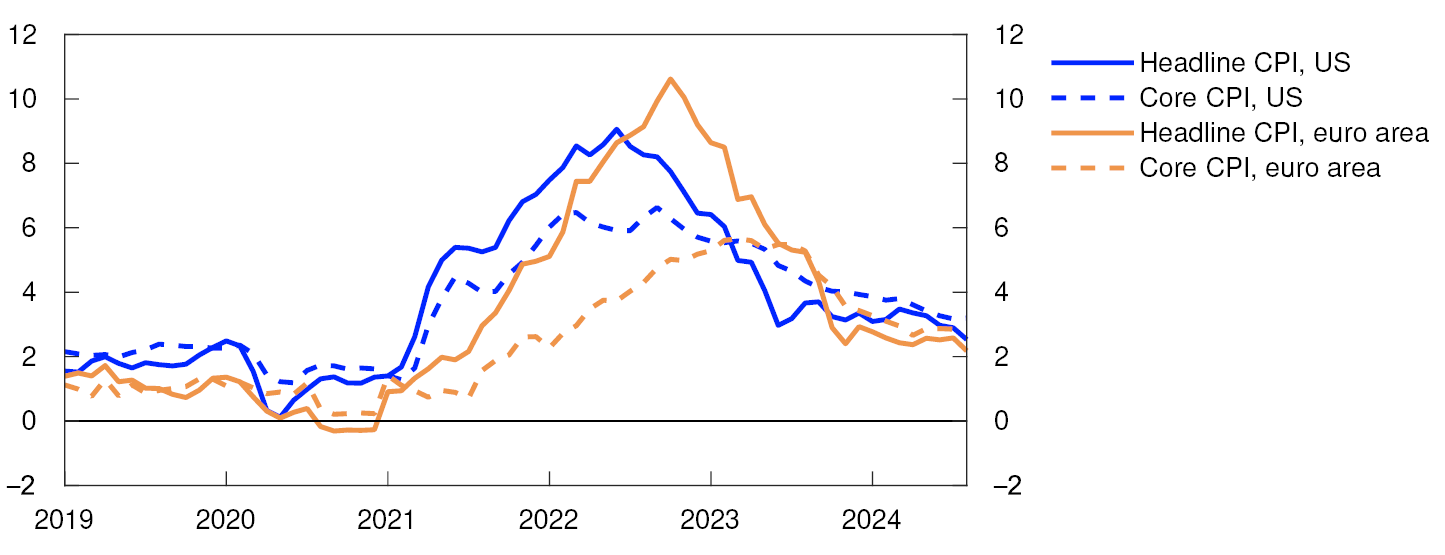
Headline inflation is approaching the target for the euro area, while core inflation remains slightly below 3% (Chart 1.1). In Sweden, inflation has fallen considerably since the June 2024 Monetary Policy Report and core inflation is close to 2%.
Consumer prices. Twelve-month change. Percent
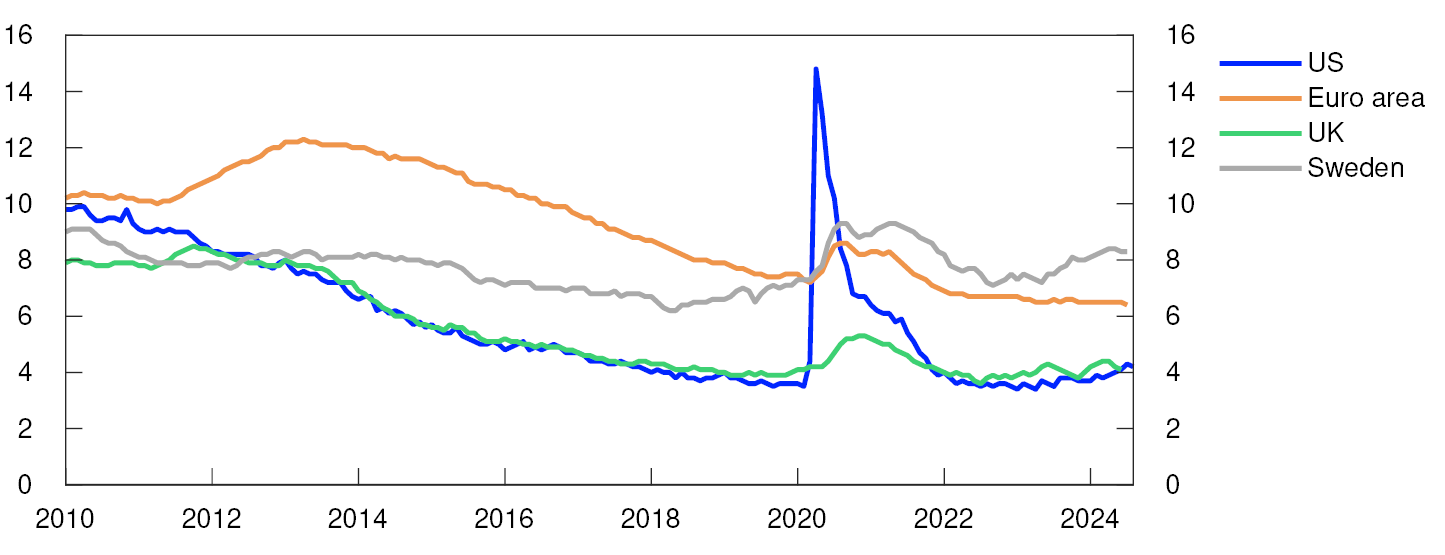
Services inflation remains high in both the US and Europe, likely reflecting tight labour markets and high wage growth in a number of the countries. In the US, the rise in rents is also pushing up services inflation. US unemployment is now higher than pre-pandemic levels after having risen in recent months (Chart 1.2). Unemployment has also risen in Sweden. Among most trading partners, wage growth is expected to decline between 2023 and 2024 (Chart 1.3).
Unemployed as a share of the labour force. Percent
Compensation per employee. Annual change. Percent
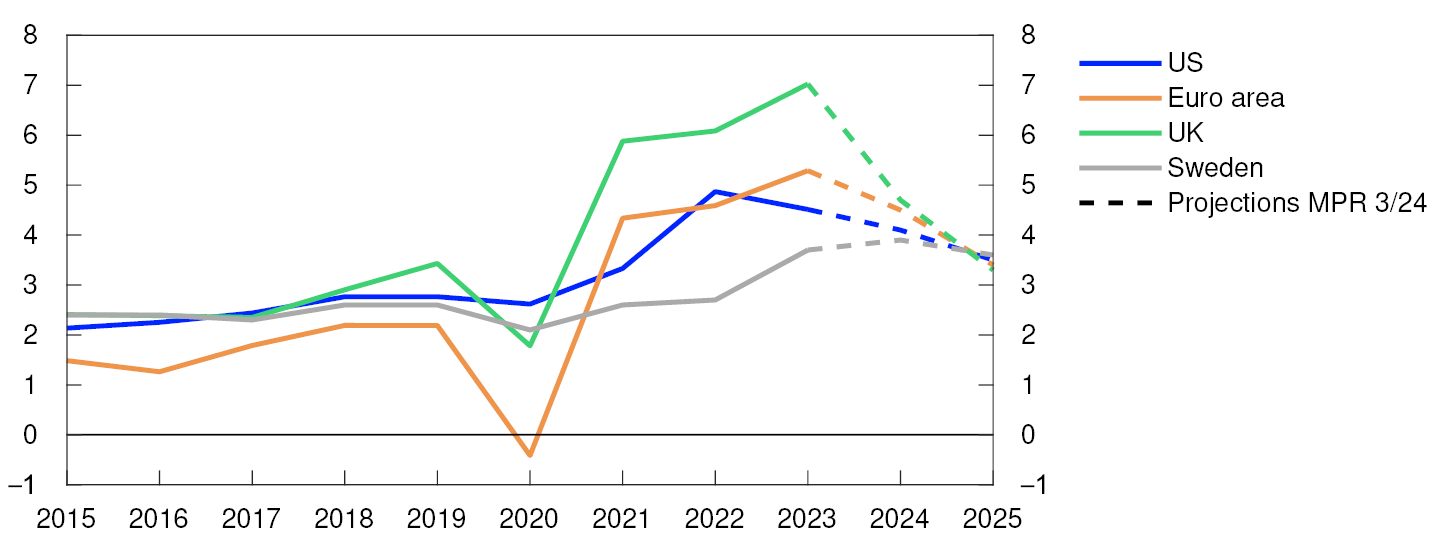
Since June, both short-term and long-term market-based inflation expectations for the US and the euro area have fallen and are close to the inflation targets. Core inflation among Norway’s four main trading partners as a whole is projected to slow from 5.3% in 2023 to 3% in 2024 and to slightly above 2% in 2025. The projections for wage growth and price inflation are little changed since the June Report (see Annex Table 1).
Lower policy rate expectations
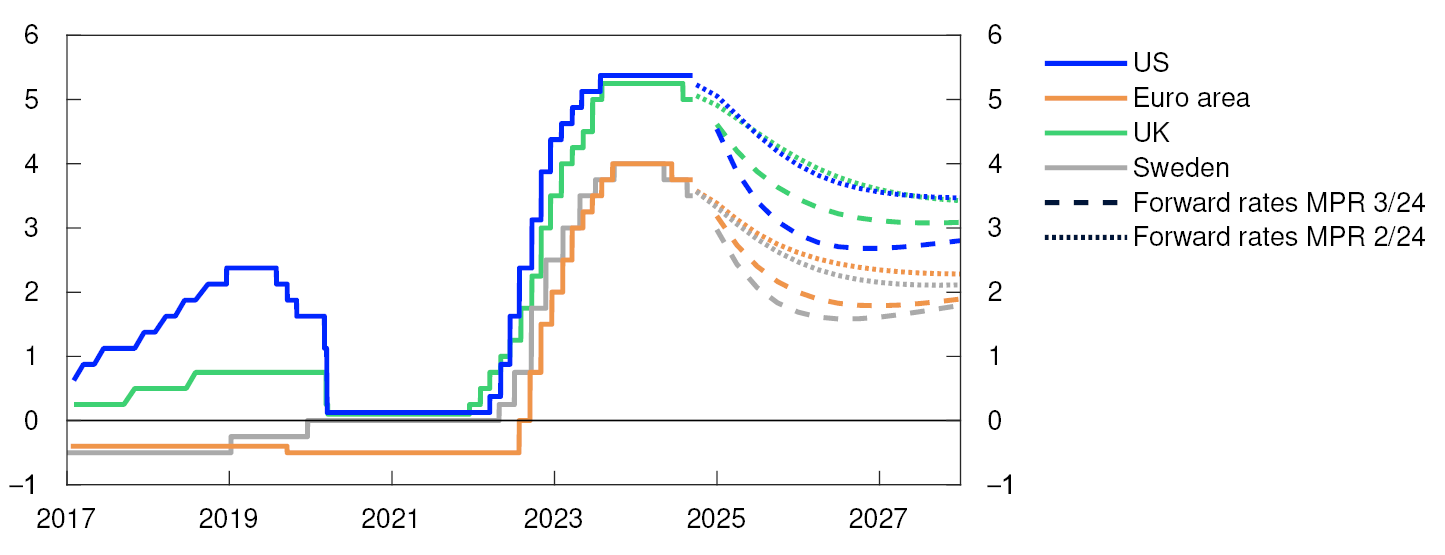
The European Central Bank (ECB), the Bank of England and Sveriges Riksbank have lowered policy rates since the June Report. The Federal Reserve has signalled a policy rate cut at the Federal Open Market Committee meeting in September. Market participants expect central banks abroad to reduce policy rates at a faster pace and more than they anticipated in June (Chart 1.4).
Policy rates and estimated forward rates. Percent
The market turbulence at the beginning of August led to an abrupt fall in equity prices, but the movements were quickly reversed. On the whole, US and European equity indexes are little changed since the June Report. Corporate bond risk premiums have also shown little change since June.
International growth expected to pick up
High inflation and rapid policy rate hikes dampened economic activity through 2024. Total output among main trading partners appears to be below potential. Trading partner GDP growth fell slightly between 2024 Q1 and Q2. On the whole, growth has been broadly as projected in the June Report.
In Sweden, economic activity fell between 2024 Q1 and Q2. Lower consumer price inflation and policy rate cuts will gradually improve the purchasing power of Swedish households. GDP growth in Sweden is expected to pick up towards the end of 2024. Looking ahead, improved household purchasing power is also expected to lift economic activity in the rest of Europe. Higher defence spending and energy investment are also likely to boost GDP growth in the years ahead.
US unemployment has increased in recent months, but other labour market indicators still point to relatively high labour demand. Strong growth in household consumption has sustained GDP growth. Household saving is expected to pick up further out. This will likely have a dampening effect on GDP growth ahead.
So far in 2024, GDP growth in China has remained moderate and growth in both private investment and consumption has been low. GDP growth will likely slow ahead on the back of a contracting labour force and high debt levels facing the local government sector and state-owned firms. The decision of US and European authorities to impose increased import tariffs on Chinese goods will likely also dampen activity growth.
Trading partner GDP growth is projected to pick up gradually through the projection period. The projections are little changed from the June Report. For trading partners as a whole, the output gap will likely remain slightly negative in the coming years.
Uncertainty surrounding economic developments
To bring services inflation down to a level that is consistent with 2% consumer price inflation, central banks may have to keep policy rates elevated for longer than currently assumed, which could weaken growth prospects. On the other hand, inflation has fallen substantially in many countries in recent years. If consumer price inflation falls faster than expected and policy rates are reduced faster than assumed, economic activity abroad could pick up more than projected. Heightened trade conflicts and the climate and energy transition also add to inflation uncertainty. The ongoing wars in some countries also add to uncertainty about international developments ahead.
Lower energy prices in Norway
Energy prices have fallen substantially since the peak in 2022. Since the June Report, both oil prices and electricity prices in Norway have fallen further. The rise in Norges Bank’s price indexes for imported intermediate and consumer goods remains muted.
Oil prices have decreased since June, reflecting higher growth in non-OPEC oil production and lower growth in global oil consumption. Futures prices indicate a further decline (Table 1.A). For the time being, OPEC+ has extended the production cuts that have underpinned oil prices in recent years.1 Ample spare production capacity and a low market share may nevertheless make it difficult to maintain the cuts ahead,2 while an escalated regional conflict in the Middle East or a loss of oil production elsewhere may result in a rise in oil prices.
Table 1.A Commodity prices
|
Percentage change from projections in Monetary Policy Report 2/2024 in brackets |
Average price (2010–2019) |
Realised prices and futures prices3 |
|||||
|---|---|---|---|---|---|---|---|
|
2022 |
2023 |
2024 |
2025 |
2026 |
2027 |
||
|
Oil, USD/barrel |
80 |
101 |
83 |
80 (-3) |
70 (-10) |
69 (-7) |
69 (-5) |
|
Dutch gas, EUR/MWh |
20 |
124 |
41 |
33 (-2) |
37 (-1) |
33 (1) |
28 (-3) |
|
Coal, EUR/tonne |
66 |
290 |
118 |
102 (-3) |
105 (-7) |
107 (-7) |
107 (-6) |
|
Carbon allowance prices, EUR/tonne |
10 |
81 |
84 |
65 (-1) |
66 (-5) |
69 (-6) |
71 (-6) |
|
German electricity, EUR/MWh |
42 |
256 |
102 |
79 (-1) |
86 (-7) |
82 (-1) |
75 (2) |
|
Nordic electricity, øre/kWh |
32 |
142 |
66 |
44 (-14) |
46 (-13) |
48 (-4) |
49 (-1) |
|
Electricity in Southern Norway, øre/kWh |
31 |
206 |
84 |
53 (-14) |
57 (-12) |
59 (-4) |
61 (-1) |
|
Electricity in Northern Norway and Central Norway, øre/kWh |
32 |
38 |
43 |
34 (-12) |
31 (-12) |
35 (-6) |
39 (4) |
|
Aluminium, USD/tonne |
1945 |
2704 |
2255 |
2388 (-2) |
2535 (-3) |
2618 (-2) |
2675 (-1) |
|
Copper, USD/tonne |
6761 |
8823 |
8486 |
9144 (-3) |
9448 (-4) |
9557 (-3) |
9578 (-2) |
|
Steel, USD/tonne |
463 |
721 |
621 |
584 (-1) |
589 (-1) |
- |
- |
|
Wheat, USD/tonne |
210 |
331 |
238 |
213 (-5) |
231 (-7) |
241 (-3) |
- |
|
Maize, USD/tonne |
183 |
271 |
221 |
167 (-5) |
174 (-9) |
181 (-5) |
181 (-3) |
European gas prices are little changed since the June Report. European gas inventories are high and developments in gas consumption are weak. At the same time, prices for imported liquid natural gas (LNG) to Europe have remained elevated. LNG prices may reflect the limited near-term growth in global LNG supply.
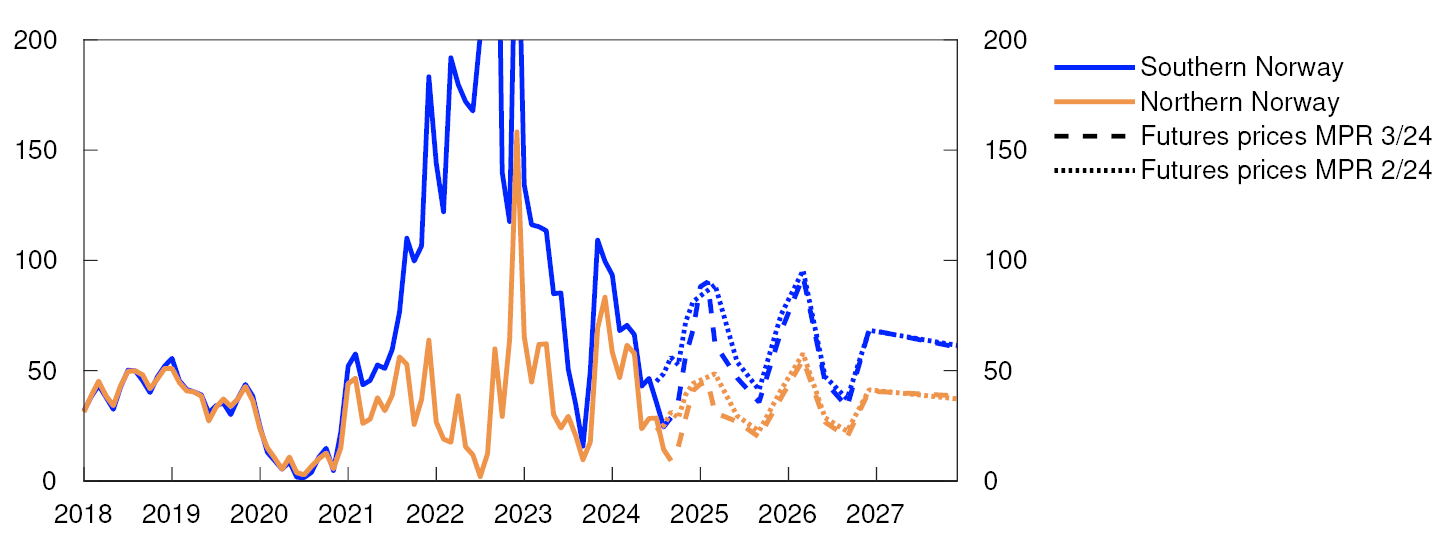
Electricity prices in Germany have shown little change since June. Futures prices have fallen somewhat, reflecting developments in futures prices for gas, coal and emission allowances. In Norway, electricity prices have fallen markedly owing to considerable precipitation and wind. Futures prices for 2025 have also fallen but they are little changed for 2026 and 2027. Futures prices for the coming years still indicate higher prices than in 2024 (Chart 1.A).
Øre/kWh
Metal prices are somewhat lower than in the June Report. This may reflect weaker economic growth in China, particularly related to the real estate sector. Futures prices indicate a modest rise in the coming years. An increased need for metals for the climate and energy transition may underpin metal prices.
Since the June Report, the rise in Norges Bank’s indicator of international price impulses to imported intermediate goods (IPI) has been slightly lower than expected (Chart 1.B). Together with somewhat lower metals futures prices, the projections for further IPI growth are slightly lower than in the June Report.
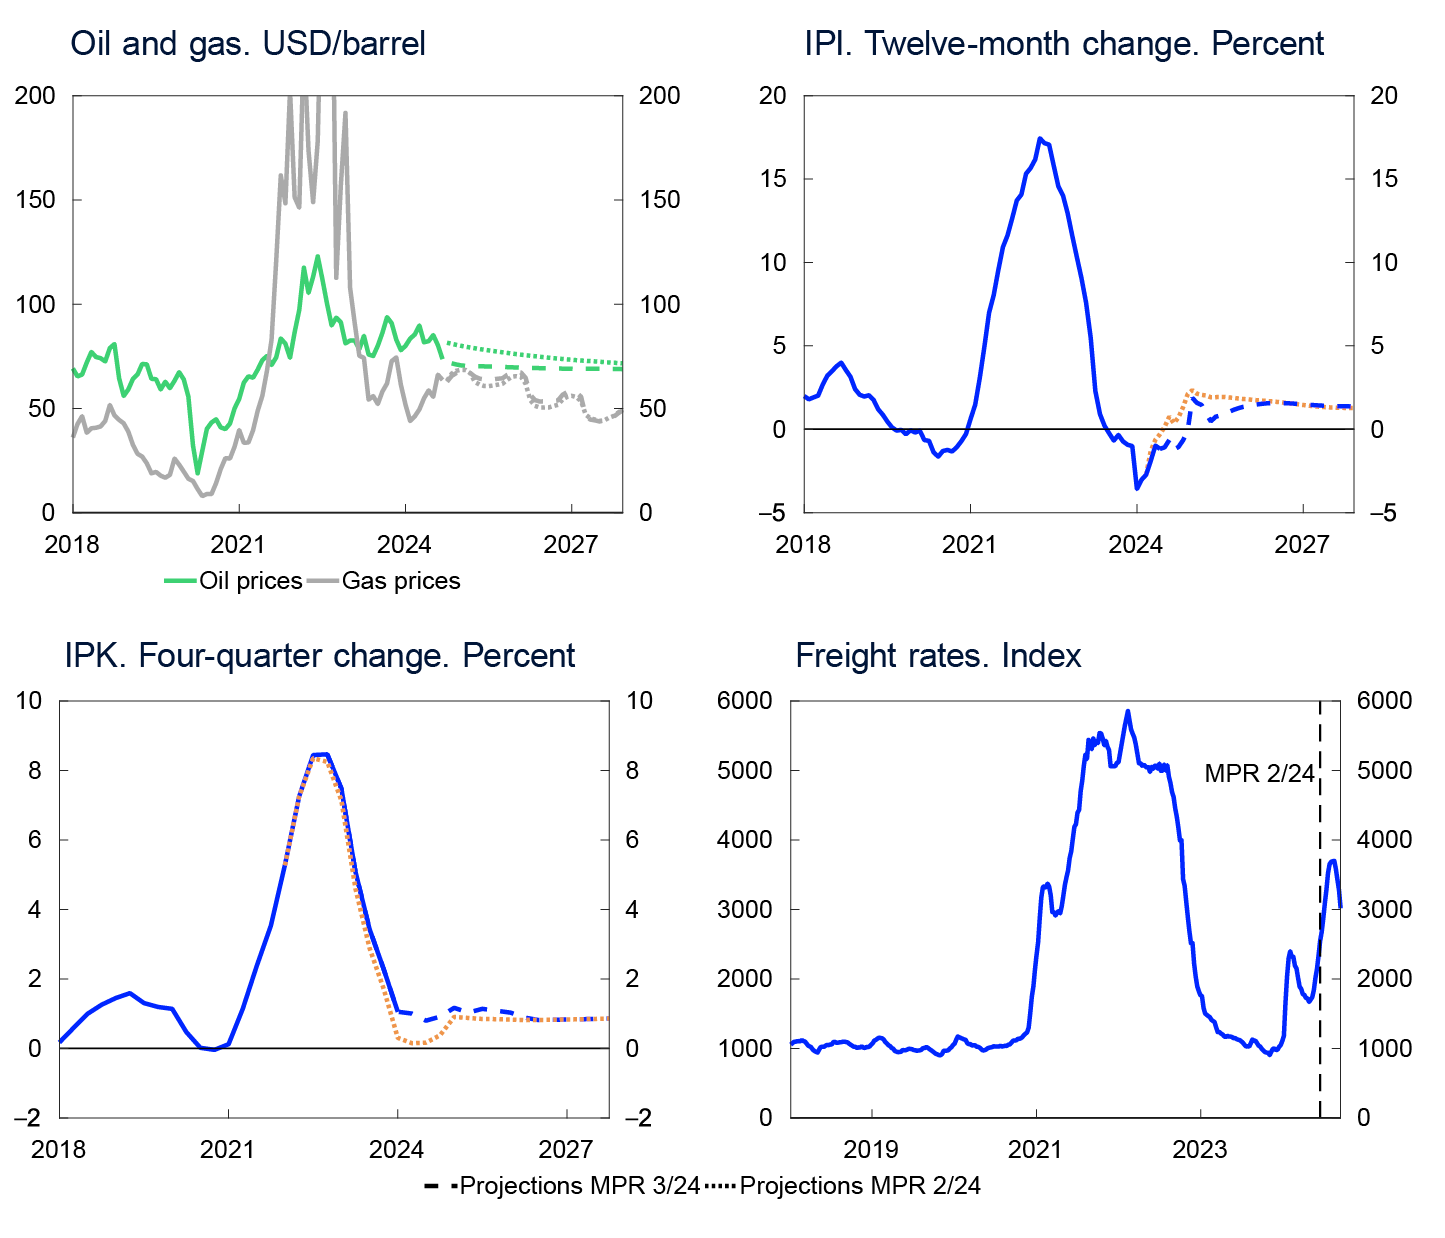
The rise in the index of international price impulses for imported consumer goods (IPK) has been higher than expected in the June Report (Chart 1.B). Updated import weights indicate that the shift from high-cost to low-cost countries has had less of a disinflationary effect than previously projected. Moreover, compositional effects are now also expected to be less pronounced ahead. On the other hand, lower food prices (Table 1.A) may contribute to a lower rise in the IPK further out. Compared with the June Report, inflationary impulses from imported consumer goods are now expected to be slightly higher in the years ahead.
Freight rates are higher than they were at the time of the June Report, primarily reflecting tensions in the Red Sea, low water levels in the Panama Canal and strong demand for container shipping. Freight rates have fallen in recent weeks. Supply disturbances in shipping are assumed to be transitory, but it will take longer than assumed in June for rates to move down again.
- 1 OPEC+ consists of 12 OPEC countries and 10 non-OPEC countries, see OPEC: Member countries and “What is OPEC+ and how is it different from OPEC” (US Energy Information Administration (EIA)).
- 3 Futures prices at 13 September 2024.
Sources: LSEG Datastream and Norges Bank
- 4 Period: January 2018 – December 2027. Futures prices at 14 June 2024 for MPR 2/24 and at 13 September 2024 for MPR 3/24.
- 5 Period: January 2018 – December 2027. For oil and gas prices, projections for MPR 3/24 and MPR 2/24 are futures prices. International price impulses to imported intermediate goods (the IPI). External price impulses to imported consumer goods (the IPK). All series are measured in international currency terms.
- 1 Period: January 2019 – August 2024. Core CPI is consumer prices excluding energy and food in the US and consumer prices excluding energy, food, tobacco and alcohol in the euro area.
- 2 Period: January 2010 – August 2024. Data up to July for the euro area and Sweden and up to June for the UK. Three-month moving average for Sweden. Seasonally adjusted figures.
- 3 Period: 2015–2025. Projections for 2024 and 2025.
- 4 Period: 1 January 2017 – 31 December 2027. Daily figures through 13 September 2024. Quarterly figures from 2024 Q3 for MPR 2/24 and 2024 Q4 for MPR 3/24. Estimated forward rates at 14 June for MPR 2/24 and at 13 September for MPR 3/24. For the euro area, ECB’s deposit facility rate is shown.
2. Financial conditions
The policy rate has been kept unchanged at 4.5% since the June Report. Market pricing indicates expectations of a faster fall in the policy rate than projected in this Report. Residential mortgage rates have shown little change since the June Report and are expected to decline from next year. The krone has depreciated and is projected to be somewhat weaker ahead than in the June Report.
The market expects a faster reduction in the policy rate
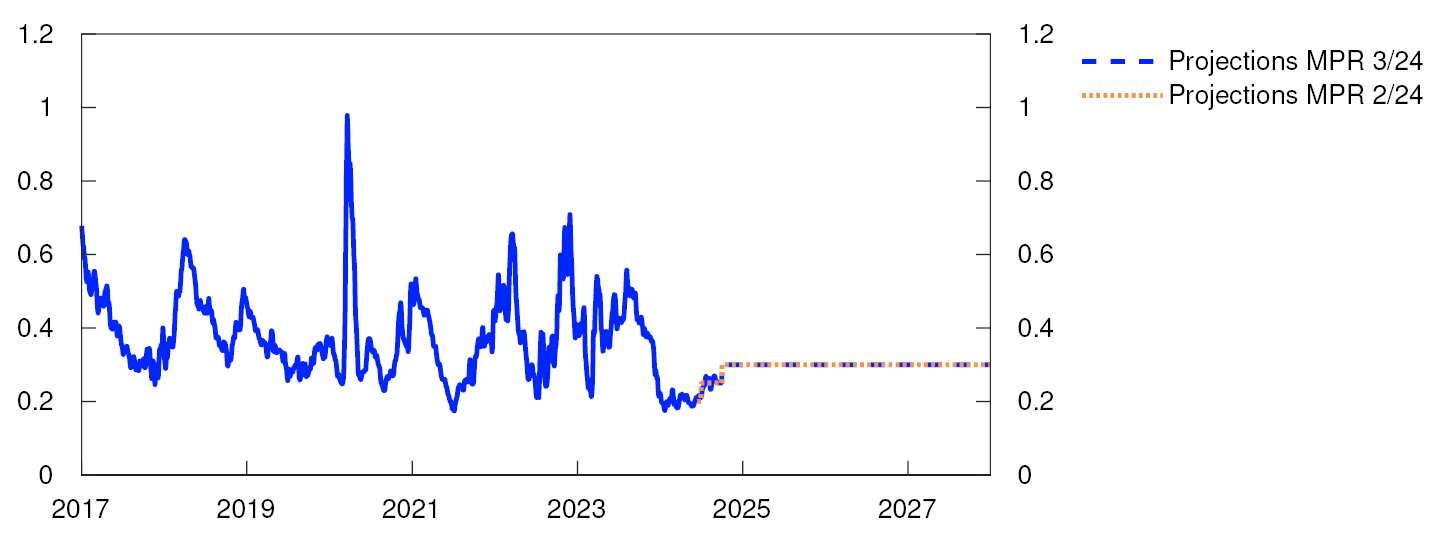
Market policy rate expectations increased slightly after the monetary policy meeting in June, but they have since decreased amid a marked fall in policy rate expectations among our trading partners and lower inflation data for Norway. Market pricing now indicates expectations of a rate cut of 0.25 percentage point in December, and a further 1.5 percentage points in total through next year (Chart 4.2 in Section 4). This is a faster reduction in the policy rate than the forecast in this Report. Towards the end of the projection period, market interest rate expectations are broadly consistent with the rate forecast in this Report.
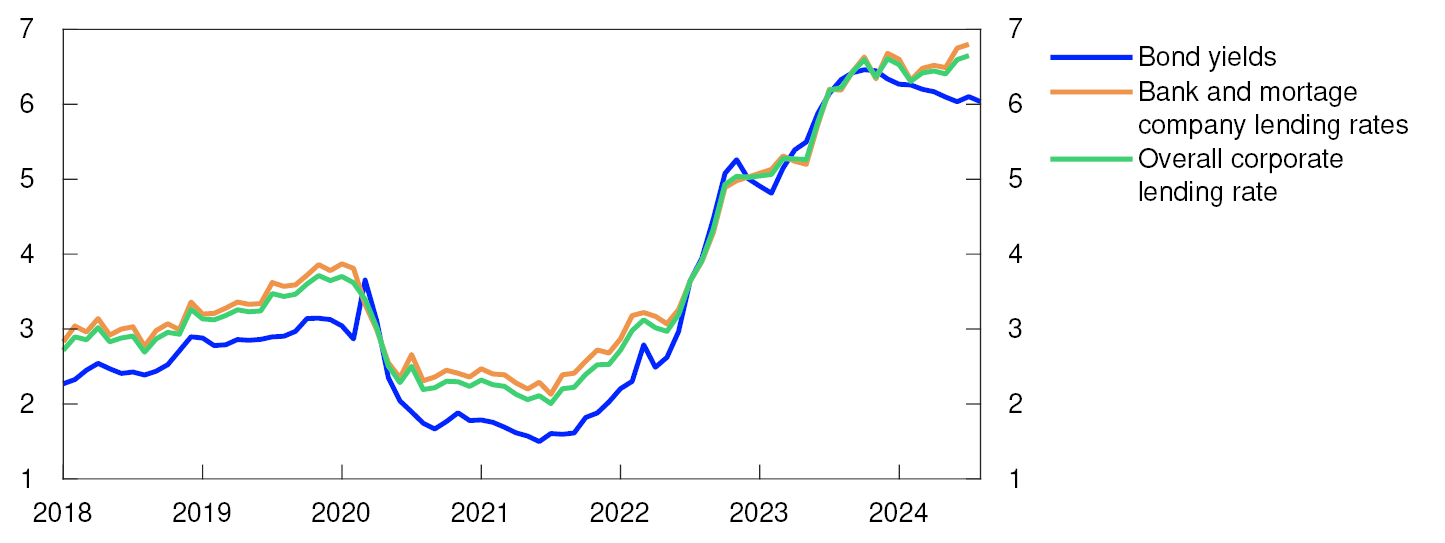
Residential mortgage rates are little changed
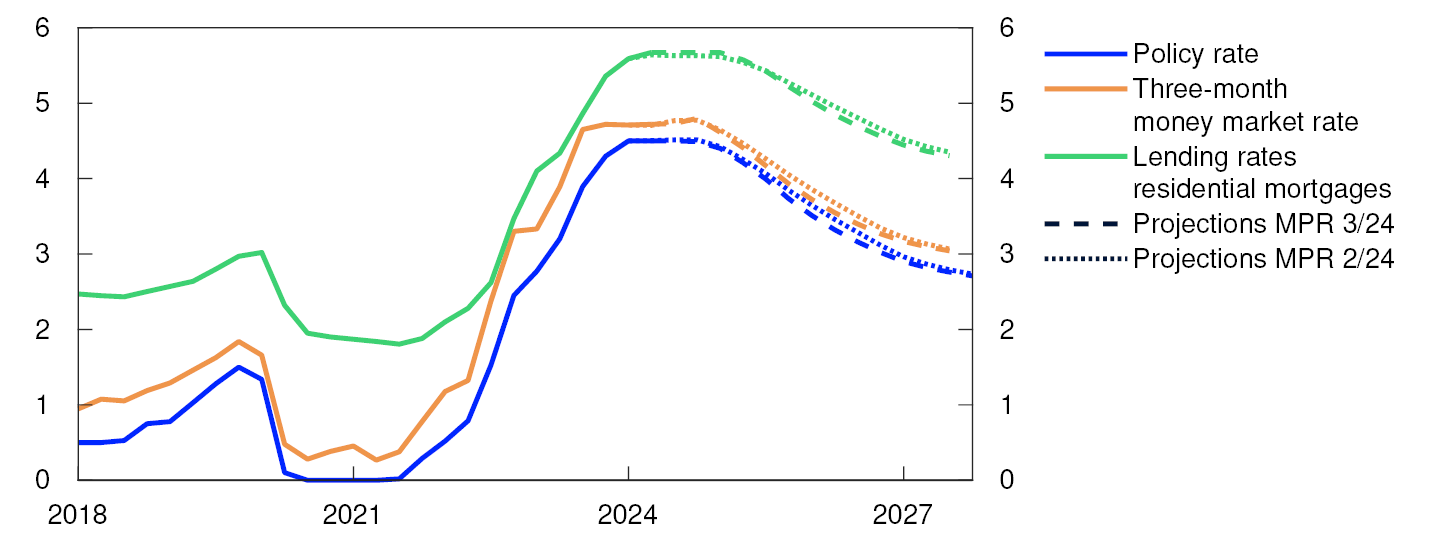
The average interest rate on outstanding floating and fixed-rate residential mortgages was 5.7% at end-July, broadly in line with the projections in the June Report. Overall, residential mortgage rates have largely followed the rise in the policy rate since autumn 2021 (Chart 2.1). For floating rate mortgages, pass-through has been 90%, although it fell somewhat towards the end of the interest rate rise. Bank profits are still high and loan losses low, and banks are able to compete on price in order to retain or gain market share. Residential mortgage rates are expected to remain approximately unchanged until the end of the year before gradually declining with a reduction in the policy rate.
Interest rates. Percent
The average interest rate on households’ floating and fixed-rate bank deposits was 3.1% at the end of July, unchanged from three months earlier. Since the rise in interest rates began in autumn 2021, deposit rates have risen markedly less than residential mortgage rates, partly reflecting banks’ high deposit-to-loan ratios, which may have contributed to weaker competition for deposits than for lending. From next year, deposit rates are expected to decline somewhat less than both the policy rate and the residential mortgage rate, suggesting that banks’ interest margins will fall towards a more normal level.
Corporate lending rates have risen slightly
The interest rate on new floating-rate corporate loans was 6.7% in July, measured as a weighted average of bank and bond debt. This was somewhat higher than at the time of the previous Report (Chart 2.2).
Interest rate on new floating-rate NOK finance for non-financial corporates. Percent
The interest rate on corporate bank loans is based on three-month Nibor, which is approximately unchanged since the June Report. The expected policy rate over the next three months has fallen somewhat, but this has been offset by a comparable increase in the Nibor risk premium. The risk premium is now around 0.25 percentage point, consistent with the projection in the June Report (Chart 2.3). The risk premium is put at 0.3 percentage point from Q4 to the end of the projection horizon.
Money market premium. Percentage points
The margin above Nibor paid by corporations for new bank loans increased somewhat from April to July and led to somewhat higher interest rates on new corporate bank loans. In Norges Bank’s most recent lending survey, banks expected lending margins to be approximately unchanged in Q3 and loan demand to remain broadly unchanged.
Large corporations often combine bank loans with bond issues. In the corporate bond market, risk premiums have fallen slightly since the June Report. Issue activity in this market is high, as it was before summer. Long-term fixed-rate corporate bonds are based on swap rates with a corresponding maturity. Long-term swap rates have fallen somewhat since the June Report, lowering the costs for such loans.
The equity market is also a source of corporate financing. Since the June Report, the Oslo Børs Benchmark Index has increased by around 1%. Real estate, technology and manufacturing made the largest contribution to the increase, while energy and materials showed the weakest performance.
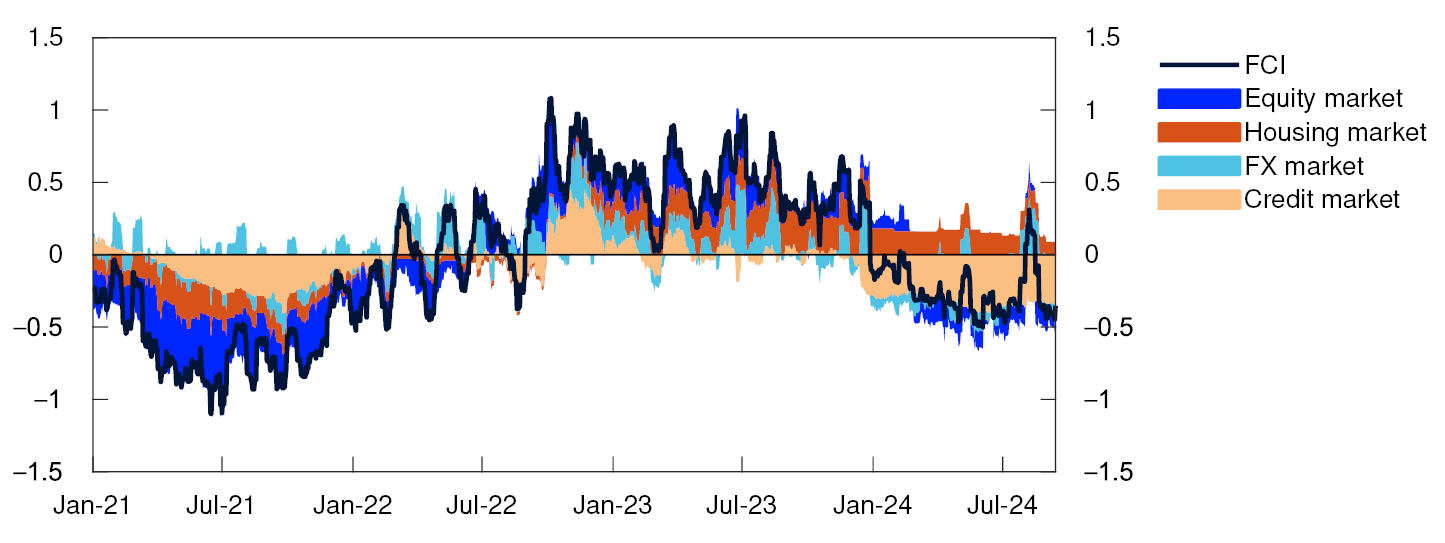
Amid market expectations of a faster fall in the policy rate, market interest rates have decreased, and financial conditions have loosened since the June Report. The Financial Conditions Index (FCI) summarises other financial conditions that affect households, banks and other firms (Chart 2.4). The market turbulence at the beginning of August resulted in slightly tighter financial conditions, but the turbulence subsided fairly quickly. The index now indicates that other financial conditions are slightly looser than they have been on average over the past 20 years, and broadly as at the time of the June Report.
Financial Conditions Index. Standard deviation from mean
Weaker krone exchange rate than projected
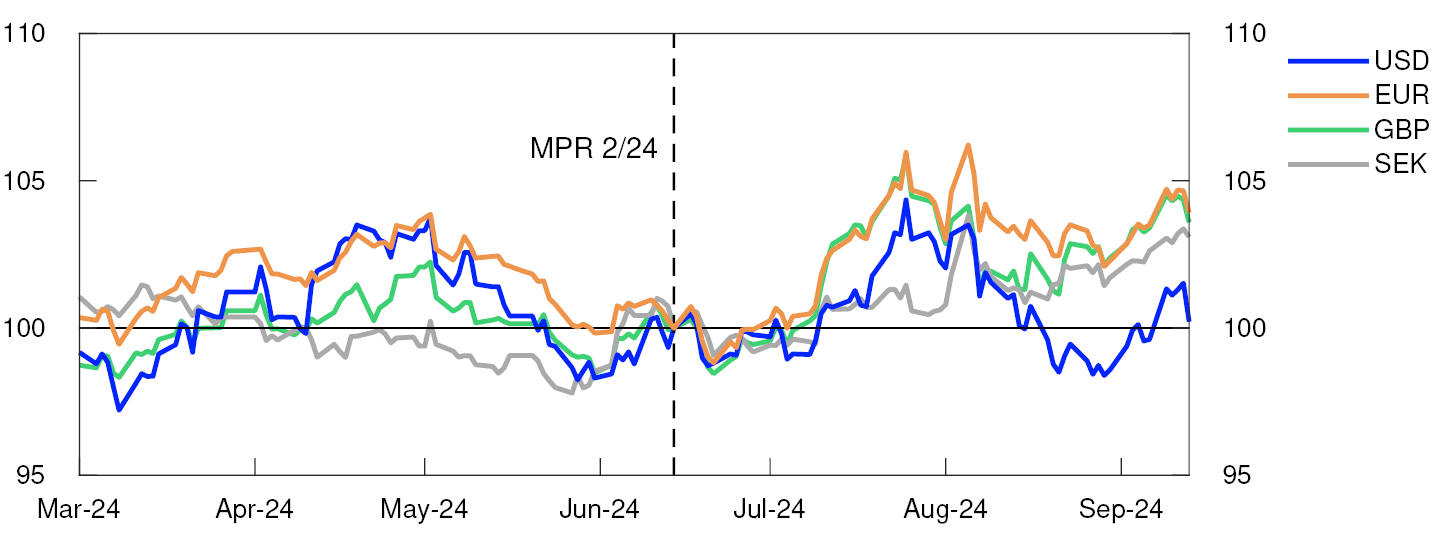
The krone depreciated against the currencies of Norway’s main trading partners this summer after inflation fell more in June than projected and amid the market turbulence at the beginning of August. Since then, the krone has fluctuated and may have been influenced by movements in international financial markets and petroleum prices. Overall, the krone is weaker than at the time of the June Report against the euro, pound sterling and Swedish krona, while it is little changed against the US dollar (Chart 2.5). Since June, interest rates abroad have fallen more than interest rates in Norway, so that the interest rate differential against trading partners has widened a little. On the other hand, oil prices have fallen by around 10%. Measured by the import-weighted exchange rate I-44, the krone has been about 3% weaker so far in Q3 than projected in the June Report.
Index. 14 June 2024 = 100
The krone is projected to appreciate slightly upon publication of this Report, given that the policy rate forecast herein is somewhat higher than market interest rate expectations. Thereafter, the krone exchange rate is expected to remain approximately unchanged throughout the projection period (Chart 2.6), implying a krone exchange rate that is around 3% weaker than projected in June. However, the real krone exchange rate, measured as domestic inflation relative to foreign inflation in a common currency, is projected to appreciate somewhat in the years ahead, as domestic inflation is projected to be somewhat higher than among Norway’s trading partners.
Import-weighted exchange rate index. I-44
- 1 Period: 2018 Q1 – 2027 Q4. Projections from 2024 Q2 for MPR 2/24 and from 2024 Q3 for MPR 3/24. The residential mortgage rate is the average rate on outstanding mortgage loans to households from the sample of banks and mortgage companies included in Statistics Norway’s monthly interest rate statistics.
- 2 Period: January 2018 – August 2024.
- 3 Period: 1 January 2017 – 31 December 2027. Five-day moving average. Latest observation on 13 September 2024. Projections from 2024 Q2 for MPR 2/24 and 2024 Q3 for MPR 3/24. The premium in the Norwegian money market rate is the difference between the three-month money market rate and the expected policy rate.
- 4 Period: 1 January 2021 – 13 September 2024. The Financial Conditions Index (FCI) provides an overall picture of the price and availability of different types of financing beyond that indicated by the policy rate and future policy rate expectations. The FCI provides an indication of how tight or how loose financial conditions are, compared with the average from 3 January 2003 – 13 September 2024. A higher index value indicates tighter financial conditions. For more on the Norwegian FCI, see Monetary Policy Report 4/2022 and Bowe, F., K.R. Gerdrup, N. Maffei-Faccioli and H. Olsen (2023): “A high-frequency financial conditions index for Norway”, Norges Bank Staff Memo 1/2023.
- 5 Period: 1 March 2024 – 13 September 2024. For all currencies in the chart, the exchange rate is against NOK. 14 June 2024 = 100. An increase in the series means that NOK has depreciated against the foreign currency.
- 6 Period: 2018 Q1 – 2027 Q4. Projections from 2024 Q2 for MPR 2/24 and 2024 Q3 for MPR 3/24. A higher index value for I-44 denotes a weaker krone exchange rate. Scales are inverted.
3. The Norwegian economy
Inflation has fallen substantially since end-2022 and has declined more than expected since the June 2024 Monetary Policy Report. Capacity utilisation appears to be close to a normal level. The employment to population ratio is high, but unemployment has edged up from a low level.
Capacity utilisation is projected to fall somewhat below a normal level in 2025. Unemployment will likely edge up to about its pre-pandemic level. The krone depreciation, combined with strong growth in labour costs, will likely slow further disinflation. Inflation is projected to approach the inflation target towards the end of 2027.
3.1 Output and demand
Low growth in the Norwegian economy
Growth in the Norwegian economy has been low since the beginning of 2023. Higher interest rates and high cost growth have weighed on both housing and business investment. Lower purchasing power has dampened consumption, while a weaker krone has lifted exports. At the same time, oil and gas investment has risen, and growth in public demand has been strong.
Economic growth remained sluggish in 2024 Q2 and slightly lower than projected in June. Overall, Norges Bank’s Regional Network contacts report somewhat higher activity in Q3, but growth appears to have been slightly lower than contacts envisaged before summer. There are wide differences across industries. Oil services contacts have revised up activity growth expectations in Q3, and services contacts report higher business and household demand. Manufacturing contacts expect weak growth in activity, while construction industry and retail trade contacts expect a decline. Overall, contacts expect activity growth to edge up through 2024 H2.
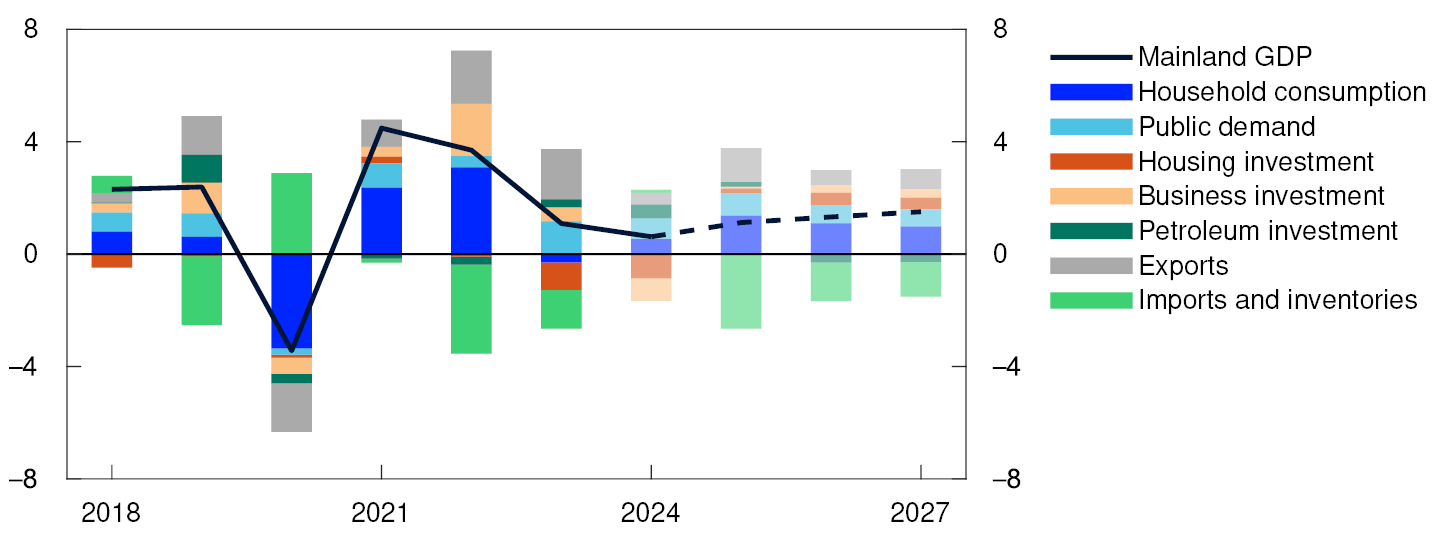
Activity is expected to pick up in 2024 H2, in line with the expectations of the Regional Network contacts and the SMART forecasts (see “SMART- System for model analysis in real time”). In 2024, mainland GDP is projected to increase by 0.6%, supported by an increase in household consumption, higher public demand and increased petroleum investment, while lower business and housing investment have a dampening effect (Chart 3.1). Further ahead, both business and housing investment are expected to pick up, while petroleum investment is expected to decline. Compared with the June Report, mainland GDP growth projections have been revised down slightly for 2024 and 2025 but are little changed for the years ahead.
GDP for mainland Norway. Annual change. Contribution to annual change. Percentage points
Increased purchasing power could boost consumption
In 2024 Q2, household consumption growth picked up following weak developments in Q1. Overall consumption has been as expected. Goods consumption rose more than expected in Q2 but fell in July. Goods consumption, particularly household car purchases, has varied considerably. New VAT rules for leased vehicles and a new EU directive that introduces stricter technical specification requirements for cars have contributed to abnormal car purchase patterns. This is assumed to normalise through autumn. Card transaction data indicate that the purchase of other goods has remained elevated through summer. Services consumption has been weaker in Q2 than projected in the June Report, but Regional Network contacts report higher household demand through summer and expect activity to increase further through autumn.
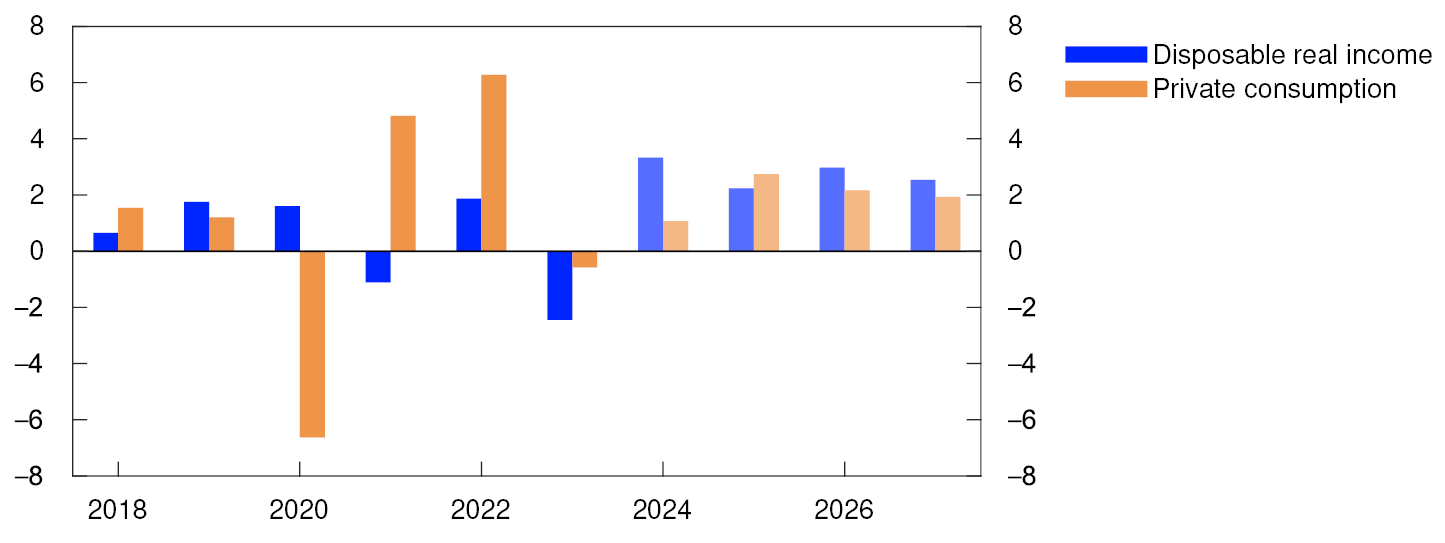
Real wage growth is expected to rise considerably in 2024. Together with increased employment, this will push up real household disposable income (Chart 3.2). The projection for 2024 has been revised up since the June Report. Higher purchasing power is expected to lift consumption. At the same time, the saving ratio has increased considerably from a low level, and household consumption is expected to increase less than household income in 2024. Compared with the June Report, the projection of household consumption is little changed, while the saving ratio is expected to be higher. Towards the end of the projection period, the saving ratio is expected to be close its pre-pandemic average.
Real disposable income and private consumption. Annual change. Percent
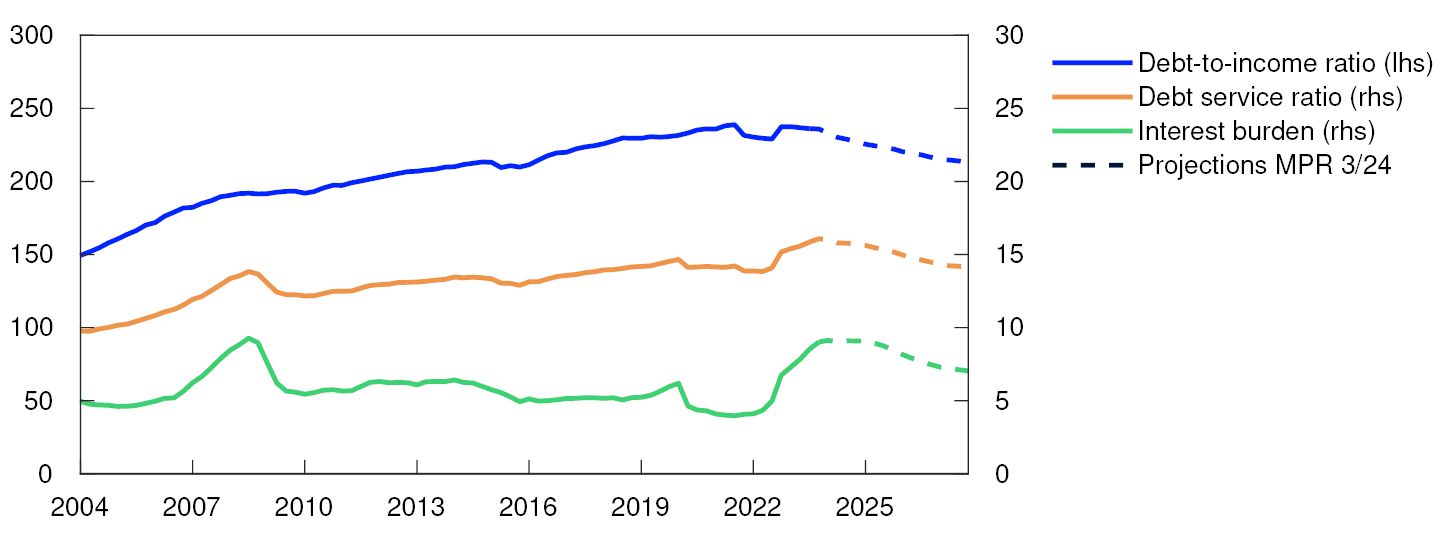
Household debt ratios are high. While slowing markedly through 2023, debt growth has increased somewhat so far this year, but is still low. The increase may reflect the rise in house price inflation and expectations that interest rates have peaked. Debt growth is assumed to remain low over the next few years, with income growth outpacing debt growth. This will reduce household debt burdens further out in the projection period. High debt, primarily at floating rates, has contributed to a significant increase in household interest expenses (Chart 3.3). With lower debt ratios and a decrease in the policy rate, the interest burden will decline gradually from a high level.
Percent
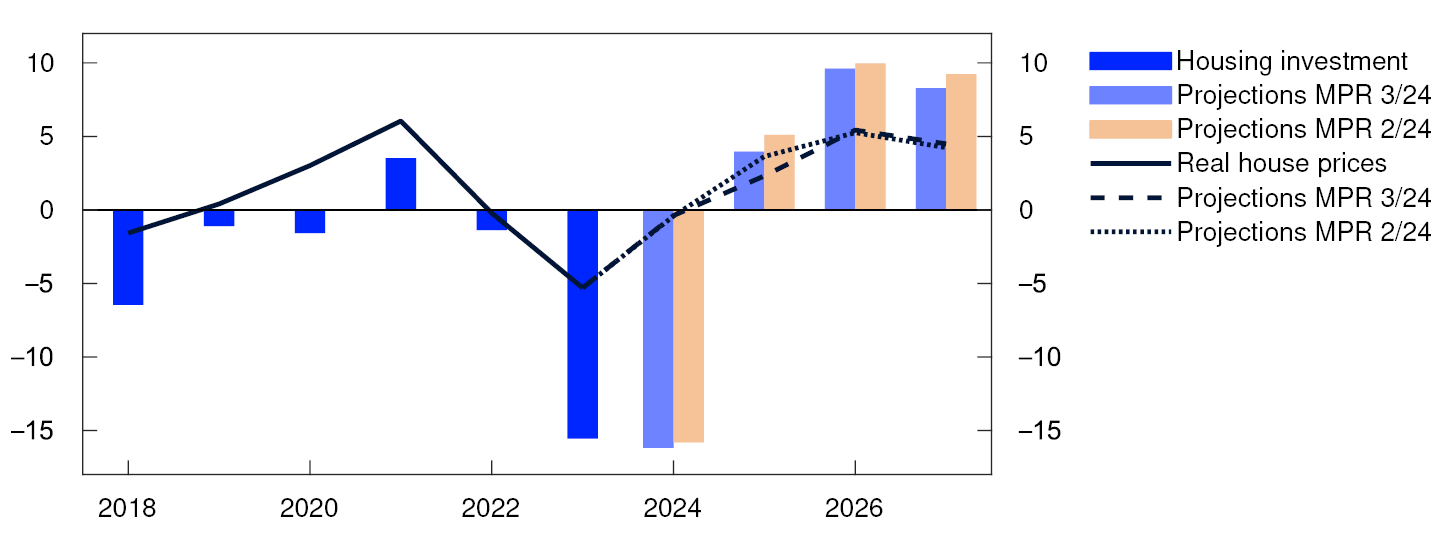
Housing investment still low
Housing investment continued to fall in 2024 Q2, as expected. High construction costs and higher interest rates have weighed on the profitability of many projects. In addition, prices in the primary housing market have risen more than in the secondary market in recent years, which has had a dampening effect on new home sales.
So far in 2024, prices for existing homes have risen sharply and more than prices for new homes. Turnover in the secondary housing market has been high, and a high number of homes have been listed for sale in recent months. New home sales have also picked up a little, but sales are still low. It will take a while for residential construction projects that have now been sold to be launched, which also suggests weak growth in housing investment in the coming quarters.
The rise in prices for existing homes was slightly weaker than expected through summer. Looking ahead, prices for existing homes are expected to rise on the back of a low supply of new homes, increased household purchasing power and lower residential mortgage rates. Reduced price differences between new and existing homes are expected to boost new home sales. Overall, increased sales and higher real house prices will lift housing investment further out in the projection period (Chart 3.4).
Housing investment and real house prices. Annual change. Percent
Decline in business investment in 2024
Mainland business investment has fallen substantially since summer 2023 but rose in 2024 Q2. The decline over the past year must be viewed in the context of higher interest rates, high cost growth and strong growth in services investment in 2021 and 2022. Investment is projected to fall in H2 and remain lower in 2024 than in 2023. From 2025, investment is expected to rise on the back of lower cost growth, lower interest rates further out, increased digitalisation and projects associated with the climate and energy transition.
Higher petroleum investment
Petroleum sector investment increased markedly in 2023. The strong growth in investment reflects the launch of a number of development projects in 2022 in response to the petroleum tax package and high petroleum prices. Investment is projected to rise approximately as much in 2024 and somewhat further in 2025. The projections have been revised up from the June Report based on Statistics Norway’s investment intentions survey. Investment in ongoing development projects is expected to fall markedly after 2025, and the decline will likely not be fully offset by investment in new projects (Chart 3.5). Thus, petroleum investment is projected to show some decline in 2026 and 2027.
Petroleum investment. Constant 2024 prices. In billions of NOK

A weaker krone boosts exports
Mainland exports have expanded rapidly over the past two years, largely driven by a weaker krone, increased tourism in Norway and higher investment in oil, gas and green technology outside Norway. The same factors are expected to lead to a slight rise in exports in 2024. Higher growth abroad will likely boost exports. Regional Network contacts in the travel industry report an increase in the number of foreign guests. A number of contacts in manufacturing and oil services report strong growth in export markets where a weaker krone is facilitating access to new markets. At the same time, the krone depreciation is dampening imports. Overall, moderate growth in both exports and imports is expected throughout the projection period.
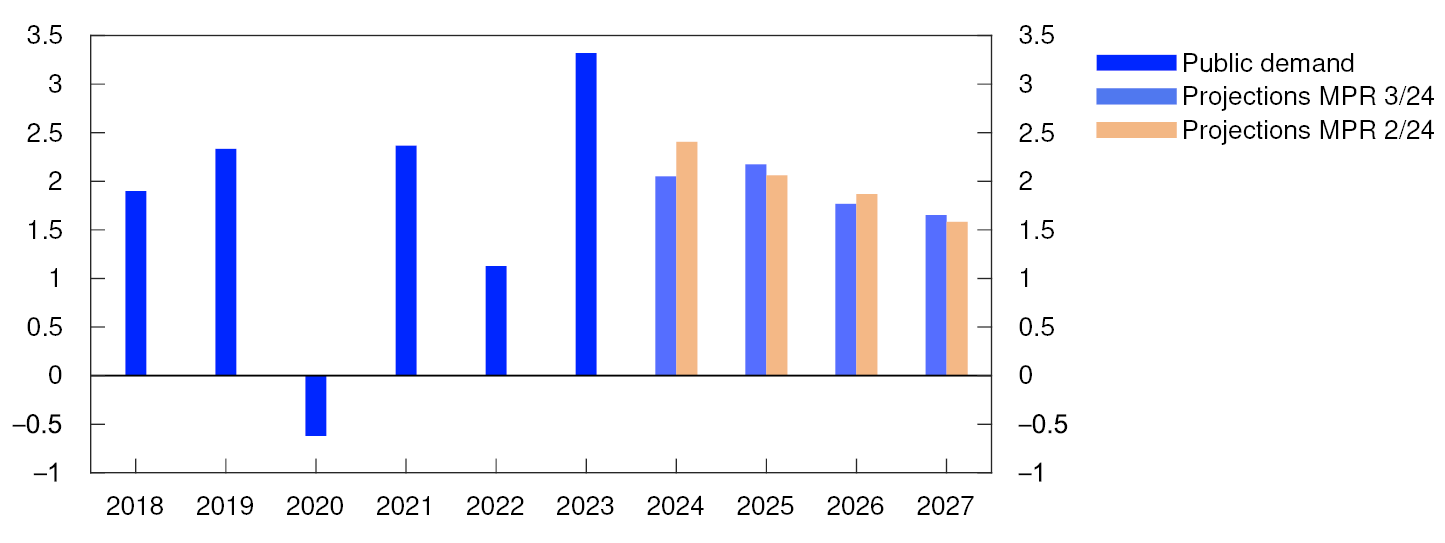
Strong growth in public demand
The projections of public demand are based on the Revised National Budget presented in spring. Following a decline in Q1, growth in public demand picked up in Q2, with public consumption in particular showing a rise. Developments in H1 have been slighter weaker than expected in the June Report. Growth in public demand is assumed to slow over the coming years (Chart 3.6) and rise slightly as a share of mainland GDP.
Public demand. Annual change. Percent
The projections are uncertain
The projections for the Norwegian economy are uncertain. Mainland growth is low. At the same time as Regional Network contacts have lowered their output growth expectations in 2024 Q3, the share of contacts reporting full capacity utilisation has risen since the previous survey. There are wide differences among contacts in their assessment of the outlook and the differences have widened since before summer. This makes it more difficult than normal to interpret the overall economic outlook.
Housing investment has fallen markedly in recent years. At the same time, a number of Regional Network contacts report longer decision-making processes and that some projects are being postponed or cancelled. This may indicate weaker-than-projected developments in housing investment ahead. At the same time, high house price inflation, increased household purchasing power and a decline in the policy rate further out may lift residential construction more than assumed.
In recent years, households have drawn down savings substantially to maintain consumption. With purchasing power now rising again, the extent to which households will increase consumption and how much they will wish to save are uncertain.
SMART- System for model analysis in real time
The System for Model Analysis in Real Time (SMART) is Norges Bank’s platform for forecasting models.1 In SMART, forecasts from a broad set of different models are weighted based on their historical forecasting properties. Since the June Report, the SMART forecasts for mainland GDP have remained approximately unchanged and the model forecasts for CPI-ATE have been revised down.
Model forecasts are an important tool for assessing the outlook for the Norwegian economy but will not necessarily be identical to the Bank’s final projections. For example, deviations may be due to conditions suggesting that relationships differ from what has historically been the case.
The SMART system now indicates slightly faster disinflation than in the June Report (Chart 3.A, left panel). The modelling system forecasts a four-quarter change in the CPI-ATE of 3.3% in 2024 Q3 and 2.9% in Q4. The downward revision reflects core inflation figures in Q2 that were lower than the SMART forecast in June.
Four-quarter change. Percent
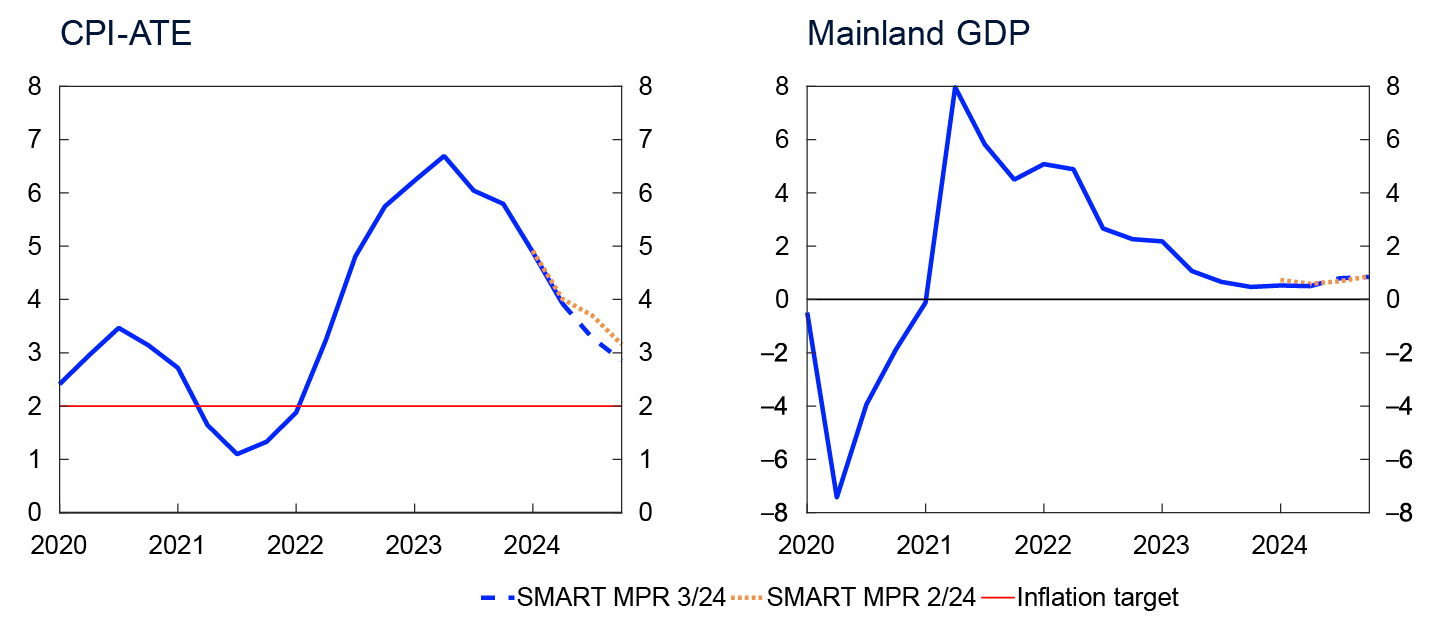
The SMART mainland GDP forecasts are little changed since the June Report (Chart 3.A, right panel). The modelling system forecasts a four-quarter change of 0.8% in 2024 Q3 and 0.9% in Q4.
- 1 F. Bowe, I.N. Friis, A. Loneland, E. Njølstad, S.S. Meyer, K.S. Paulsen and Ø. Robstad (2023) “A SMARTer way to forecast”. Staff Memo 7/2023. Norges Bank.
- 2 Period: 2020 Q1 – 2024 Q4. CPI-ATE: CPI adjusted for tax changes and excluding energy products. Projections from 2024 Q3 for MPR 3/24 and from 2024 Q2 for MPR 2/24. The SMART modelling system for short-term projections is based on historical relationships. It combines empirical models based on previous forecasting properties.
- 1 Period: 2018–2027. Projections from 2024. Petroleum investment data include investment in international shipping. Public demand = Public consumption + Public investment.
- 2 Period: 2018–2027. Projections from 2024. Disposable income is deflated by the CPI.
- 3 Period: 2004 Q1 – 2027 Q4. Projections from 2024 Q3 for MPR 3/24. Debt-to-income ratio is debt as share of disposable income. Disposable income is after-tax income less interest expenses. Debt service ratio is interest expenses and estimated principal payments on loan debt as a percentage of after-tax income. Interest burden is interest payments as a percentage of after-tax income
- 4 Period: 2018–2027. Projections from 2024. House prices are deflated by the CPI.
- 5 Period: 2018–2027. Projections from 2024. Data for 2018–2023 from Statistics Norway’s investment intentions survey, deflated by the price index for petroleum investment in the national accounts. The price index is projected to increase by 6.5 percent in 2024 and by 3 percent in 2025.
- 6 Period: 2018–2027. Projections from 2024. Public demand = Public consumption + public investment.
3.2 Labour market
High employment
The employment to population ratio is high, but the rate has declined somewhat since 2022 (Chart 3.7). Registered unemployment is still a little lower than it was in the pre-pandemic period. Employment was unchanged in 2024 Q2, after having risen each year over the past three years. Developments in Q2 were as projected in the June Report.
Employment to population ratio. 15–74 years. Percent

There are wide differences across industries. In construction, the decline in employment continued, in line with the trend over the past year. At the same time, further growth in the healthcare sector underpinned public sector employment growth.
Unemployment, as measured by the Norwegian Labour and Welfare Administration (NAV), has risen gradually in 2024. In August, seasonally adjusted unemployment was 2.0%, close to the level before summer (Chart 3.8). Unemployment is at the same level as projected in the June Report.
Registered unemployed as share of the labour force. Seasonally adjusted. Percent
According to the Labour Force Survey (LFS), unemployment has remained steady at 4.0% since March 2024, close to its pre-pandemic level. Since 2022, LFS unemployment has risen more than registered unemployment, in large part because the LFS captures more of the unemployed aged below 20.
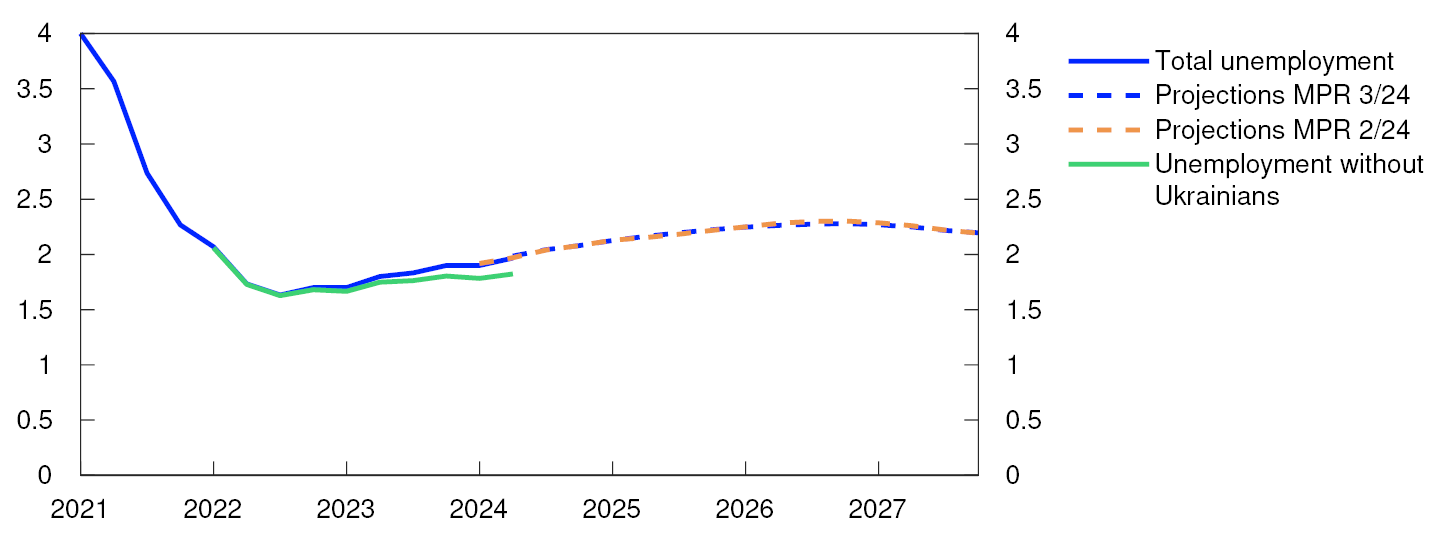
Refugees increase the labour supply
Many Ukrainian refugees of working age have come to Norway over the past few years. Historical experience shows that it takes some time before refugees find employment, and the employment to population ratio increases the longer refugees stay in Norway. Over the past year, Ukrainian wage earners have accounted for a substantial share of the rise in employment. A number of Ukrainians have registered as unemployed with NAV, and this group accounts for a third of the rise in unemployment since summer 2022, when unemployment was at its lowest.
So far in 2024, the number of temporary foreign workers has been close to the level before the turn of the year. This is despite both a marked fall in construction employment, where many workers in this group are employed, and the krone depreciation, which has reduced the value of wages in foreign currency terms over the past couple of years.
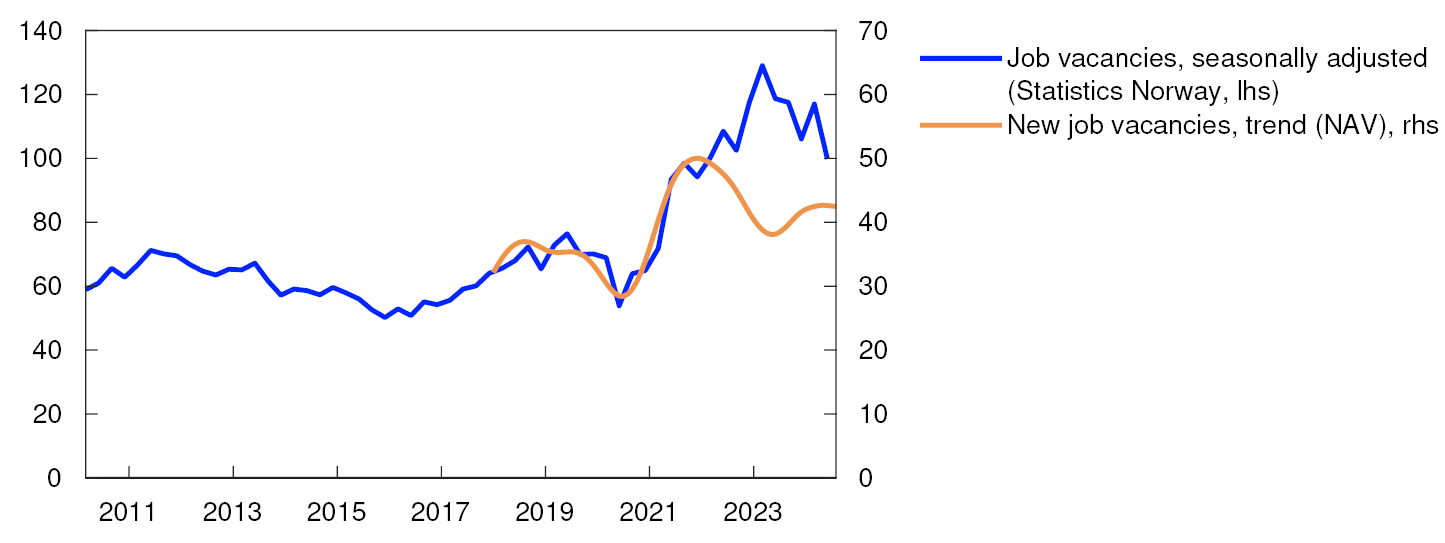
High number of vacancies
The number of job vacancies is high (Chart 3.9). The number is higher than before the pandemic and indicates high labour demand. NAV statistics show that the number of newly advertised vacancies has changed little in recent months after some rise earlier this year. According to Statistics Norway’s sample survey, the stock of vacancies decreased between 2024 Q1 and Q2.
Number of job vacancies in thousands
Employment is projected to edge up in the second half of 2024. According to preliminary register-based data, the number of wage earners rose substantially in July, and Regional Network contacts expect moderate growth in employment towards the end of the year.
In the coming years, employment growth is expected to pick up gradually as economic activity increases. In 2024 and 2025, population growth will likely outpace employment growth, which means that the employment to population ratio will decline somewhat. The employment to population ratio will gradually pick up again thereafter. The number of temporary foreign workers is also assumed to rise gradually in the years ahead as construction activity picks up again. The projections are little changed from the June Report.
In the projections, labour force growth outpaces employment growth in the coming years and unemployment edges up. A rising number of Ukrainian refugees enters the Norwegian labour market, pushing up unemployment somewhat (see discussion in the box on the output gap below). The unemployment projections are little changed since the June Report.
Capacity utilisation levels off
Capacity utilisation has declined over the past couple of years and is now close to a normal level. Capacity utilisation is expected to change little to the end of the year, before declining and running somewhat below a normal level to the end of the projection period. The projections are little changed from the June Report.
Capacity utilisation, or the output gap, is a measure of the intensity with which the economy makes use of its resources. The output gap is defined as the percentage difference between actual output and potential output in the mainland economy. Potential output is determined by productivity growth and the highest sustainable level of employment consistent with stable wage and price inflation, hereinafter referred to as N*. The Bank estimates the output gap based on an overall assessment of various indicators and models, where particular weight is given to labour market developments.
Capacity utilisation declined from a high level through 2023 (Chart 3.B). Growth in the Norwegian economy was weak and unemployment edged up. At the same time, a declining share of Norges Bank’s Regional Network contacts reported capacity constraints and labour shortages. So far in 2024, economic developments suggest that the decline in capacity utilisation has halted. Economic growth has been sluggish. Unemployment has risen somewhat but showed little change between June and August. In addition, the number of vacancies remains at a high level. The share of Regional Network contacts reporting capacity constraints and labour shortages has edged up since the turn of the year, and the share is close to its historical average.
Percent
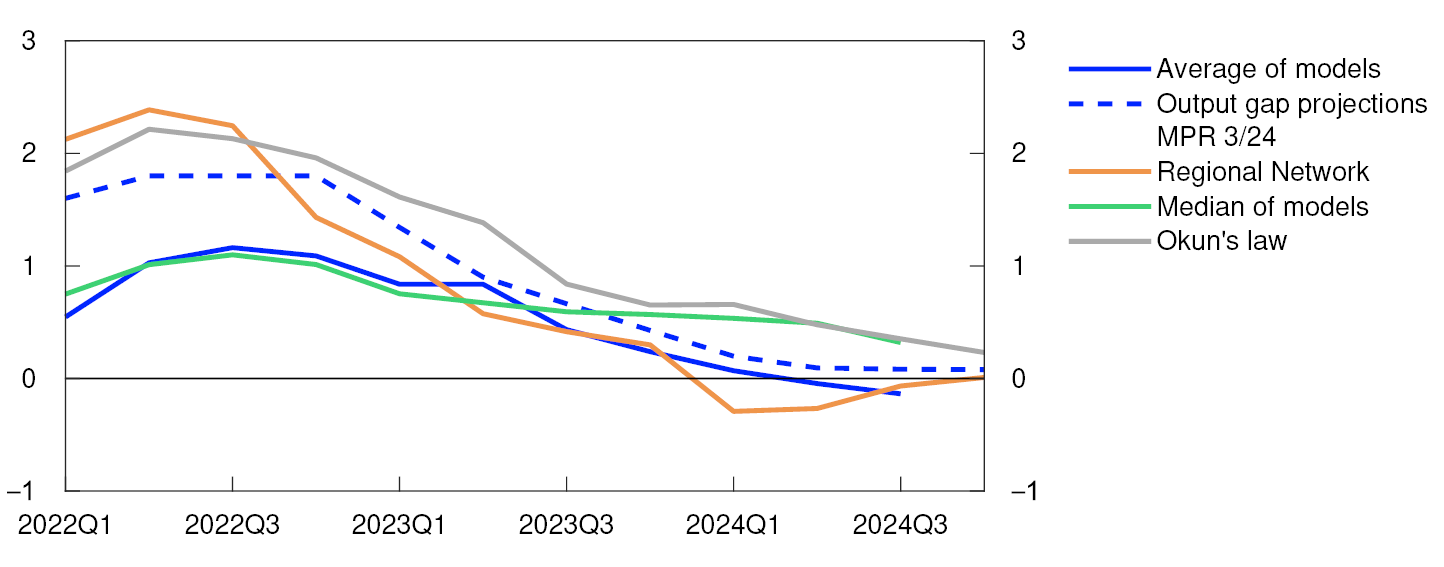
The average of the models in Norges Bank’s modelling system for the output gap indicates that capacity utilisation has declined somewhat in 2024 (Chart 3.C).2 One of the models that uses information about credit developments relative to consumer prices (real credit) now projects particularly low capacity utilisation given the recent substantial decline in real credit. Most of the models in the system, illustrated by the median in Chart 3.B, yield a slightly higher-than-average output gap projection and indicate that developments have been stable in recent quarters.
On the whole, capacity utilisation in 2024 is assessed to remain close to a normal level, approximately as projected in the June Report and in line with the indicators in Chart 3.B. In 2025, output is expected to increase less than potential output. Unemployment is therefore likely to increase somewhat while capacity utilisation declines. The output gap is projected to bottom out at -0.4% in 2026. Compared with the June Report, the projections are little changed.
The number of Ukrainian refugees in Norway is assumed to continue rising in 2024 and 2025 and is expected to gradually increase the labour supply. Given the time it normally takes for new refugees to find work, unemployment is expected to temporarily rise somewhat more over the next few years than the projections of employment and capacity utilisation would normally suggest. A reversal of this effect is expected further out as Ukrainians are integrated to a greater extent in the labour market. The employment to population ratio is expected to decline gradually and become lower than N* before picking up further out and approaching N* again.
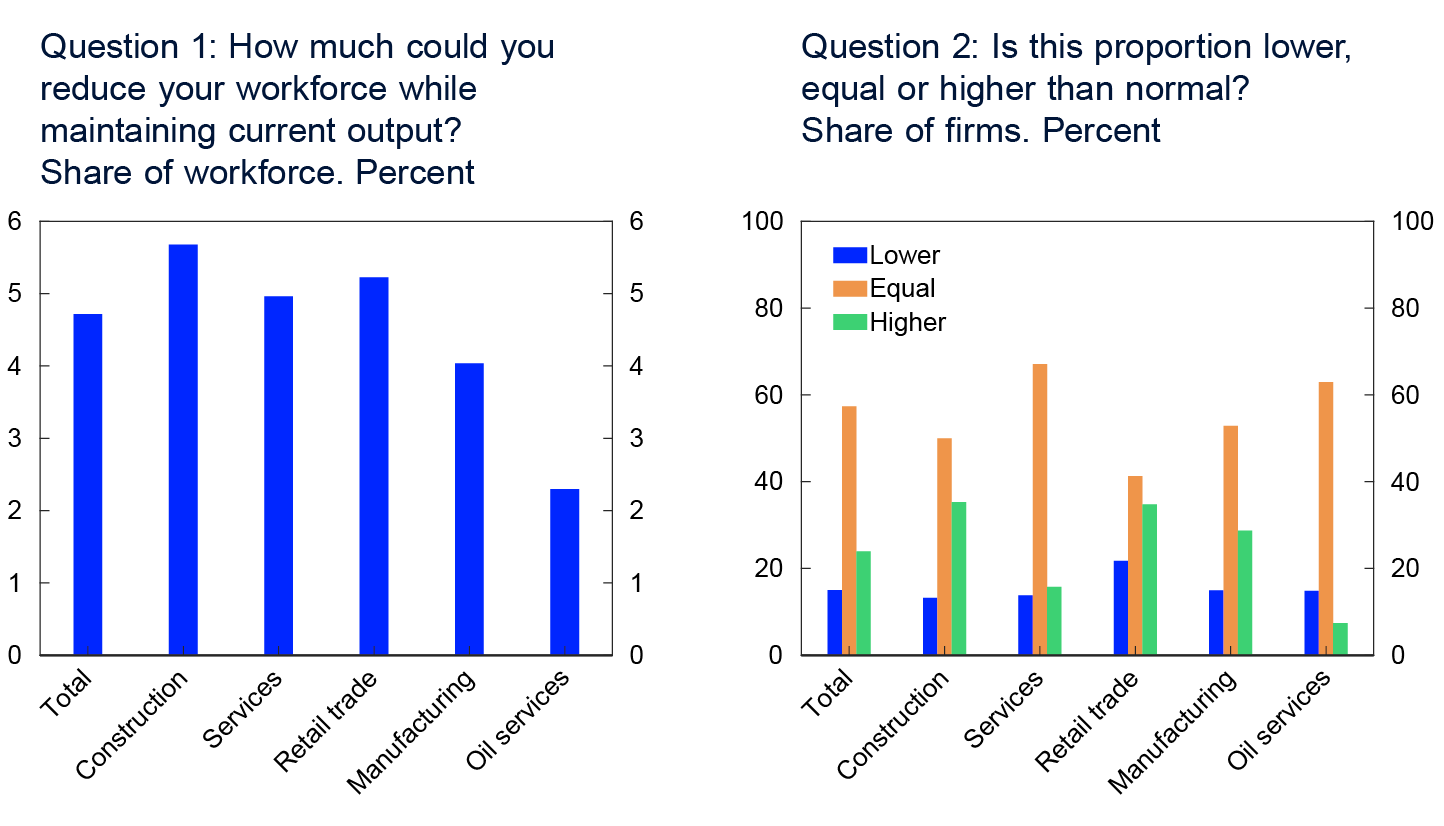
In recent years, productivity growth has been weak across most sectors and Regional Network contacts report continued low productivity growth. Some of the recent weakness in productivity growth is likely due to the slowdown in the economy and labour hoarding by individual firms in anticipation of an upswing, as previously indicated in both Norway and other countries in Europe. This is also indicated by some Regional Network contacts. In 2024 Q3, more Regional Network contacts reported a higher-than-normal share of spare labour capacity than those that reported the opposite (Chart 3.C). In retail trade and construction, the share reporting higher-than-normal spare capacity was particularly high. The majority of these contacts reported spare capacity because their activity levels are currently low and they expect an upswing ahead, which may suggest somewhat higher productivity growth ahead.
Productivity growth is expected to pick up gradually in the years ahead in pace with a faster rebound in economic activity in industries such as construction. Overall, the projection of potential economic output is little changed (Table 3.A).
Table 3.A Output and potential output4
|
Change from projections in Monetary Policy Report 2/2024 in brackets |
Percentage change from previous year |
|||||
|---|---|---|---|---|---|---|
|
1995–2009 |
2010–2023 |
2024 |
2025 |
2026 |
2027 |
|
|
GDP, mainland Norway |
3.1 |
1.9 |
0.6 (-0.2) |
1.1 (-0.2) |
1.3 (0.1) |
1.5 (-0.1) |
|
Potential output |
3.1 |
1.8 |
1.3 (-0.1) |
1.4 (-0.2) |
1.5 (0) |
1.4 (0) |
|
N* |
1.3 |
1.1 |
0.9 (0) |
1.1 (0) |
1 (0.1) |
0.8 (0) |
|
Trend productivity |
1.7 |
0.7 |
0.4 (-0.1) |
0.4 (-0.1) |
0.6 (0) |
0.6 (0) |
Uncertainty related to the projection of capacity utilisation ahead is considerable. If capacity utilisation were also to remain unchanged into 2025, unemployment could turn out to be lower, and wage growth higher, than currently projected. On the other hand, Ukrainian refugees may increase the supply of labour more than currently expected and productivity growth may pick up faster than projected. Potential output could then increase more than currently envisaged, resulting in a more rapid decline in capacity utilisation and higher unemployment.
- 1 Period: 2022 Q1 – 2024 Q4. Regional Network is a direct estimate of the output gap based on the average of the capacity utilisation indicators in the Regional Network and the historical correlation with Norges Bank’s output gap projection where the Regional Network indicator leads by one quarter. Okun’s law is based on an estimated deviation from the trend in registered unemployment as a percentage of the labour force.
- 2 The modelling system consists of a set of models and is based on information about variables such as mainland GDP, the labour market, wage growth, business investment as a percentage of mainland GDP, domestic inflation, house prices and credit. For a detailed description of the models, see Furlanetto, F., K. Hagelund, F. Hansen and Ø. Robstad (2022) “Norges Bank Output Gap Estimates: Forecasting Properties, Reliability, Cyclical Sensitivity and Hysteresis”. Oxford Bulletin of Economics and Statistics, 85(1), pp 238–267.
- 3 The questions were asked as part of a special feature in the Regional Network survey for 2024 Q3. The right panel shows the share of enterprises responding “lower”, “equal” or “higher” by sector. The shares do not necessarily sum exactly to 100. This discrepancy is due to Regional network Contacts that did not provide respones in the special feature.
- 4 The contributions from N* and trend productivity do not necessarily sum exactly to the annual change in potential output due to rounding. Compared with the June Report, some revisions of N* have been made back in time to reflect corrections of historical calculations and not new assessments.
- 1 Period: 2005 Q1 – 2027 Q4. Projections from 2024 Q3. N* is an estimate of the highest level of employment that can be maintained over time without driving up wage and price inflation.
- 2 Period: 2021 Q1 – 2027 Q4. Projections from 2024 Q2 for MPR 2/24 and from 2024 Q3 for MPR 3/24.
- 3 Period: Statistics Norway: 2010 Q1 – 2024 Q2. NAV: January 2018 – August 2024. As a result of missing data in NAV’s statistics at the start of 2018, only data since January 2018 are shown.
3.3 Wages and prices
Lower wage growth in 2025
Wage growth is high after having risen gradually in recent years, amid high inflation, a tight labour market and strong profitability in some business sectors.
Wage growth is projected at 5.2%, the same as last year. The projection is consistent with the wage norm and is unchanged from the June Report. Regional Network contacts and the social partners in Norges Bank’s Expectations Survey also indicate wage growth close to the wage norm (Chart 3.10). Expectations are little changed from earlier in 2024.
Annual wage growth. Percent
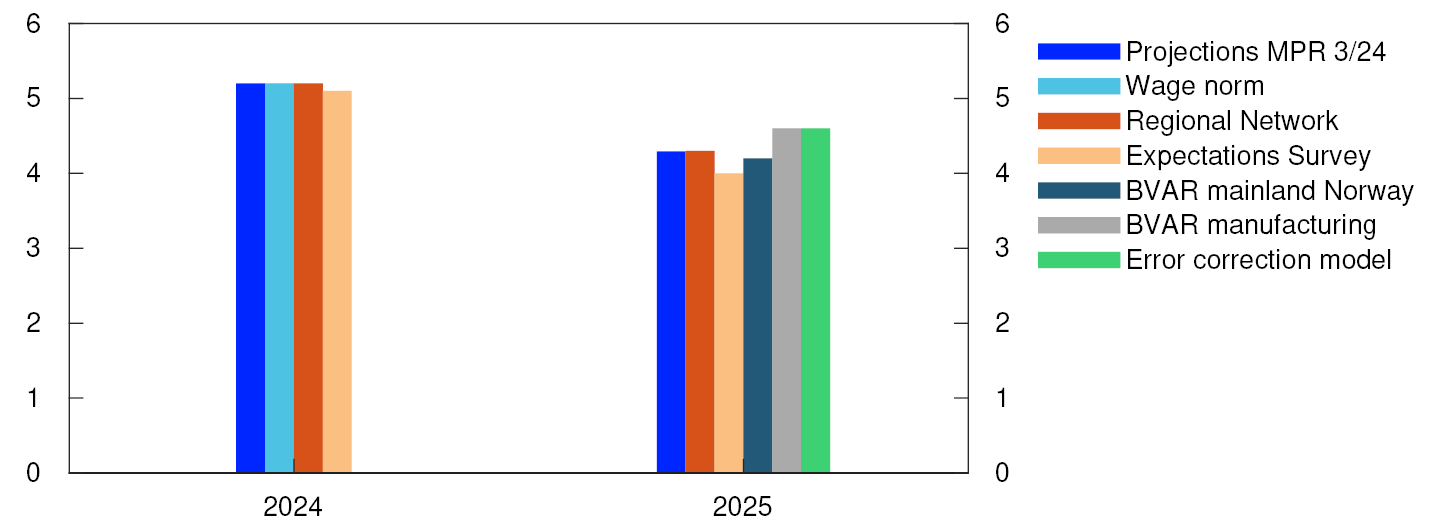
The krone depreciation has improved profitability in some manufacturing segments, which is expected to continue to push up wage growth ahead. On the other hand, lower inflation and lower capacity utilisation will pull down wage growth, which is projected to decline to 4.3% overall in 2025. This is in line with the expectations of Regional Network contacts and the social partners in the Expectations Survey. Both the wage expectations of the social partners and the Bank’s models imply a decline in wage growth in 2025 (Chart 3.10), and they also indicate lower wage growth in 2025 than they indicated in June. Compared with the June Report, lower wage growth is expected in 2025. The Bank’s projections indicate that wage growth will remain higher in Norway than among trading partners (see further discussion of wage growth abroad in Section 1).
Real wage growth is expected to be high in 2024 (Chart 3.11). Looking ahead, growth is expected to decline slightly but to remain higher than the average for the past five years. This reflects the expectation that productivity growth will edge up and that import prices will rise less than prices for domestic goods and services.
Annual change. Percent
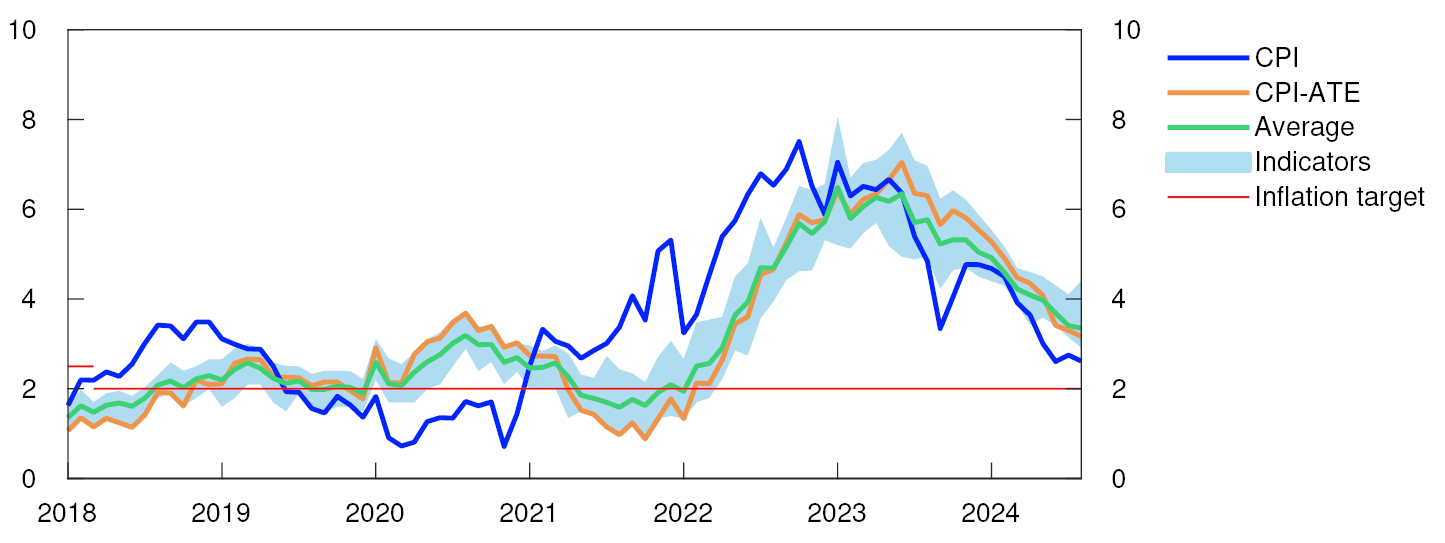
Inflation has fallen
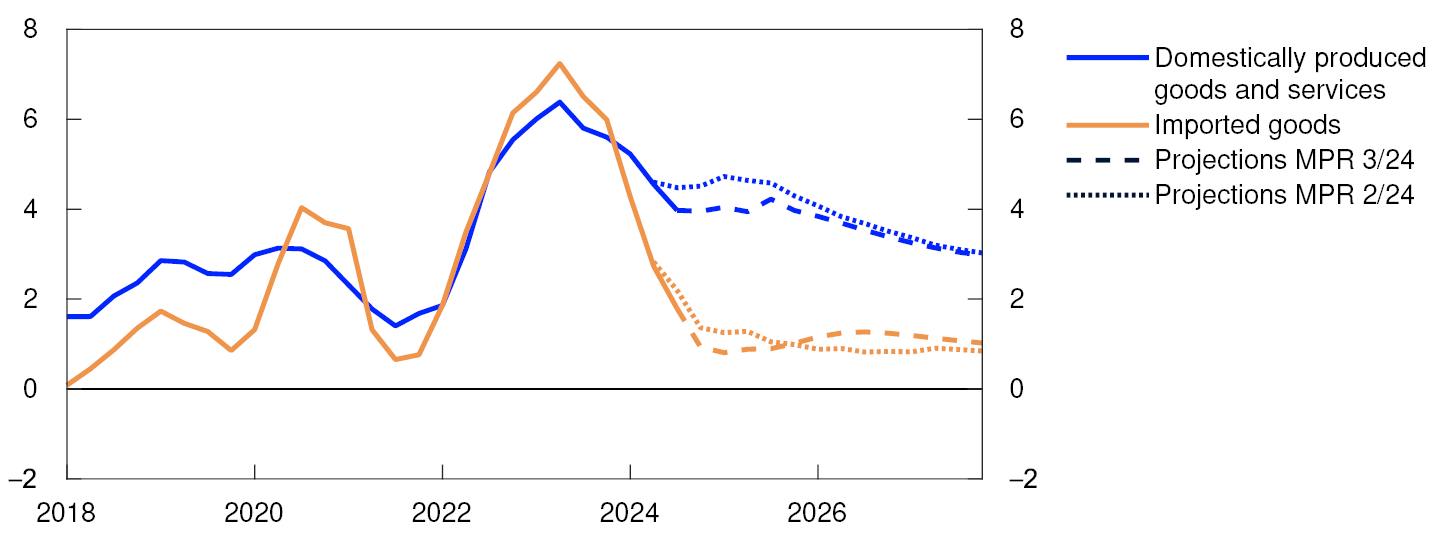
Inflation has slowed considerably since the end of 2022 (Chart 3.12), with imported consumer goods inflation showing a particularly strong decline (Chart 3.13). In August, the 12-month rise in the consumer price index (CPI) moved down to 2.6%, which was lower than projected in the June Report. Underlying inflation, as measured by the CPI adjusted for tax changes and excluding energy products (CPI-ATE), moved down to 3.2% and was lower than expected. The average of other underlying inflation indicators has also decreased recently.
CPI and underlying inflation indicators. Twelve-month change. Percent
Domestically produced goods and services and imported goods in the CPI-ATE. Four-quarter change. Percent
Large changes in prices for some groups
Since the June Report, large changes in prices for some groups of goods and services have contributed to faster-than-expected disinflation. This also applies to package holiday prices, which fell considerably in summer following a sharp rise in spring. In August, child daycare prices were reduced substantially, which will dampen the 12-month rise in prices in the coming year.
Inflation is normally measured as the 12-month change in the CPI. As equal weight is given to the change in prices in each of the past 12 months, this variable changes slowly. Recently, three and six-month annualised inflation rates have been lower than 12-month CPI inflation (Chart 3.14). Adjusted for child daycare prices, short-term inflation targets have risen and approached 12-month CPI inflation.
CPI-ATE. Annualised change. Seasonally adjusted. Percent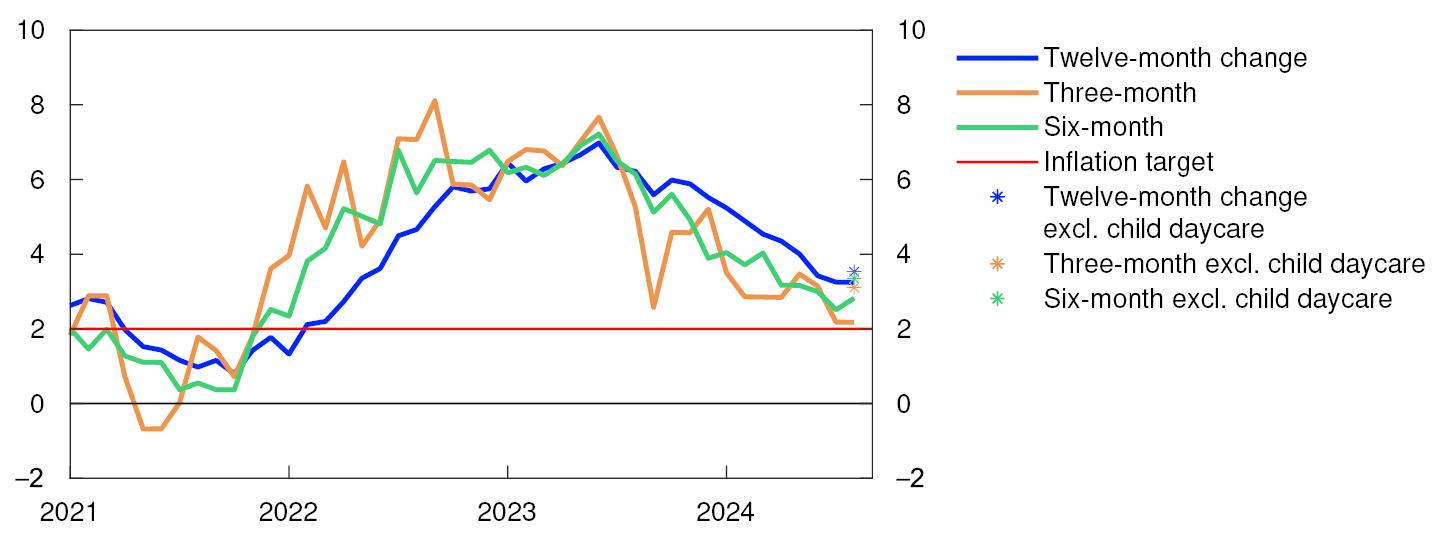
Energy prices have fallen since summer 2023 and dampened overall inflation. In the near term, energy prices are expected to continue to pull down overall inflation. The projections for consumer energy prices are based on futures prices for electricity and petroleum products and also take into account other factors such as electricity distribution charges and indirect taxes. Electricity futures prices in the coming years are now lower than in June (see “Lower energy prices in Norway”), which partly accounts for the downward revision of the overall inflation projections for 2024. Towards the end of the projection period, electricity futures prices are little changed. Electricity distribution charges appear to be somewhat higher than envisaged in the June Report and contribute in isolation to pushing up inflation.
The rapid rise in rents is restraining the decline in overall inflation, and rent inflation accelerated slightly in August (Chart 3.15). The rise in prices for other services and food is also high.
CPI. Twelve-month change. Percent. CPI subcomponents. Percentage points
Inflation approaches the target in 2027
Over the past year, the rise in prices for wage-sensitive goods and services has slowed somewhat less than overall inflation (see “Wage-sensitive CPI components”). Looking ahead, high wage growth, combined with low productivity growth, is expected to slow disinflation.
Since the June Report, the krone has depreciated and been weaker than projected (see further discussion in Section 2). This is also expected to slow disinflation (see “A weaker krone exchange rate pushes up inflation – but by how much?”). Lower wage growth and lower capacity utilisation are expected to push down overall inflation further out.
The rise in prices for imported consumer goods is expected to moderate further in the near term and to subsequently edge up again. The rise in prices for domestic goods and services is projected to remain at a high level but to decline gradually in the years ahead. Overall, inflation is projected to decline gradually and approach the target by the end of 2027.
Compared with the June Report, overall inflation projections have been revised down for 2024 and are little changed thereafter. The underlying inflation projections have been revised down for 2024 and 2025, and projections further out are approximately the same as in the June Report.
Somewhat faster decline in inflation than implied by driving forces
In recent years, there have been substantial deviations between consumer price inflation and what the historical relationship between inflation and key cost drivers would imply (see residual term in Chart 3.16). When inflation was high, prices rose faster than implied by historical relationships. Inversely, inflation has recently receded faster than historical relationships would suggest. A possible reason may be that the feed-through from costs to prices may have occurred faster than previously (see also box in Monetary Policy Report 4/2022). In 2023, almost half of Region Network contacts reported having changed prices faster than they had done before the pandemic.
Contribution to four-quarter change in CPI-ATE. Percentage points
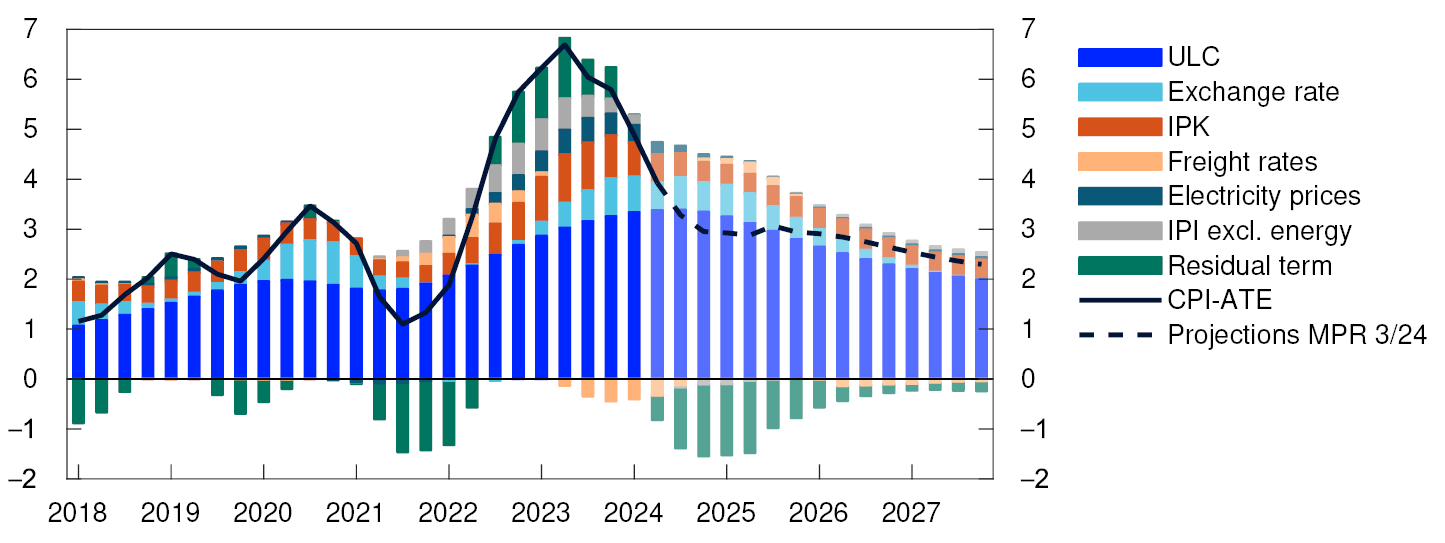
In the coming quarters, inflation is still expected to be somewhat lower than developments in business costs and the krone exchange rate would normally suggest. Further ahead, it is assumed that inflation will again evolve more in line with historical relationships.
Uncertainty surrounding price and wage inflation
The projections for price and wage inflation ahead are uncertain. The future path of inflation is uncertain given that the path of inflation has been somewhat different from what the key cost drivers normally imply.Moreover, energy and electricity prices have been highly volatile in recent years. If these price developments differ from what is currently envisaged, overall inflation may also differ from current projections.
In addition, there is uncertainty surrounding productivity growth ahead. Productivity growth has been weak in recent years and is projected to rise gradually in the course of the projection period. If productivity does not increase as expected, inflation may remain elevated for longer than currently envisaged. Productivity growth may also be stronger than currently envisaged, which may imply lower inflation and higher real wage growth.
After rapid disinflation, uncertainty indicators of inflation now signal more centred uncertainty, albeit still somewhat higher than normal. According to the Bank’s Expectations Survey, inflation expectations fell slightly between 2024 Q2 and Q3 but are still slightly above the inflation target both two and five years ahead.
The labour share for mainland Norway as a whole is close to its historical average, while the labour share in manufacturing has fallen below its historical average. So far in 2024, the labour share in manufacturing appears to have remained low. In the Norwegian system of wage negotiations, the tradeable sector’s ability to pay wages provides the norm for overall wage growth, and the labour share in manufacturing is expected to remain stable over time. There is uncertainty as to how fast and to what extent the labour share in manufacturing will approach its historical average. High manufacturing profitability may keep wage growth elevated and lead to higher-than-expected wage growth in 2025. In addition, there is uncertainty about next year’s wage settlements due to the wide differences between profitability in manufacturing and other industries.
Indicators of uncertainty in the near and medium term
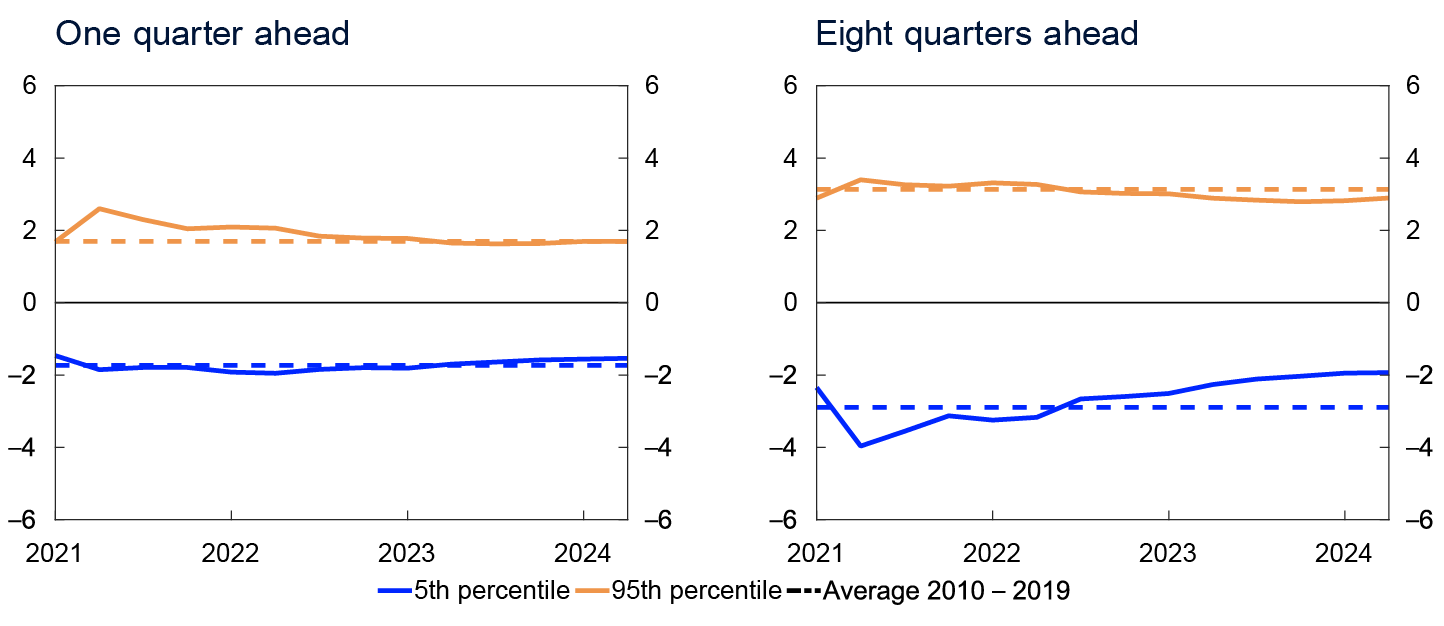
Expectations and projections of future economic developments will always be subject to considerable uncertainty. As an aid in understanding macroeconomic uncertainty, Norges Bank uses a model framework to quantify the uncertainty surrounding developments in two key macroeconomic variables: mainland GDP growth, and consumer price inflation.1 The models help shed light on the uncertainty surrounding a set of point estimates. One of several possible forward-looking risk indicators is derived from the simple model framework. Our overall assessment of risk ahead will always be based on a combination of discretion and model estimates.
In this box, we use the difference between the median and the 95th and 5th percentiles, respectively, in the model framework’s estimated range of outcomes ahead as a measure of upside and downside risk. The charts show the changes in estimated upside and downside risk for the different variables over time. They show both changes in the size of the estimated range of outcomes, as measured by the difference between the 95th and 5th percentiles, and whether there is significant asymmetry between upside and downside risk.
In recent years, inflation uncertainty has been higher than the historical average. Near-term uncertainty has drifted down gradually over the past year and is now close to its historical average (Chart 3.D, left panel). Medium-term uncertainty has also declined but remains higher than its historical average. The risk of significantly higher-than-projected inflation contributes in particular to considerable uncertainty (Chart 3.D, right panel).
Spread between percentiles and median from quantile regressions. Four-quarter change in CPI-ATE. Percentage points

The models indicate that near-term uncertainty surrounding mainland GDP growth is more centred and close to normal levels (Chart 3.E). Medium-term uncertainty is close to the historical average, albeit still skewed slightly to the upside. Since the June Report, changes in near and medium-term uncertainty have been minor.
Spread between percentiles and median from quantile regressions. Four-quarter change in Mainland GDP. Percentage points
- 1 The models use quantile regressions with different indicators to estimate the distribution of output growth and consumer price inflation ahead. See further description in F. Bowe, S.J. Kirkeby, I.H. Lindalen, K.A. Matsen, S.S. Meyer and Ø. Robstad (2023) “Quantifying macroeconomic uncertainty in Norway”. Staff Memo 13/2023. Norges Bank.
- 2 Period: 2021 Q1 – 2024 Q2. The charts show developments in the difference between the 5th and 95th percentiles from the median for the model estimated distribution of consumer price inflation one and eight quarters ahead, respectively. Broken lines indicates average 5th and 95th percentiles between 2010 and 2019
- 3 Period: 2021 Q1 – 2024 Q2. The charts show developments in the difference between the 5th and 95th percentiles from the median for the model estimated distribution of consumer price inflation one and eight quarters ahead, respectively. Broken lines indicates average 5th and 95th percentiles between 2010 and 2019.
- 1 Period: 2024–2025. Expectations Survey: Social partners’ annual wage growth expectations. Regional Network: Expected wage growth in own enterprise.
- 2 Period: 2018–2027. Projections from 2024. Real wages: Nominal annual wage growth adjusted for CPI inflation.
- 3 Period: January 2018 – August 2024. CPI-ATE: The consumer price index adjusted for tax changes and excluding energy products. Average: Average value of the 12-month change for other underlying inflation indicators (CPIM, CPIXE, 20 percent trimmed mean, weighted median, CPIXV, CPI-sticky prices and CPIF) and CPI-ATE. Indicators: Highest and lowest 12-month change for underlying inflation indicators.
- 4 Period: 2018 Q1 – 2027 Q4. CPI-ATE: the consumer price index adjusted for tax changes and excluding energy products. Projections from 2024 Q2 for MPR 2/24 and from 2024 Q3 for MPR 3/24.
- 5 Period: January 2021 – August 2024. Three and six months refer to average annualised monthly change over the different periods. Price rises excluding child daycare exclude the CPI social protection sub-component.
- 6 Period: January 2018 – August 2024. Contributions estimated based on the CPI by consumption categories (group level). Inaccuracies may occur across categories. Some discrepancies may occur due to rounding errors.
- 7 Period: 2018 Q1 – 2027 Q4. Projections from 2024 Q3. Decomposition of individual contributions from different cost components.
Wage-sensitive CPI components
Wages make up a large share of firms’ costs across many sectors. This box presents an index that summarises the developments in wage-heavy CPI components. It shows that the rise in prices for wage-sensitive goods and services has slowed somewhat less than overall inflation over the past year, reflecting persistently elevated wage growth.
Wage growth is normally an important factor for understanding consumer price inflation as wages account for a large share of firms’ costs in many consumer-oriented sectors. At the same time, many other factors also affect inflation. When there is a significant and concurrent change in both wage growth and other conditions, identifying the wage growth contribution to inflation becomes more challenging. The index presented in this box can be helpful in these cases, providing insight into both the speed and strength with which changes in wage growth affect inflation.
The relationship between wage costs and prices will vary across the consumption categories that comprise the consumer price index (CPI). Input-output tables are used to identify the consumption categories most affected by wage costs and therefore to a lesser extent driven by other costs. The price indexes belonging to these consumption categories are compiled into an aggregated index which thus reflects price development of consumer goods where wages make up a large share of the costs.
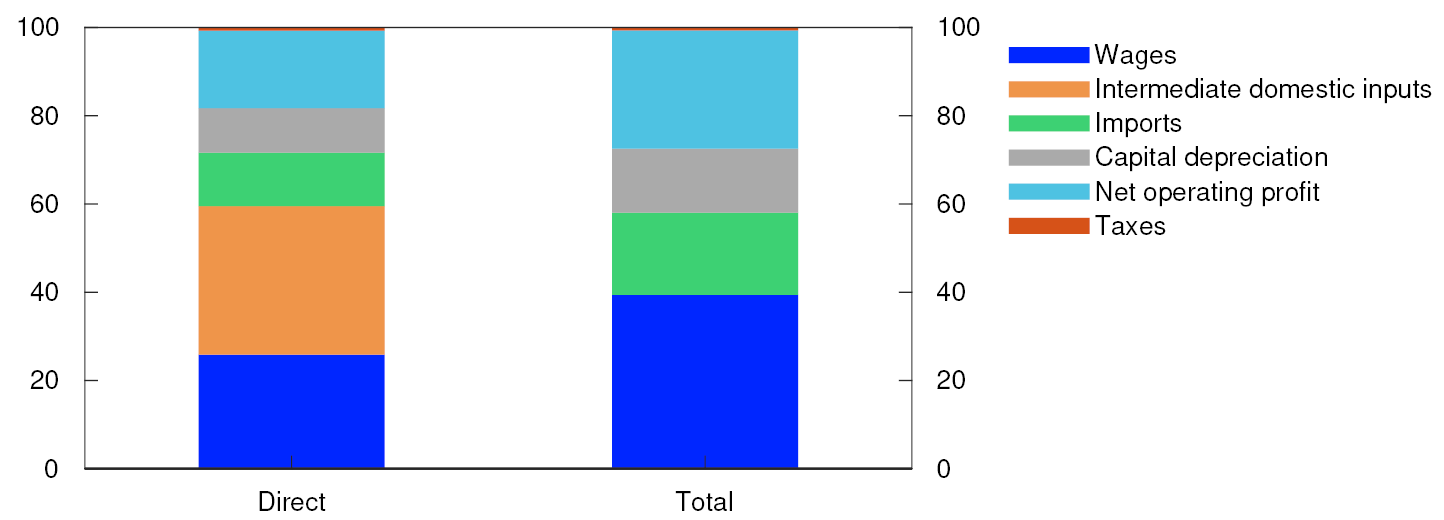
The method from a similar analysis in ECB Economic Bulletin Issue 3/2024 is used to identify the most wage-sensitive consumer components.1 Indirect and direct wage costs are calculated for different sectors, which are subsequently matched with various CPI components. First, national accounts are used to calculate firms’ wage costs relative to output value in different sectors. In addition to the direct wage costs in each sector, wage costs that are incurred indirectly through intermediate inputs via domestic subcontractors are taken into consideration. For example, when indirect wage costs are also included, the wage share in construction increases from 12% to 48% of output.
For Norwegian firms overall, the average share of wage costs increases from 26% to 39% (Chart 3.F). If firms’ margins grow in line with output value, increased wages and import prices can have a larger effect on consumer prices than the cost shares alone would suggest.
Factor inputs as a share of total output in basic prices. Average across sectors. Percent
The wage cost shares summarise the importance of wage costs across different sectors. To shed light on their importance for different CPI sub-indexes, it is also necessary to link sectors and consumption categories.3 Goods and services components are defined as wage-sensitive when wage cost shares exceed the average. Wage-sensitive components predominantly consist of services, (eg education, leisure and cultural services, health and social services, and restaurants) but also some goods such as newspapers and books. However, a number of large consumption categories, such as food and rent are not defined as wage-sensitive. Together the wage-sensitive prices account for around 25% of the representative CPI basket. Finally, the price indexes for these goods and services components make up a weighted aggregated index of particularly wage-sensitive prices (Chart 3.G).

The index captures a slightly wider range of prices than the index published by Statistics Norway of Services where labour dominates. While the index of Services where labour dominates is limited to services where the labour-related contribution is key at the point of consumption (eg a hairdresser cutting a customer’s hair), the index for wage-sensitive prices also includes goods and services where labour is included as an important factor in addition to other inputs (eg the wages of the wait staff, the chef and the farmer are key costs in producing a restaurant meal).
Even though wage costs are important for wage-sensitive prices, the index is also affected by other cost factors, such as import prices and capital costs. In addition, the index contains some administered prices that can be affected by wage costs, but also by policy priorities.
Index growth is covariant with changes in total economy unit labour costs (ULC) over time (Chart 3.G, left panel). This confirms that the index largely reflects wage cost developments. Wage-sensitive prices have historically risen faster than the CPI-ATE. Compared with CPI-ATE and the index of domestically produced goods and services (CPI-ATED), developments in the index have been more stable and shown a stronger correlation with wage growth in recent years (Chart 3.G, right panel). For example, the increase in wage-sensitive prices remained high when the rise in both CPI-ATE and CPI-ATED fell sharply in 2021.
Inflation rose rapidly in Norway throughout 2022. The rise in wage-sensitive prices also increased rapidly in the same period, particularly driven by prices for both restaurant and cultural services. The rise in prices for wage-sensitive consumption components was faster than the rise in wages, indicating that other factors than wage played a part, which may have been due to shifts in demand in the wake of the pandemic and large changes to import prices and other input prices.
CPI-ATE inflation has slowed since summer 2023. It took longer for the rise in wage-sensitive prices to start to fall, and in Q2, the four-quarter rise in wage-sensitive prices was 0.6 percentage point higher than the CPI-ATE, which may reflect sustained high wage growth in recent years. The rise in wage-sensitive prices is expected to decline ahead, but at a slower pace than total CPI-ATE. Should wage growth slow more gradually than assumed, the wage-sensitive prices could lead to higher inflation than currently projected.
Going forward, developments in wage-sensitive prices can aid in monitoring the pass-through from wage growth to consumer prices and in using the index in the empirical model framework. The index can also be used as a cross-check for developments that are challenging to assess in real time, such as wage and productivity growth in consumer-oriented industries.
- 1 Bodnar, K., Fagandini, B., Goncalves, E., Koester, G., Kouvavas, O. og Rubene, I. (2024) “Decomposing HICPX inflation into energy-sensitive and wage-sensitive items”. Economic Bulletin 3/2024. ECB. ECB uses price indexes on a ECOICOP 5-digit level. Due to lack of access to detailed data, the analysis described here is limited to the more aggregated classification on a 3-digit level. Norges Bank envisages an increased amount of data sources to provide an improved analysis basis in the future, and to discuss the analysis in more detail.
- 2 Shares estimated using input-output tables for 2021, published by Statistics Norway. Average accross sectors, weighted by total use. Input-output tables comprise all sectors.
- 3 We use a translation matrix backed by input-output tables, various cross-checks, and some discretion.
- 4 Unit labout costs (ULC) annual average.
Left panel: Period: 1996 Q1 – 2024 Q2.
Right panel: Period: 2018 Q1 – 2025 Q4. ULC projection from 2024 Q1, CPI-ATE and CPI-ATED projections from 2024 Q3.
A weaker krone exchange rate pushes up inflation – but by how much?
Considerable uncertainty is linked to the speed and magnitude of the pass-through from a given change in the krone exchange rate into consumer prices. Different estimates of the exchange rate pass-through are presented in this box based on three empirical models, as well as NEMO, Norges Bank’s main macroeconomic model. Initialised on a krone depreciation of 1%, the models suggest a price increase of around 0.1% to 0.35% after ten quarters.
The krone exchange rate has depreciated markedly in recent years, which has pushed up inflation. Norges Bank does not have a policy target for the krone, but the exchange rate is significant for both the inflation outlook and the real economy – and hence in interest rate setting. Even though there is a clear relationship between inflation and exchange rate fluctuations in both theoretical and empirical models, uncertainty remains in terms of how quickly the exchange rate effect kicks in, the duration of the effect and the magnitude of the final impact. Both the magnitude and duration are significant for Norges Bank’s inflation projections. Norges Bank therefore uses a broad set of models to analyse the effect the exchange rate has on inflation. This box presents some of these models and insights from these models of the exchange rate pass-through to inflation.
The krone exchange rate affects consumer prices through a number of channels. A weaker krone contributes to higher prices on imported consumer and intermediate goods. A krone depreciation will also lead to a rise in prices of domestic exports in NOK terms. This boosts profitability and the ability to pay, which can lead to higher wage growth and inflation.
A number of factors determine the speed and magnitude of the impact of krone depreciation on consumer prices. Some importers choose to hedge their purchases against foreign currency exposure, either through the use of financial instruments or long-term purchase agreements in NOK, which could dampen inflation in the short term. The short-term exchange rate pass-through could also be affected by the expected duration and magnitude of the exchange rate depreciation. Firms may have costs linked to product pricing changes that need to be weighed against the increased costs due to the exchange rate depreciation. Under less volatile and temporary exchange rate fluctuations, firms will thus have the option to hold prices stable. Consumer prices will, however, potentially be rapidly altered by large changes in the exchange rate assumed to be more persistent. Firms will also be more inclined to change prices frequently when inflation is already high, which may reinforce the exchange rate pass-through. The largest short-term consequence of a krone depreciation will be higher imported consumer goods prices, while indirect effects via increased input prices and wages will to a greater extent only become apparent later on.
This analysis explores the exchange rate pass-through to the consumer price index adjusted for tax changes and excluding energy products (CPI-ATE) using three different empirical models. The models differ from each other in terms of estimation methods, choice of explanatory variables and the extent to which they are supported by economic theory, as described in the box below. Use of theoretical constraints enables the identification of underlying, exogenous driving forces that affect the exchange rate. This assists in isolating the relationship between the exchange rate and inflation. The interpretation of the underlying factors behind a specific initial change in the exchange rate will, however, vary from model to model.
Brief description of the models1
The ECM model
This is an error correction model where CPI-ATE depends on the krone exchange rate (I-44), output gap projections, unit labour costs in mainland Norway, shipping freight rates and global producer prices on consumer and intermediate goods measured in foreign currency (IPK and IPI). Development in CPI-ATE are driven by short-term fluctuations of these variables and divergence from the long-term relationship between CPI-ATE and the levels of the explanatory factors. The estimated response shown in Chart 3.H shows the result of imposing a persistent krone exchange rate depreciation of 1%, while the other explanatory factors in the model are kept constant. The log is taken of all variables with the exception of the output gap.
The local projection model (LP)2
The LP-model is estimated on monthly data and consists of a set of equations specifying the change in CPI-ATE from month t to month t+h as a linear regression on the exchange rate and a set of control variables (policy rate, unemployment, oil price), one for each month, h. The estimated exchange rate regression coefficient, βh, therefore yields a direct estimate of the exchange rate pass-through h months in the future. The implied four-quarter changes in CPI-ATE inflation at various quarterly horizons are shown in Chart 3.H.
The SVAR model
This is a structural vector autoregressive model (SVAR) which captures dynamic (linear) relationships between a selection of variables. Variables included in SVAR are CPI-ATE, I-44, registered unemployment rate (NAV), GDP for mainland Norway, policy rate and unit labour costs for mainland Norway. The log is taken of all variables apart from registered unemployment and policy rates. This results in a system of six equations. An assumption is made that unexplained variation in the equations indicates different exogenous disturbances that can be explained in economic terms. By imposing some additional restrictions, a factor can be identified, or a “krone exchange rate shock”, which is closely linked to the krone exchange rate and is independent of other underlying factors. Chart 3.H shows the effect a change in this factor has on consumer prices. The factor is constricted to give an initial depreciation of the krone exchange rate of 1%.
- 1 A more detailed account of the models is available upon request and will eventually be published online as a separate technical appendix to the Monetary Policy Report.
- 2 See Jordà, Ò. (2005). "Estimation and Inference of Impulse Responses by Local Projections", American Economic Review, vol. 95(1), pages 161–182, March, for an account of the approach. An application of the exchange rate pass-through estimate can be found in: Carrière-Swallow, Y., M. Firat, D. Furceri and D. Jiménez (2023). "State-Dependent Exchange Rate Pass-Through," Working papers 106.
Impact of a one percent weaker exchange rate. Four-quarter change in CPI-ATE. Percentage points
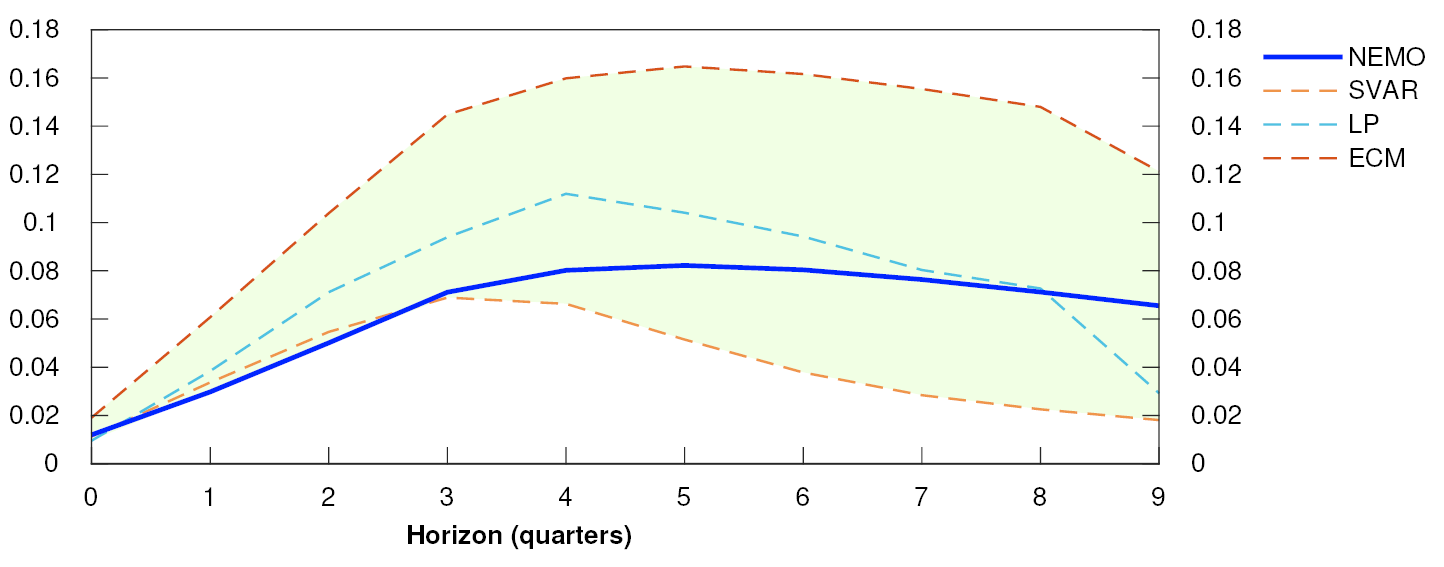
Chart 3.H shows the exchange rate pass-through to inflation according to the different models. The pass-through results from an exogenous exchange rate depreciation of 1% over 10 quarters. The pass-through from NEMO (Norges Bank’s main macroeconomic model) is also shown. The results vary both in terms of maximum impact and time profile. The ECM implies a relatively long-lived rise in inflation. The ECM estimates indicate that inflation is boosted by 0.16 percentage point after six quarters, while the SVAR model maximum reaches just under 0.07 percentage point in as little as four quarters. Cumulated over ten quarters, the estimates imply an exchange rate pass-through to the consumer price level spanning from 0.11% (SVAR) to 0.34% (ECM) (Table 3.B).
Tabell 3.B Pass-through to consumer prices (level) from a 1% krone depreciation over ten quarters
|
SVAR |
LP |
NEMO |
ECM |
|---|---|---|---|
|
0.11 |
0.17 |
0.18 |
0.34 |
The shaded interval provides an initial estimate of the uncertainty in evaluating the exchange rate’s impact on inflation across different time horizons. Additionally, there is also uncertainty regarding the pass-through estimates from each model. The difference in estimated responses can thus become significant if the krone exchange rate fluctuates considerably. According to NEMO, the short-term inflation impact is relatively moderate, but close to the average of the different model estimates in the medium term. A broad set of empirical models are used to estimate the short-term inflation path, in practice this usually provides estimates located around the mid-interval for the short-term exchange rate pass-through. Estimates are mainly based on NEMO later in the projection period. The estimates from NEMO are cross-checked against alternative empirical models.
As mentioned previously, a stronger relative effect on inflation might occur if exchange rate changes are sufficiently large (and presumed more permanent), especially when inflation is already high. Such non-linearity of the krone exchange rate pass-through is not well-captured by the models in this study.2 Therefore, it cannot be ruled out that the past krone depreciation has resulted in both a faster and more significant inflation pass-through than the estimates in Chart 3.H would suggest, meaning that the assumed contribution to inflation through the high inflation period from the krone depreciation can to some degree have been underestimated (Chart 3.15). Inflation has drifted down, and the exchange rate has been relatively stable over a period, albeit at a historically low level. Going forward, it is therefore assumed that the exchange rate pass-through will be well in line with the estimated model.
- 1 Change in four-quarter rise in the CPI-ATE in the quarter, t+h, as a result of a 1% depreciation of the effective krone exchange rate (I-44) in quarter, t. Percentage points.
- 2 Holm, M., (2014). “The exchange rate pass-through to consumer prices in Norway”, Staff Memo 4/14, Norges Bank finds some support for such non-linear effects to the krone exchange rate on imported consumer goods prices.
4. Monetary policy analysis
On balance, Norges Bank’s analyses indicate a policy rate path that is broadly unchanged from the June 2024 Monetary Policy Report. According to the model analysis, the path is pulled down by prospects for lower price and wage inflation ahead than previously envisaged and lower policy rates among Norway’s trading partners. In isolation, a weaker krone exchange rate and somewhat higher petroleum investment pull in the direction of a higher policy rate path.
4.1 The policy rate path and monetary policy objectives
The operational target of monetary policy is annual consumer price inflation of close to 2% over time. Inflation targeting shall be forward-looking and flexible so that it can contribute to high and stable output and employment and to countering the build-up of financial imbalances. The Monetary Policy and Financial Stability Committee’s monetary policy strategy is discussed further on Norges Bank’s web pages.
The policy rate forecast is broadly unchanged from the June Report. The policy rate was kept unchanged at 4.5% at the meeting of the Committee on 18 September. The forecast is little changed from the June Report but indicates a slightly faster reduction in the policy rate through 2025. The policy rate is projected to be 2.7% at the end of 2027.
The projections are uncertain. If the economic outlook, the balance of risks or the assessment of the functioning of the economy change, the policy rate may prove to be different from the one projected.
4.2 New information and assessments
Minor changes in the economic outlook
To shed light on how developments since the June Report affect the economic outlook, new information and assessments of the economic situation are incorporated into the Bank’s modelling system, while conditioning on the policy rate path from June. This exercise shows the forecasts that the modelling system would have produced with the policy rate path from June. Here the main focus is on the output gap and the inflation outlook.
In the exercise with the rate path from June, the capacity utilisation projection is little changed compared with the June Report (Chart 4.1). Consumer price inflation adjusted for tax changes and excluding energy products (CPI-ATE) has been lower than expected, and the exercise suggests lower inflation in the period to the end of 2025 compared with the June Report. Further out, key cost drivers are approximately unchanged from June.
Projections conditioned on new information concerning economic developments and the policy rate forecast in Monetary Policy Report 2/2024

Market policy rate expectations have fallen considerably
Market policy rate expectations further out can provide an indication of how market participants have interpreted new information and how they expect Norges Bank to react.
Policy rate expectations have fallen considerably since the June monetary policy meeting and are now below the rate path in the June Report in the years ahead (Chart 4.2). Towards the end of the projection period, market policy rate expectations are close to the path from June.
Policy rate. Percent
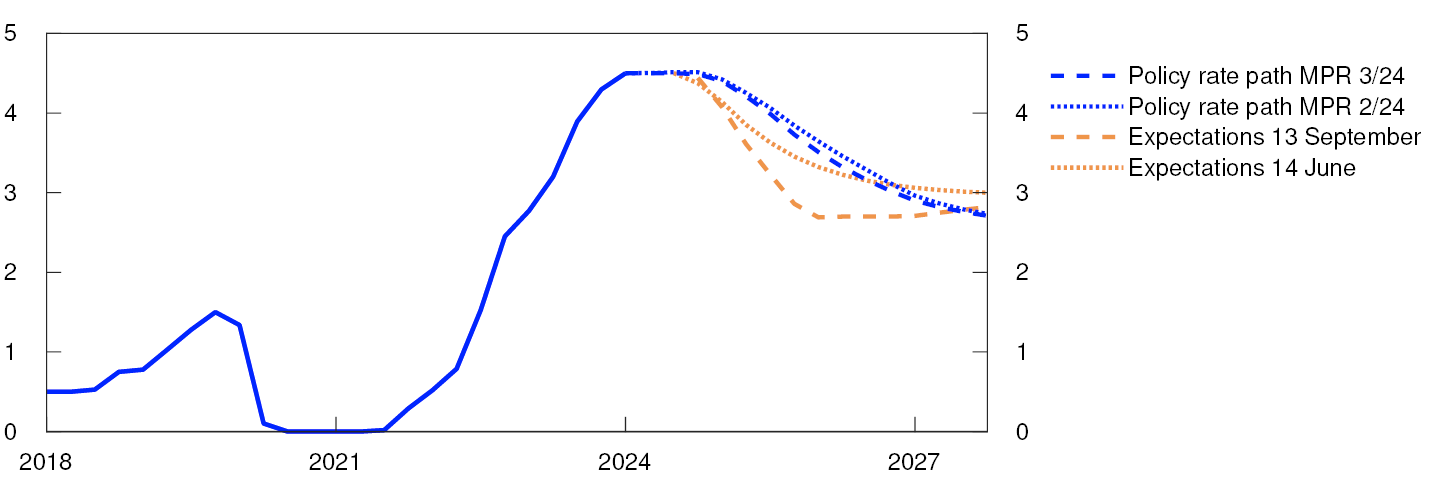
Some of the fall in Norwegian market interest rates may reflect the marked decline in market policy rate expectations among Norway’s main trading partners since the June Report (Chart 4.3). Expectations indicate more rapid rate reductions among trading partners than in Norway. Market expectations indicate that the policy rate differential will increase in the coming year before declining slightly but will remain positive throughout the forecast horizon.
Policy rates in Norway and among Norway’s main trading partners. Percent
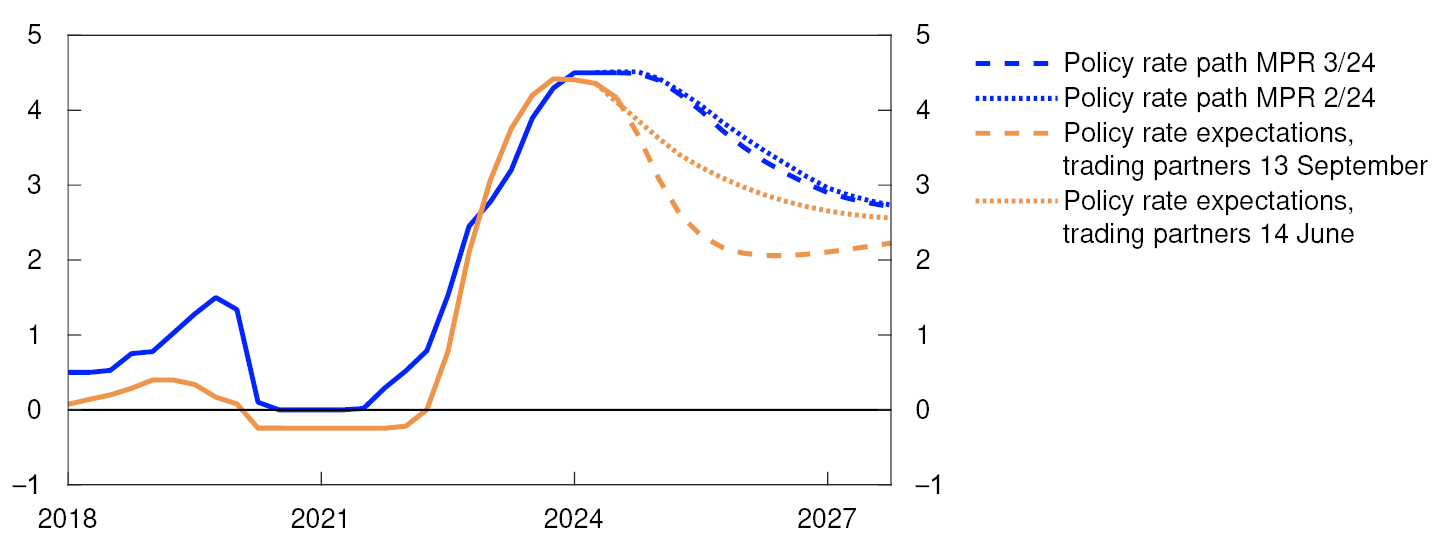
The simple rule indicates a lower policy rate compared with the June Report
A simple policy rate rule shows how the policy rate has historically correlated with the output gap and inflation (see Monetary Policy Report 2/2022). The simple rule indicates a lower policy rate in the coming quarters than the rule indicated in the June Report, reflecting the downward revision of inflation in the near-term and the fact that the output gap is little changed. The level is still higher than the policy rate forecast, but the difference is smaller than in the previous report (Chart 4.4).
Three-month money market rate. Percent
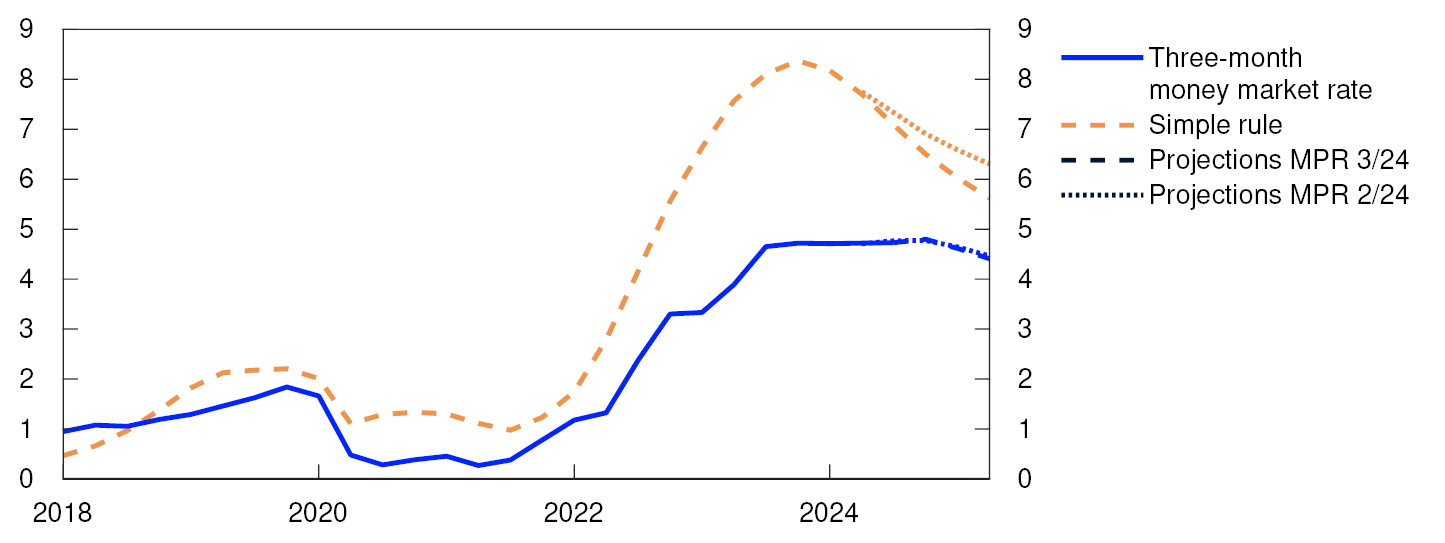
- 1 Period: 2018 Q1 – 2027 Q4. Projections from 2024 Q2 for MPR 2/24 and 2024 Q3 for MPR 3/24. CPI-ATE: CPI adjusted for tax changes and excluding energy products. The output gap is a measure of the percentage difference between mainland GDP and projected potential mainland GDP.
- 2 Period: 2018 Q1 – 2027 Q4. Expectations from 14 June for MPR 2/24. Expectations from 13 September for MPR 3/24.
- 3 Period: 2018 Q1 – 2027 Q4. Estimated forward rates from 14 June for MPR 2/24 and 13 September for MPR 3/24. The international policy rate is a trade-weighted average of the policy rates of the Bank of England, the ECB, the Federal Reserve and Sveriges Riksbank.
- 4 Period: 2018 Q1 – 2025 Q2. Projections from 2024 Q2 for MPR 2/24 and 2024 Q3 for MPR 3/24.
4.3 Monetary policy stance and drivers behind the changes in the policy rate path
Compared with the June Report, the policy rate forecast is broadly unchanged and near-term inflation projections have been revised down. This results in a somewhat higher forecast of the expected real money market rate in the period to the end of 2024 compared with the June Report (Chart 4.5). In the projections, the real interest rate for the coming years is higher than the estimated neutral level, which lies in the interval between 0% and 1% (see Monetary Policy Report 2/2024). Looking ahead, the policy rate declines somewhat faster than inflation so that the expected real interest rate declines. At the end of 2026, the real interest rate is projected at approximately 0.8%.
Estimate of the expected real money market rate. Percent
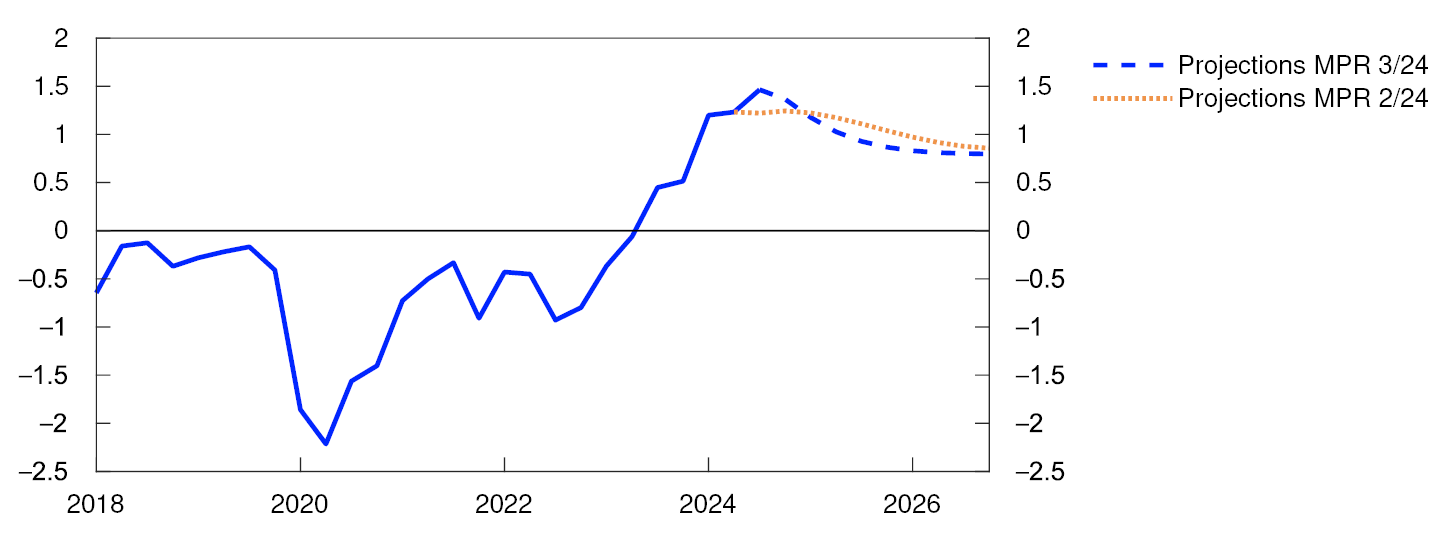
The forecasts indicate broadly unchanged trade-offs
The trade-offs between bringing inflation quickly back to target and promoting high and stable output and employment are expressed in the inflation and output gap forecasts. Chart 4.6 illustrates the trade-offs in this and previous reports. The points indicate the projections of the output gap and inflation (measured as the deviation from the inflation target) in different reports one to three years ahead. The location of the points in the chart depends on the economic shocks and the monetary policy response. In the theoretical literature, a common condition for making the right trade-offs is that inflation gap and output gap forecasts have opposite signs. For example, if both gaps were negative, inflation could approach the target and output could approach potential with a lower policy rate. In situations where other factors are given considerable weight, such as the risk of financial instability or uncertainty related to the effect of the policy rate, it may nevertheless be right for both gaps to have the same sign in the forecasts. Over the past two years, the forecasts for the two gaps have been in the northwestern quadrant, which means that output cannot be brought any further up towards potential without moving inflation further from the target. However, the points have gradually moved closer to the origin, suggesting prospects for somewhat improved overall forecasting performance.
Inflation gap and output gap. Average 1–3 years ahead
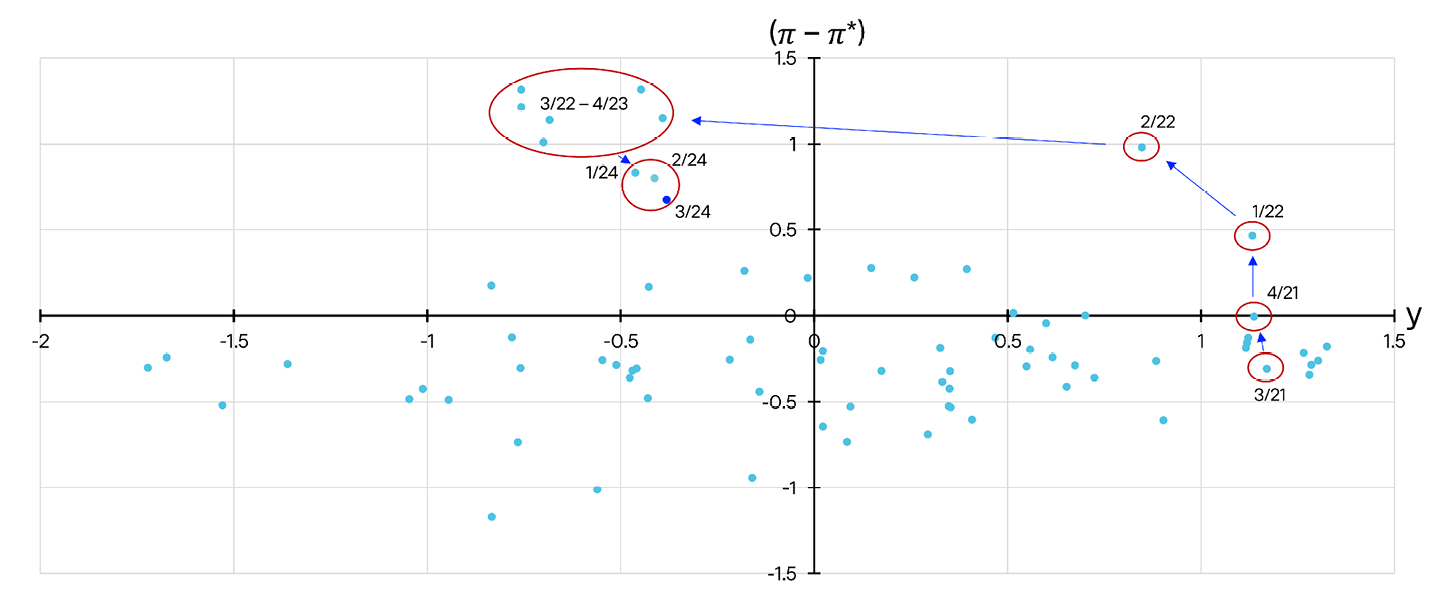
The model-based analysis implies a broadly unchanged policy rate path
In the decomposition in Chart 4.7, the Bank’s main model NEMO is used to break down the main drivers behind the changes in the policy rate path since the June Report. The bars show contributions to changes in the model-based path, and the broken line shows the sum of the bars. The solid line shows the actual change in the rate path.
Cumulative contributions. Percentage points

Market pricing now indicates lower international policy rates than envisaged earlier. This pulls in isolation in the direction of a stronger krone. The projections for inflation and economic growth among Norway’s trading partners are broadly unchanged since the June Report. Overall, external factors suggest a slightly lower model-based path (green bars).
Since the June Report, the projection for petroleum investment has been revised up and pulls in the direction of a higher model-based path. Petroleum prices have fallen since June, contributing in isolation to a slightly lower policy rate path by contributing to lower activity in oil-related industries and to dampening wage growth. Overall, factors relating to petroleum prices and investment contribute to a slightly higher model-based path (light blue bars).
The krone has been weaker than expected and weaker than implied by changes in both the interest rate differential against other countries and petroleum prices in the model framework. This pulls in the direction of a higher model-based path (dark blue bars).
Capacity utilisation is little changed since the June Report. Domestic demand pulls the model-based path down slightly in the coming quarters (orange bars).
Underlying inflation has been lower than projected in June. The wage growth projection for 2025 has been revised down compared with the June Report. Price and wage factors on the whole suggest a slightly lower model-based path (red bars).
The model analysis implies a broadly unchanged policy rate compared with the June Report.
- 5 Period: 2018 Q1 - 2026 Q4. The expected real interest rate is the projected money market rate over the next four quarters less expected CPI-ATE inflation over the same period. For Q3 and in the projection period, the expected real interest rate is estimated based on the projections in this Report. For all previous periods, the expected real interest rate is based on the most up-to-date Monetary Policy Report at the time in question.
- 6 The chart shows combinations of forecasts for the output gap (y) and inflation (Π) deviation from the target (Π*) on average one to three years ahead. Each point represents the forecasts in a specific Monetary Policy Report. Forecasting improves the closer the points are to origin, although the points will normally lie further from the origin following larger shocks. Their location in the diagram depends on the monetary policy stance. Often, but not always, a reasonable trade-off will entail a policy rate path that implies that the forecasts for the inflation gap and the output gap have opposite signs. The trade-offs from MPR 3/21 until MPR 3/24 are marked with red rings. Period: 2005 Q4 – 2024 Q3.
- 7 Period: 2024 Q4 – 2027 Q4. Projections. The contributions are based on model estimates from the NEMO model, but there is no mechanistic link between news and changes in the bars. The effect of news feeds through with a lag and the interaction between economic variables may result in a reversal of the effect over time. In addition, projections for the near term may entail news with different signs at different times. The effect on the rate path is therefore shown most clearly by the cumulative contributions.
Annex
Detailed tables of projections
TABLe 1 International projections
|
Change from projections in Monetary Policy Report 2/2024 in brackets |
Weights1 Percent |
Percentage change from previous year |
||||
|---|---|---|---|---|---|---|
|
2023 |
2024 |
2025 |
2026 |
2027 |
||
|
GDP |
||||||
|
US |
12 |
2.5 |
2.6 (0.3) |
1.8 (0) |
1.8 (0) |
1.7 (0) |
|
Euro area |
47 |
0.5 |
0.7 (-0.1) |
1.3 (-0.1) |
1.6 (0.1) |
1.5 (0) |
|
UK |
15 |
0.1 |
1.1 (0.2) |
1.3 (-0.1) |
1.5 (0) |
1.4 (-0.1) |
|
Sweden |
18 |
-0.1 |
0.6 (-0.2) |
1.8 (-0.2) |
2.2 (0.2) |
2.1 (0.2) |
|
China |
8 |
5.3 |
4.8 (-0.3) |
4.1 (-0.1) |
3.8 (0.1) |
3.6 (0) |
|
5 trading partners1 |
100 |
1 |
1.3 (-0.1) |
1.7 (-0.1) |
1.9 (0.1) |
1.8 (0) |
|
Prices |
||||||
|
Underlying inflation2 |
5.3 |
3 (0) |
2.3 (0) |
2.1 (-0.1) |
2.1 (0) |
|
|
Wage growth2 |
5 |
4.3 (0) |
3.5 (0) |
3.2 (0) |
3 (0) |
|
|
Prices for consumer goods imported to Norway, including freight rates3 |
-0.1 |
2.8 (1.5) |
0.5 (0.4) |
-0.2 (-0.7) |
0.6 (-0.2) |
|
Sources: LSEG Datastream and Norges Bank
Table 2a Consumer prices. Twelve-month change. Percent
|
2024 |
|||||||
|---|---|---|---|---|---|---|---|
|
Jun |
Jul |
Aug |
Sep |
Oct |
Nov |
Dec |
|
|
Consumer price index (CPI) |
|||||||
|
Actual |
2.6 |
2.8 |
2.6 |
||||
|
Projections MPR 2/24 |
3.1 |
3.4 |
3.7 |
4.6 |
|||
|
Projections MPR 3/24 |
3.1 |
2.6 |
2.6 |
3.1 |
|||
|
CPI-ATE |
|||||||
|
Actual |
3.4 |
3.3 |
3.2 |
||||
|
Projections MPR 2/24 |
3.6 |
3.7 |
3.6 |
3.8 |
|||
|
Projections MPR 3/24 |
3.3 |
2.9 |
3.0 |
3.0 |
|||
|
Imported consumer goods in the CPI-ATE |
|||||||
|
Actual |
2.0 |
1.4 |
2.0 |
||||
|
Projections MPR 2/24 |
2.3 |
2.2 |
2.2 |
2.3 |
|||
|
Projections MPR 3/24 |
1.8 |
1.2 |
1.0 |
0.8 |
|||
|
Domestically produced goods and services in the CPI-ATE |
|||||||
|
Actual |
4.2 |
4.3 |
3.8 |
||||
|
Projections MPR 2/24 |
4.4 |
4.6 |
4.4 |
4.5 |
|||
|
Projections MPR 3/24 |
4.0 |
3.8 |
3.9 |
4.2 |
|||
Sources: Statistics Norway and Norges Bank
Table 2b House prices. Monthly change. Seasonally adjusted. Percent
|
2024 |
|||||||
|---|---|---|---|---|---|---|---|
|
Jun |
Jul |
Aug |
Sep |
Oct |
Nov |
Dec |
|
|
Actual |
0.4 |
-0.1 |
0.5 |
||||
|
Projections MPR 2/24 |
0.6 |
0.4 |
0.4 |
0.4 |
|||
|
Projections MPR 3/24 |
0.3 |
0.3 |
0.2 |
0.2 |
|||
Sources: Eiendomsverdi, Finn.no, Real Estate Norway and Norges Bank
Table 2c Registered unemployment (rate). Percent of labour force. Seasonally adjusted
|
2024 |
|||||||
|---|---|---|---|---|---|---|---|
|
Jun |
Jul |
Aug |
Sep |
Oct |
Nov |
Dec |
|
|
Actual |
2.0 |
2.1 |
2.0 |
||||
|
Projections MPR 2/24 |
2.0 |
2.0 |
2.0 |
2.1 |
|||
|
Projections MPR 3/24 |
2.0 |
2.1 |
2.1 |
2.1 |
|||
Sources: Norwegian Labour and Welfare Administration (NAV) and Norges Bank
Table 2d GDP for mainland Norway. Quarterly change.1 Seasonally adjusted. Percent
|
2024 |
||||
|---|---|---|---|---|
|
Q1 |
Q2 |
Q3 |
Q4 |
|
|
Actual |
0.1 |
0.1 |
||
|
Projections MPR 2/24 |
0.2 |
0.3 |
||
|
Projections MPR 3/24 |
0.3 |
0.2 |
||
- 1 Quarterly figures based on monthly national accounts.
Sources: Statistics Norway and Norges Bank
Table 3 Projections of main economic aggregates
|
Change from projections in Monetary Policy Report 2/2024 in brackets |
Percentage change from previous year (unless otherwise stated) |
|||||
|---|---|---|---|---|---|---|
|
In billions of NOK 2023 |
2023 |
Projections |
||||
|
2024 |
2025 |
2026 |
2027 |
|||
|
Prices and wages |
||||||
|
CPI |
5.5 |
3.2 (-0.5) |
3.2 (0.0) |
2.8 (0.2) |
2.4 (0.1) |
|
|
CPI-ATE |
6.2 |
3.7 (-0.3) |
3.0 (-0.4) |
2.8 (0.0) |
2.4 (0.0) |
|
|
Annual wages |
5.2 |
5.2 (0.0) |
4.3 (-0.2) |
3.7 (-0.1) |
3.3 (-0.1) |
|
|
Real economy1 |
||||||
|
Gross domestic product (GDP) |
5131 |
0.7 |
1.6 (0.5) |
1.8 (-0.1) |
0.5 (0.1) |
0.5 (-0.1) |
|
GDP, mainland Norway2 |
3858 |
1.1 |
0.6 (-0.2) |
1.1 (-0.2) |
1.3 (0.1) |
1.5 (-0.1) |
|
Output gap, mainland Norway (level) |
0.8 |
0.1 (-0.1) |
-0.2 (0.0) |
-0.4 (0.1) |
-0.3 (0.0) |
|
|
Employment, persons, QNA |
1.3 |
0.6 (0.0) |
0.5 (-0.2) |
0.7 (0.1) |
0.8 (-0.1) |
|
|
Registered unemployment (rate, level) |
1.8 |
2.0 (0.0) |
2.2 (0.0) |
2.3 (0.0) |
2.2 (0.0) |
|
|
Demand1 |
||||||
|
Mainland demand2 |
4014 |
0.4 |
-0.4 (0.2) |
2.3 (-0.2) |
2.4 (-0.1) |
2.2 (-0.1) |
|
– Household consumption |
1924 |
-0.6 |
1.1 (-0.1) |
2.7 (0.0) |
2.2 (0.0) |
1.9 (-0.1) |
|
– Business investment |
499 |
4.0 |
-6.4 (3.4) |
0.5 (-1.3) |
2.4 (-0.6) |
2.7 (-0.6) |
|
– Housing investment |
208 |
-15.6 |
-16.2 (-0.4) |
4.0 (-1.1) |
9.6 (-0.4) |
8.3 (-0.9) |
|
– Public demand |
1383 |
3.3 |
2.1 (-0.3) |
2.2 (0.1) |
1.8 (-0.1) |
1.7 (0.1) |
|
Petroleum investment2 |
216 |
10.5 |
10.0 (1.0) |
1.0 (5.0) |
-5.0 (-2.0) |
-5.0 (-2.0) |
|
Mainland exports2 |
1043 |
7.8 |
1.7 (-3.5) |
4.9 (3.7) |
2.1 (0.6) |
2.7 (0.3) |
|
Imports |
1667 |
1.3 |
0.9 (0.3) |
3.2 (0.4) |
1.8 (-0.3) |
1.8 (-0.2) |
|
House prices and debt |
||||||
|
House prices |
0.2 |
2.9 (-0.4) |
5.4 (-1.5) |
8.1 (0.2) |
6.4 (-0.2) |
|
|
Household credit (C2) |
3.4 |
2.9 (0.3) |
2.8 (0.4) |
2.9 (0.6) |
3.2 (0.3) |
|
|
Interest rate, exchange rate and oil price |
||||||
|
Policy rate (level) |
3.5 |
4.5 (0.0) |
4.1 (0.0) |
3.3 (-0.1) |
2.8 (0.0) |
|
|
Import-weighted exchange rate (I-44) (level) |
119.5 |
120.2 (1.9) |
120.9 (3.4) |
120.7 (3.2) |
120.6 (3.1) |
|
|
Policy rate, trading partners (level) |
3.9 |
4.1 (-0.1) |
2.5 (-0.8) |
2.1 (-0.7) |
2.2 (-0.4) |
|
|
Oil price, Brent Blend. USD per barrel |
83 |
80 (-3) |
70 (-10) |
69 (-7) |
69 (-5) |
|
|
Household income and saving1 |
||||||
|
Real disposable income excl. dividend income |
-2.4 |
3.3 (0.5) |
2.2 (-0.2) |
3.0 (0.1) |
2.5 (-0.6) |
|
|
Saving ratio excl. dividend income (rate, level) |
-0.3 |
2.0 (0.6) |
1.9 (0.4) |
2.3 (0.4) |
2.8 (0.0) |
|
|
Fiscal policy |
||||||
|
Structural non-oil deficit as a percentage of GPFG3 |
3.0 |
2.7 (0.0) |
2.5 (0.0) |
2.5 (-0.1) |
2.5 (-0.1) |
|
|
Structural non-oil deficit as a percentage of trend GDP |
9.7 |
10.4 (0.0) |
10.7 (0.0) |
10.9 (-0.1) |
11.0 (-0.1) |
|
Sources: Eiendomsverdi, Finn.no, LSEG Datastream, Ministry of Finance, Norwegian Labour and Welfare Administration (NAV), Real Estate Norway, Statistics Norway and Norges Bank