Norges Bank’s Monetary Policy and Financial Stability Committee decided to keep the policy rate unchanged at 4.5% at its meeting on 19 June. Based on the Committee’s current assessment of the outlook and balance of risks, the policy rate will likely be kept at that level for some time ahead.
Lower international inflation
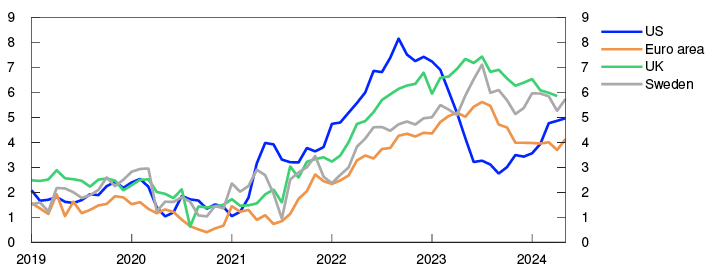
Consumer price inflation among Norway’s main trading partners has slowed considerably from its peak in 2022 and is now below 3% in a number of those countries. Goods inflation is low, while services inflation is still elevated. Economic growth picked up in Q1 and was somewhat higher than projected. Unemployment remains low in the euro area, the UK and the US, while it has risen in Sweden. Wage growth among our main trading partners has slowed, but with lower inflation, household purchasing power will nevertheless increase in many countries this year.
Consumer prices. Twelve-month change. Percent

Expectations of fewer interest rate cuts this year
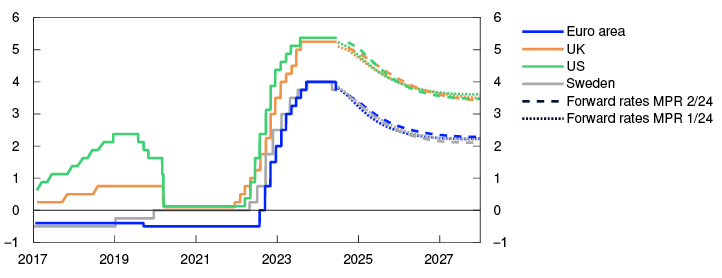
Since the March Report, central bank interest rates have been reduced in the euro area and Sweden, while they have been left on hold in the US and the UK. The market now expects fewer policy rate cuts in 2024. Long-term government bond yields among our main trading partners have shown little change.
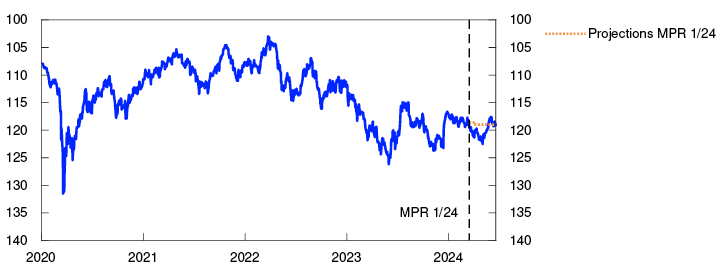
Norwegian policy rate expectations have risen a little. Market pricing indicates expectations of a policy rate cut towards the end of the year. The krone is a little stronger than in March and has recently been broadly as projected.
Import-weighted exchange rate index. I-44
Growth in the Norwegian economy remains low
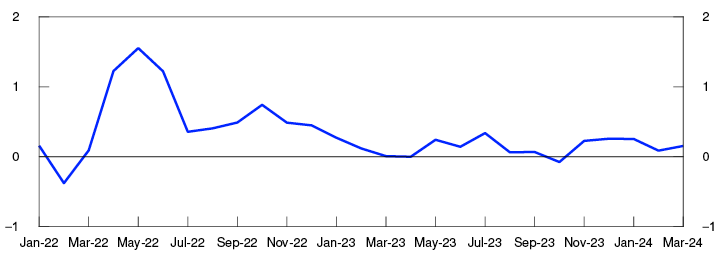
Growth in the Norwegian economy slowed last year and was also low in 2024 Q1. A decline in goods consumption contributed to a fall in household consumption, and housing investment declined further from a low level. Economic activity in Q1 was slightly higher than projected. The goods consumption index and card transaction data suggest that household consumption has picked up recently.
Norges Bank’s Regional Network enterprises overall report somewhat higher activity in Q2. In most industries, businesses have grown more optimistic than they were earlier this year and expect a further improvement in Q3. The construction industry expects a continued fall in activity. New home sales have edged up from a low level, but it will likely take time for housing investment to start rising again. In the secondary market, house prices have continued to rise and have been higher than expected.
GDP for mainland Norway. Three-month moving average. Percent
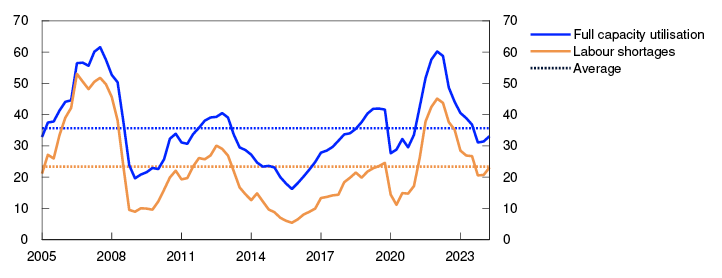
Pressures in the Norwegian economy have gradually receded since the beginning of 2023. At the beginning of 2024, output was likely close to potential and capacity utilisation appears to have remained broadly unchanged recently. Registered unemployment has increased slightly over the past couple of years but is still low. The increase in unemployment partly reflects a large number of Ukrainian refugees having registered as unemployed with the Norwegian Labour and Welfare Administration (NAV). In May, registered unemployment was 2%, as projected. Employment rose further in Q1 and was slightly higher than expected. Regional Network enterprises report that capacity utilisation has increased slightly in Q2 but is still lower than normal. They expect employment to increase further, and the number of new job vacancies has continued to increase according to NAV. Capacity utilisation in the economy appears to be slightly higher than anticipated.
Growth in the Norwegian economy is projected to be low in 2024, but activity is expected to be slightly higher than projected in the March Report. The combination of high wage growth and lower inflation will lift household purchasing power, which points to an increase in household consumption ahead. Strong petroleum investment, a further increase in exports and high public demand are expected to sustain activity in the Norwegian economy this year, while a decline in housing and business investment will dampen activity. Capacity utilisation is expected to drift down further in the coming year with output running at somewhat below potential.
Capacity utilisation and labour shortages according to the Regional Network. Percentage shares
Inflation above target
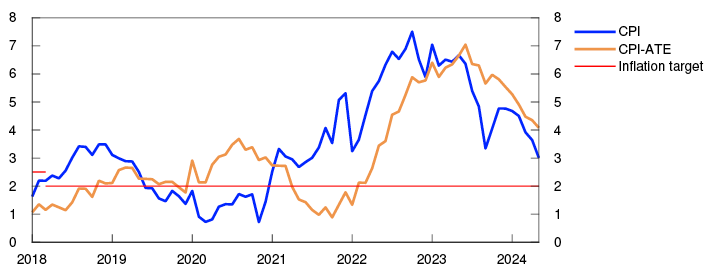
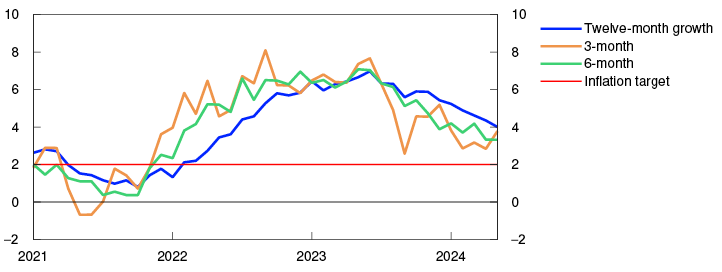
Inflation has slowed further since the March Report. In May, total consumer price inflation (CPI) was 3.0%, which was somewhat lower than projected. The 12-month rise in the CPI adjusted for tax changes and excluding energy products (CPI-ATE) was 4.1% in May. This was broadly as expected.
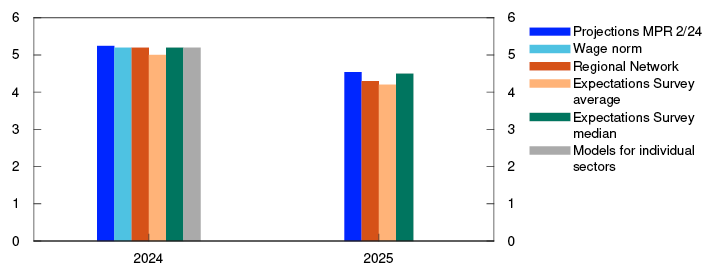
It appears that wage growth will be higher in 2024 and 2025 than projected in March. Annual wage growth in 2024 is now projected at 5.2%, which is in line with the negotiated wage norm in manufacturing. Regional Network enterprises have revised up their wage growth expectations for 2025. High wage growth, weak productivity growth and last year’s krone depreciation will likely contribute to keeping inflation elevated ahead.
According to the Expectations Survey, long-term inflation expectations are still somewhat higher than the inflation target of 2%, and expectations showed little change in Q2.
CPI and CPI-ATE. Twelve-month change. Percent
Unchanged policy rate at 4.5%
The operational target of monetary policy is annual consumer price inflation of close to 2% over time. Inflation targeting shall be forward-looking and flexible so that it can contribute to high and stable output and employment and to counteracting the build-up of financial imbalances.
The policy rate has been raised significantly in recent years and has contributed to cooling down the Norwegian economy. Growth in the economy has slowed, and price inflation has declined. At the same time, the employment-to-population ratio is high. Inflation is still running above target, and the rapid rise in business costs will contribute to keeping inflation elevated ahead. The Committee was concerned with the possibility that if the policy rate is lowered prematurely, inflation could remain above target for too long.
Since the March Report, inflation has been a little lower than projected, while unemployment has increased as expected. On the other hand, Regional Network enterprises report improved prospects, and it appears that wage growth will be higher than envisaged earlier. This could mean that inflation will be higher ahead than projected in the March Report. The Committee judges that the policy rate is sufficiently high to bring inflation down to target within a reasonable time horizon, but that there will be a need to maintain a tight monetary policy stance for somewhat longer than previously projected.
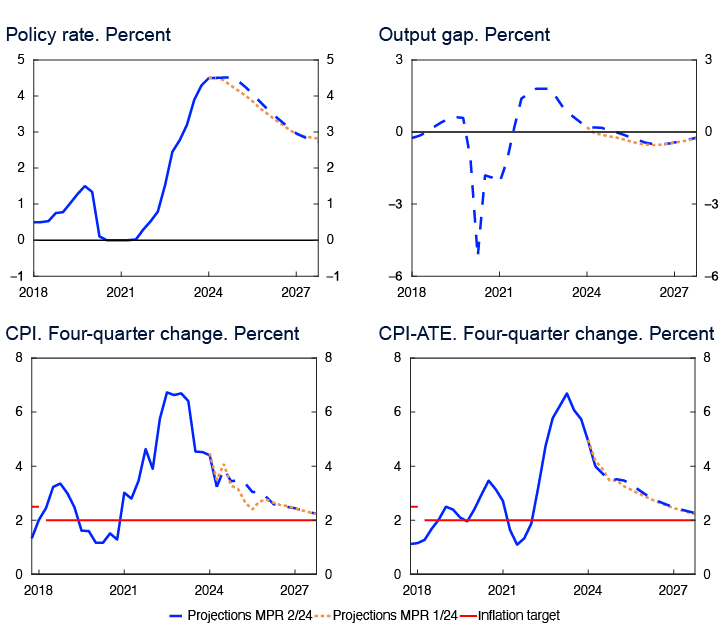
The forecast in this Report indicates that the policy rate will continue to lie at 4.5% to the end of the year, before gradually being reduced. Economic growth is projected to pick up a little in the years ahead, but unemployment is likely to edge up. Inflation is projected to decline further and approach 2% towards the end of 2027.
There is uncertainty about future developments in the Norwegian economy. If capacity utilisation increases or the krone depreciates, wage and price inflation could remain elevated for longer. In that case, there may be a need to raise the policy rate. If unemployment rises more than expected, or price inflation declines more rapidly, the policy rate may be lowered earlier than currently envisaged.
The Committee decided unanimously to keep the policy rate unchanged at 4.5%. Based on the Committee’s current assessment of the outlook and balance of risks, the policy rate will likely be kept at that level for some time ahead.
Ida Wolden Bache
Pål Longva
Øystein Børsum
Ingvild Almås
Steinar Holden
19 June 2024
1 Period: January 2018 – May 2024.
2 Period: 1 January 2020 – 18 June 2024. A higher I-44 index indicates a weaker krone exchange rate. The scales are inverted.
3 Period: January 2022 – March 2024.
4 Period: 2005 Q1 – 2024 Q2. Share of contacts that will face some or considerable difficulty meeting increased demand and share of contacts citing labour shortages as a constraint on production. The question about labour shortages is asked only of the enterprises reporting full capacity utilisation, but the series shows the share of all contacts included in the interview period.
5 Period: January 2018 – May 2024. CPI-ATE: CPI adjusted for tax changes and excluding energy products.
6 Period: 2018 Q1 – 2027 Q4. Projections from 2024 Q1 for MPR 1/24 and 2024 Q2 for MPR 2/24 for the policy rate, the CPI and the CPI-ATE. The output gap measures the percentage deviation between mainland GDP and estimated potential mainland GDP. CPI-ATE: the CPI adjusted for tax changes and excluding energy products.
1. The global economy
High inflation, together with a rapid rise in policy rates, dampened economic activity through 2023. Partly owing to improved household purchasing power, overall GDP growth among Norway’s trading partners is projected to pick up in 2024.
Since the peak, consumer price inflation among Norway’s trading partners has slowed markedly, but services inflation remains high in a number of countries. Core inflation is projected to slow further but not as fast as in 2023. The market expects that central banks abroad will lower their policy rates later than expected in March.
Core inflation expected to decline further
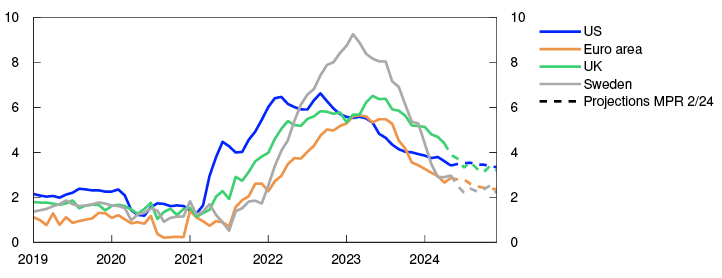
After peaking at the end of 2022, headline inflation has fallen considerably among all of Norway’s main trading partners. Since the end of 2023, headline inflation has shown little change and was around 2.5% in the euro area and Sweden, and just over 3% in the US in May.
Core inflation has moved down to around 3% in the euro area and Sweden, and to around 3.5% in the US (Chart 1.1). Overall, core inflation among Norway’s main trading partners has been broadly as projected in the March 2024 Monetary Policy Report.
Core CPI. Twelve-month change. Percent
In recent months, goods inflation has declined to a low level (Chart 1.2). Services inflation remains elevated in a number of countries (Chart 1.3), partly reflecting the strong growth in wages. In the US, both rental prices and other services have contributed to a pickup in services inflation since autumn 2023. Underlying inflation is expected to decline in Europe in the coming months and to remain virtually unchanged in the US.
Wage growth and price inflation for trading partners as a whole will likely drift down in the years ahead on the back of low capacity utilisation. Wage growth among Norway’s main trading partners is projected to decline from 4.9% in 2023 to 4.3% in 2024. Long-term market inflation expectations have shown little change since the March Report and are close to both US and euro area inflation targets. Overall underlying inflation among main trading partners is projected to slow from 5.3% in 2023 to 3% in 2024 and to slightly above 2% in 2026. The projections for wage growth and price inflation are little changed since the March Report (see Annex Table 1).
Consumer prices. Goods excluding food and energy. Twelve-month change. Percent

Consumer prices. Services. Twelve-month change. Percent
Expectations of fewer policy rate cuts in 2024
Since the March Report, both the European Central Bank and Sveriges Riksbank have reduced policy rates by 0.25 percentage point, against the background of easing inflation as it moves closer to target. In addition, Sveriges Riksbank gave weight to weak GDP growth over several quarters and the rise in unemployment. The Federal Reserve and the Bank of England have kept policy rates on hold.
Market policy rate expectations indicate that the first policy rate cuts in the US and the UK will take place this autumn. The market now expects policy rate cuts further out in time than expected in March (Chart 1.4), reflecting market expectations that it will likely take somewhat longer to return inflation to target. Long-term government bond yields among trading partners are little changed since March.
Policy rates and estimated forward rates. Percent
Equity indexes among main trading partner countries have risen slightly since the March Report, while corporate bond risk premiums have held steady.
International growth has picked up
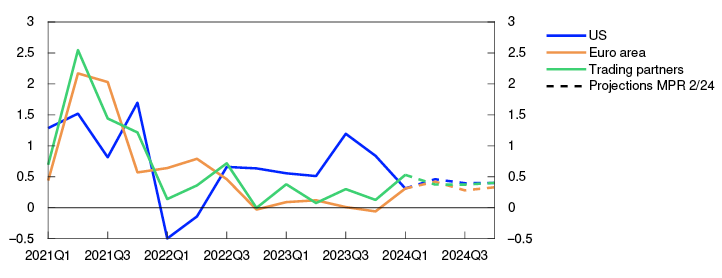
Total output among Norway’s main trading partners appears to be below potential. Unemployment remains low in the euro area, while it has risen in Sweden over the past year. In 2024 Q1, GDP growth for trading partners as a whole picked up and was higher than projected in the March Report, with a strong upturn in the euro area, Sweden and the UK, while growth slackened in the US (Chart 1.5).
GDP. Quarterly change. Percent
The fall in real wages and higher interest rates dampened economic activity in Europe in 2023. Lower consumer price inflation will lead to an increase in real wages ahead, which will improve household purchasing power. Higher defence spending and energy investment will also likely boost activity. Activity indicators have risen, pointing to sustained growth ahead.
In the US, GDP growth was significantly higher than in Europe through 2023, amid low household saving, disinflation, fiscal stimulus and strong productivity and population growth. In addition, the high proportion of long-term fixed-rate loans has largely shielded many US households against increases in residential mortgage rates. Growth slowed at the beginning of 2024, as projected. Household saving is expected to pick up further out, which will likely pull down GDP growth ahead.
Despite a continued weak real estate market, stronger growth in manufacturing output and exports has lifted growth in China in recent quarters. Growth will likely slow ahead on the back of a declining labour force, high debt levels facing the local government sector and state-owned firms, and higher tariffs on Chinese exports.
Commodity prices are assumed to move in line with futures prices. Energy and commodity prices are further discussed in “Higher energy and commodity prices”. Norges Bank’s projections of international policy rates are based on market policy rate expectations. Trading partner GDP growth is projected to rise from 1% in 2023 to 1.4% in 2024 and to 1.8% in 2025 and 2026. The projection for 2024 has been revised up since the March Report. The output gap will likely remain slightly negative in the coming years.
Uncertainty surrounding inflation ahead
There is still uncertainty related to how quickly consumer price inflation among Norway’s trading partners will return to target. With tight labour markets in a number of countries, wage earners may be granted larger inflation-compensating wage increases than envisaged. In that case, or if inflation expectations were to rise, wage growth and price inflation could prove higher than currently projected. Heightened trade conflicts and the climate and energy transition also add to the uncertainty about disinflation. For example, more frequent extreme weather events could lead to higher food inflation. To bring inflation down to target, central banks may have to keep policy rates higher for longer than currently assumed, which could weaken growth prospects. The ongoing wars in some countries also add to the uncertainty about international developments ahead.
Higher energy and commodity prices
Prices for gas, carbon allowances and electricity on the continent have risen since March, while oil prices show little change. After peaking in 2022, energy prices have decreased considerably but are expected to remain high compared with the 10-year period preceding the pandemic. The rise in Norges Bank’s price indexes for intermediate goods and consumer goods imported to Norway has slowed. The projections for a further rise in the price indexes have been revised up since the March Report, partly reflecting higher futures prices for some commodities.
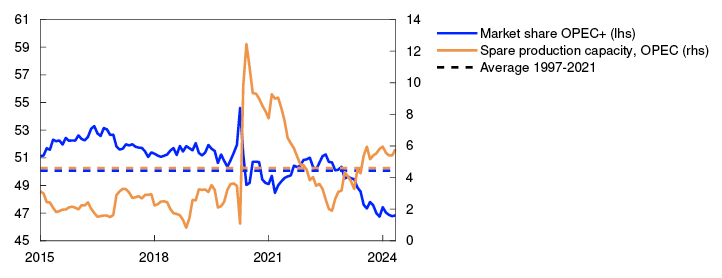
Oil and futures prices show little change since the March Report. Oil prices are still affected by the risk of a potential escalation of the regional conflict in the Middle East. At the beginning of June, OPEC+ extended production cuts, which have underpinned oil prices in recent years.1 It was nevertheless signalled that some of the production cuts would be gradually reversed from autumn. The cuts have led to ample spare production capacity in OPEC+ countries, and their market share is now low (Chart 1.A). This may make it difficult to maintain the production cuts ahead. Futures prices indicate some further fall in oil prices in the coming years (Table 1.A).
Share of global crude oil production. Percent
European gas prices have risen since the March Report. Futures prices have also risen, particularly for 2025 and 2026. Gas inventories are at a high level for this time of year. On the other hand, Asian gas imports are expected to increase as a result of higher economic activity, resulting in a decrease in the supply of liquid natural gas (LNG) to Europe ahead. There are also signs that the decline in energy-intensive manufacturing in Europe may be reversing. In addition, whether the remaining gas imports from Russia via Ukraine to Europe will be continued at the end of 2024 is uncertain. Higher gas prices have been accompanied by a rise in carbon allowance prices and thus also a rise in electricity prices on the continent. Moreover, demand for emission allowances and power may increase when activity in energy-intensive manufacturing picks up.
Electricity prices in Norway have fallen since March, to a greater degree in northern Norway than in southern Norway. Electricity prices in southern Norway are most closely correlated to electricity prices on the continent and in the UK. The decline in Norwegian electricity prices partly reflects snow melting and higher water reservoir levels. Futures prices have risen together with electricity futures prices on the continent.
European energy prices have come down considerably since peaking in 2022. Except for oil, futures prices nevertheless indicate higher price levels ahead than in the period 2010–2019. In the transition from a fossil-based to a renewable energy system, a large portion of energy consumption needs to be electrified, and electricity production needs to become emission free. Energy prices (including emission prices) may remain elevated, for at least a transition period, to promote necessary investment in new energy production and greenhouse gas emission reductions. At the same time, energy prices will likely be more volatile, partly owing to more weather-dependent energy production and international conflicts that may affect energy production.
Metal prices have risen since March and futures prices indicate a further rise in the coming years, reflecting a pickup in economic activity, including in a number of emerging economies. An increased need for metals for the climate and energy transition is also pushing up metal prices.
Since the March Report, developments in Norges Bank’s indicator of international price impulses to imported intermediate goods (IPI) have been broadly as expected (Chart 1.B). Looking ahead, the IPI projections are higher than in the March Report, partly owing to the increase in aluminium prices (Table 1.A.). The 12-month change in the IPI index is still negative but is expected to increase more quickly and to a greater extent than projected in the March Report. Further out in the projection period, the rise in the IPI is projected to remain close to its historical average.
The index of international price impulses for imported consumer goods (IPK) has also moved broadly in line with the projections in the March Report (Chart 1.B). Even though the IPK captures prices further out in the value chain than the IPI, it is also affected by commodity price developments. For example, higher food prices (Table 1.A) will contribute to boosting the IPK further out. Slightly stronger inflationary impulses from imported consumer goods are expected in the coming period than in the March Report.
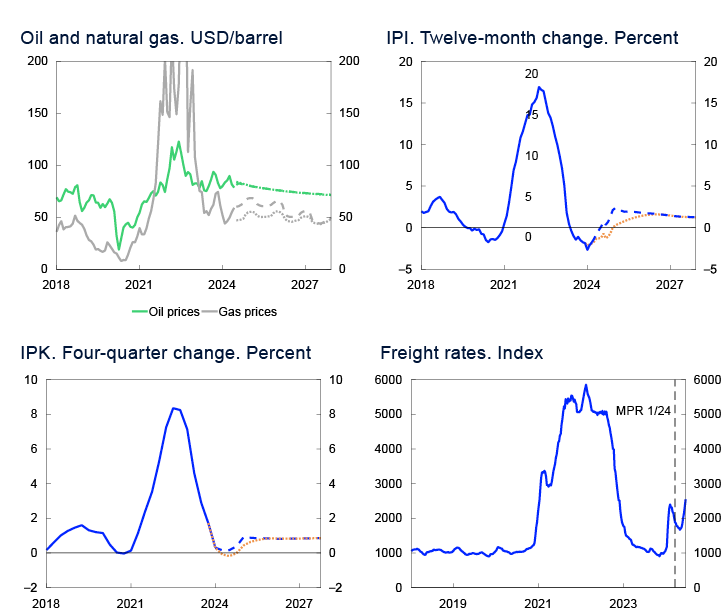
Freight rates have come down from the high rates during the pandemic. Over the past six months, freight rates have rebounded, partly due to tensions in the Red Sea and drought in the Panama Canal. Supply disturbances in the shipping market are assumed to be temporary, but it is now expected that it will take longer than assumed in the March Report for the disturbances to dissipate and the rates to move down again.
Table 1.A Commodity prices
|
Percentage change from projectionsin Monetary Policy Report 1/2024 in brackets |
Average price (2010–2019) |
Actual prices and futures prices4 |
|||||
|---|---|---|---|---|---|---|---|
|
2022 |
2023 |
2024 |
2025 |
2026 |
2027 |
||
|
Oil, USD/barrel |
80 |
101 |
83 |
82 (-1) |
78 (0) |
75 (0) |
72 (0) |
|
Dutch gas, USD/barrel |
40 |
205 |
70 |
57 (18) |
64 (21) |
55 (12) |
48 (4) |
|
Petroleum5, USD/barrel |
63 |
163 |
77 |
70 (3) |
71 (7) |
65 (4) |
61 (2) |
|
Coal, EUR/tonne |
66 |
290 |
118 |
105 (7) |
113 (12) |
114 (12) |
114 (13) |
|
Carbon allowance prices, EUR/tonne |
10 |
81 |
84 |
65 (12) |
70 (15) |
73 (16) |
75 (14) |
|
German electricity, øre/kWh |
36 |
258 |
116 |
92 (17) |
106 (16) |
95 (16) |
84 (13) |
|
Nordic electricity, øre/kWh |
32 |
142 |
66 |
51 (1) |
52 (16) |
50 (14) |
50 (7) |
|
Electricity in South Norway, øre/kWh |
31 |
206 |
84 |
62 (0) |
65 (10) |
62 (9) |
61 (3) |
|
Electricity in Northern Norway and Central Norway, øre/kWh |
32 |
38 |
43 |
39 (5) |
35 (11) |
37 (20) |
37 (9) |
|
Aluminium, in USD/tonne |
1945 |
2706 |
2255 |
2447 (7) |
2617 (8) |
2676 (6) |
2705 (3) |
|
Copper, in USD/tonne |
6761 |
8829 |
8486 |
9437 (6) |
9875 (8) |
9862 (8) |
9802 (8) |
|
Steel, in USD/tonne |
463 |
722 |
622 |
590 (1) |
600 (2) |
- |
- |
|
Wheat, USD/tonne |
210 |
202 |
331 |
224 (8) |
248 (9) |
249 (6) |
- |
|
Maize, USD/tonne |
183 |
143 |
271 |
176 (0) |
190 (-1) |
191 (0) |
187 (0) |
1 OPEC+ consists of 12 OPEC countries and 10 non-OPEC countries, see OPEC: Member Countries and “What is OPEC+ and how is it different from OPEC?” (U.S. Energy Information Administration (EIA))
2 Period: January 2015 – May 2024.
3 Period: January 2018 – December 2027. For oil and gas prices, projections for MPR 2/24 and MPR 1/24 are futures prices. International price impulses to imported intermediate goods (IPI). External price impulses to imported consumer goods (IPK). All series are measured in international currency terms.
4 Futures prices at 14 June 2024.
5 An estimated Norwegian petroleum export price. The price has been estimated based on the share of oil and gas in historical export figures.For futures prices, oil and gas shares are calculated on the basis of expected market prices.
Sources: LSEG Datastream and Norges Bank
1 Period: January 2019 – December 2024. Projections from May for the UK and from June for theother countries. Core CPI is consumer prices excluding energy and food products for the US, excluding energy, food, tobacco and alcoholic beverages for the euro area and the UK, and excluding energy products for Sweden.
2 Period: January 2019 – May 2024. Data up to April for the UK.
3 Period: January 2019 – May 2024. Data up to April for the UK. Consumer prices for services exclude owner-occupiers’ estimated housing costs.
4 Period: 1 January 2017 – 31 December 2027. Daily data through 14 June 2024. Quarterly data from 2024 Q2 for MPR 1/24 and 2024 Q3 for MPR 2/24. Estimated forward rates at 15 March for MPR 1/24 and at 14 June for MPR 2/24. For the euro area, ECB’s deposit facility rate is shown.
5 Period: 2021 Q1 – 2024 Q4. Projections from 2024 Q2 for MPR 2/24. Export weights. Five trading partners.
2. Financial conditions
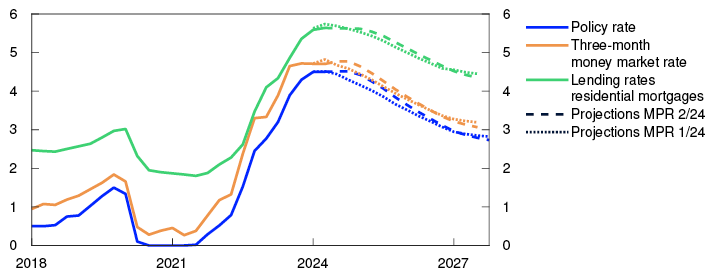
The market-implied path for the Norwegian policy rate has increased somewhat since the March Report, and the markets have now priced in that the policy rate will be lowered towards the end of the year. Residential mortgage rates have edged higher and are projected to decline gradually in 2025. The krone exchange rate is expected to remain slightly stronger ahead than projected in the March Report.
Market expectations of an unchanged policy rate for somewhat longer
Market policy rate expectations rose somewhat after the publication of the March Report. The policy rate was kept unchanged at 4.5%, but the policy rate forecast was somewhat higher than expected and contributed to a rise in market interest rates. Since then, the expectations of the first policy rate cut have been pushed a little further out in time, reflecting developments in the Norwegian economy and market expectations that interest rates among many trading partners will be held high for a little longer than envisaged earlier. The market-implied path for the Norwegian policy rate is now lower than the forecast in this Report for the next few years and somewhat higher further out (Chart 4.2).
Residential mortgage rates have risen somewhat less than projected
The average interest rate on outstanding floating and fixed-rate residential mortgages was 5.6% at end-April. Residential mortgage rates have risen somewhat less than projected in the March Report. The lower pass-through from the policy rate to the residential mortgage rate likely reflects a further decline in credit demand and keen bank competition for residential mortgages. Strong profitability gives banks room to compete on price in order to retain market share. Some banks have reduced their mortgage rates slightly since March. In addition, market participants are pricing in that the Nibor premium will remain somewhat lower in the period ahead than previously assumed. This will then contribute to slightly lower expected funding costs for banks. Residential mortgage rates are projected to remain close to the current level in the coming quarters before gradually declining when the policy rate is lowered from next year (Chart 2.1).
Interest rates. Percent
According to Norges Bank’s bank lending survey, household credit standards remained unchanged in Q1 and are expected to remain unchanged in Q2.
The average interest rate on households’ bank deposits was 3.1% at end-April. In the first period of the interest rate rise, the deposit rate increased considerably less than the policy rate, but since last autumn they have risen more in tandem. Deposit rates are expected to rise slightly further ahead on the back of increasing bank competition for deposits.
Slight fall in corporate lending rates
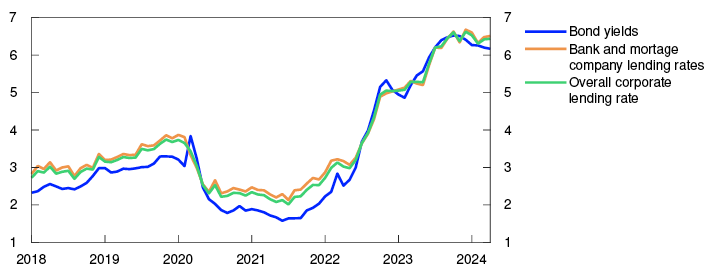
The interest rate on new floating-rate corporate loans was 6.4% in April, measured as a weighted average of bank and bond debt, which was slightly lower than at the time of the March Report (Chart 2.2).
Interest rate on new floating-rate NOK finance loans for non-financial corporates. Percent
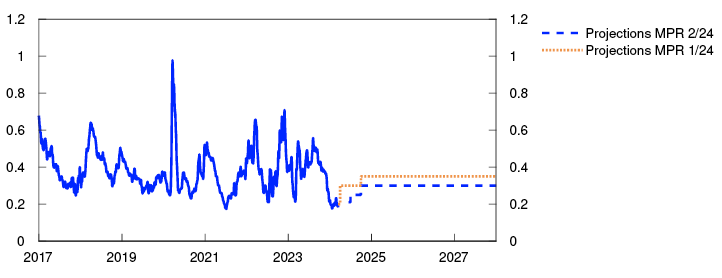
The interest rate on corporate bank loans is based on three-month Nibor, which has remained broadly unchanged since the March Report given little change in the expected policy rate over the next three months and a steady Nibor risk premium. The premium is markedly lower than the average for the past 10 years and lower than projected in the March Report. The market is now pricing in that the premium will remain lower in the years ahead than in March. This is probably due to expectations of more ample liquidity conditions in the banking system ahead due to the proposed changes to the government’s liquidity management system. The premium is projected to increase somewhat ahead, but to a slightly lower level than projected earlier (Chart 2.3).
Money market premium. Percentage points
The lending margin over NIBOR on new corporate bank loans was slightly lower in April than three months earlier. Together with an approximately unchanged Nibor rate, this means that the interest rate on new corporate loans has fallen somewhat so far this year. According to Norges Bank’s bank lending survey, corporate credit standards remained unchanged in Q1 and are also expected to remain unchanged in Q2.
Long-term swap rates form the basis for long-term, fixed-rate corporate bond yields. Swap rates have fallen a little since the March Report. The corporate credit premiums paid on top of the swap rates have also fallen for all sectors since March. Overall, the interest paid by firms on new long-term fixed-rate bonds has fallen. Issue activity in the corporate bond market has increased markedly since March.
The equity market is also a source of corporate funding. The Oslo Børs Benchmark Index has advanced by about 8% since the March Report. Most of the sub-indexes have risen, with the largest gains for energy and shipping amid higher commodity prices and freight rates.
Financial conditions have tightened somewhat since March on the back of market expectations that the policy rate will be held high for longer. The Financial Conditions Index (FCI) summarises other financial conditions of importance to households, banks and other firms (Chart 2.4), and now indicates that other financial conditions are overall somewhat looser than the average of the past 20 years. The largest contribution to the decline in the index comes from low premiums in money and credit markets.
Financial Conditions Index. Standard deviation from mean

Slightly stronger krone exchange rate ahead
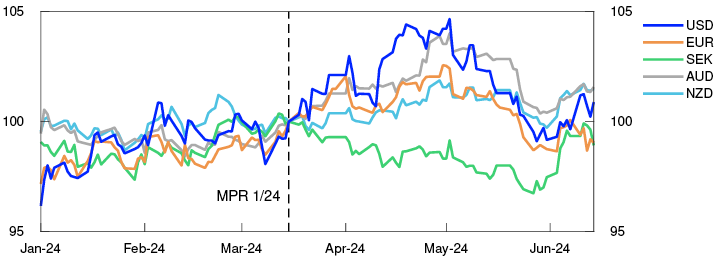
The krone exchange rate has fluctuated somewhat since the March Report. Up to end-April, the krone depreciated against the currencies of most of Norway’s main trading partners but appreciated again in May. Overall, the krone exchange rate is slightly stronger against the euro and the Swedish krona and slightly weaker against the US dollar, Australian dollar and New Zealand dollar than in March (Chart 2.5).
Index. 15 March 2024 = 100
Measured by the import-weighted index I-44, the krone was for a long time weaker than our projection for Q2, but the exchange rate level is now broadly as projected. The average krone exchange rate in Q2 appears to be somewhat weaker than projected in March (Chart 2.6).
Since the March Report, there has been no significant change in the interest rate differential between Norway and trading partners. The interest rate differential has increased slightly for the year ahead but decreased a little in the longer term. The movement in domestic and international interest rates is consistent with only a small change in the krone exchange rate measured by I-44 since March.
The krone is projected to appreciate slightly in the near term given a somewhat higher policy rate forecast in this Report than the market-implied policy rate path. Thereafter, the krone exchange rate is assumed to remain approximately unchanged throughout the projection period. This implies a slightly stronger krone than in the March Report. Consumer price inflation in Norway is projected to be somewhat higher than among trading partners over the next few years. The real krone exchange rate, which shows relative consumer price inflation in Norway and internationally measured in a common currency, is thus projected to appreciate somewhat more.
1 Period: 2018 Q1 – 2027 Q4. Projections from 2024 Q1 for MPR 1/24 and from 2024 Q2 for MPR 2/24. The residential mortgage rate is the average rate on outstanding mortgage loans to households from the sample of banks and mortgage companies included in Statistics Norway’s monthly interest rate statistics.
2 Period: January 2018 – April 2024.
3 Period: 1 January 2017 – 31 December 2027. Five-day moving average. Latest observation on 14 June 2024. Projections from 2024 Q1 for MPR 1/24 and 2024 Q2 for MPR 2/24. The premium in the Norwegian money market rate is the difference between the three-month money market rate and the expected policy rate.
4 Period: 1 January 2021 – 14 June 2024. The Financial Conditions Index (FCI) provides an overall picture of the price and availability of different types of financing beyond that indicated by the policy rate and future policy rate expectations. The FCI provides an indication of how tight or how loose financial conditions are, compared with the average from 3 January 2003 – 14 June 2024. A higher index value indicates tighter financial conditions. For more on the Norwegian FCI, see Monetary Policy Report 4/2022 and Bowe, F., K.R. Gerdrup, N. Maffei-Faccioli and H. Olsen (2023): “A high-frequency financial conditions index for Norway”, Norges Bank Staff Memo 1/2023.
5 Period: 1 January 2024 – 14 June 2024. For all currencies in the chart, the exchange rate is against NOK. 15 March 2024 = 100. An increase in the series means that NOK has depreciated against the foreign currency.
3. The Norwegian economy
Inflation has fallen substantially since end-2022 but is still above the 2% target. Registered unemployment is low but has risen slightly since 2023. The employment-to-population ratio is high.
The past interest rate increases are dampening activity in the Norwegian economy. Together with weak international price impulses, this will contribute to pushing down inflation ahead. Unemployment is expected to rise somewhat.
3.1 Output and demand
Low growth in the mainland economy
After rising rapidly in 2022, growth slowed in 2023. In 2024 Q1, mainland GDP rose by 0.2%, slightly more than projected in the March 2024 Monetary Policy Report.
Overall, the enterprises in Norges Bank’s Regional Network expect higher activity ahead (Chart 3.1). There are wide differences across industries, but many industries have revised up their output expectations. One exception is oil services, where capacity constraints among many enterprises provide limited scope for further growth. Services contacts report higher household and business sector demand and expect growth ahead to be broadly in line with the projection in March. Construction is the only sector that still expects lower activity ahead, but the decline is expected to be somewhat less pronounced than contacts envisaged in winter. The decline in construction has also weighed down on activity in some manufacturing sectors and retail trade. Looking ahead, a large number of contacts expect activity related to energy transition to boost output. After having reported falling activity over the past two years, retail trade contacts expect weak but positive growth in 2024 Q2 and Q3.
Expected output growth according to the Regional Network. Seasonally adjusted. Percent

In line with the Regional Network survey and the Bank’s System for Model Analysis in Real Time (SMART), a moderate rise in economic activity is expected over the coming quarters. The rise in mainland GDP for 2024 is projected at 0.8%. In the projection, increased exports, private consumption and public demand are the primary contributors to mainland economic growth in 2024, while a decline in both business and housing investment dampens activity (Chart 3.2). Mainland GDP projections have been revised up for 2024 and are little changed for the years ahead compared with the March Report.
GDP for mainland Norway. Annual change. Contribution to annual change. Percentage points

Higher real wage growth could boost consumption
Household consumption fell in 2024 Q1 and has been weaker than expected in the March Report, primarily reflecting low car sales and electricity consumption. Goods consumption rose in April owing in part to a sharp rise in car sales. Consumption for other product groups also increased somewhat in April. Card transaction data suggest that goods consumption rose further in May. Services consumption showed a slight increase in Q1, primarily owing to increased consumption of culture and leisure services. Card transaction data also indicate a rise in services consumption in April and May. Regional Network contacts in household services and retail trade expect a rise in Q2 and continued growth in the period to autumn.
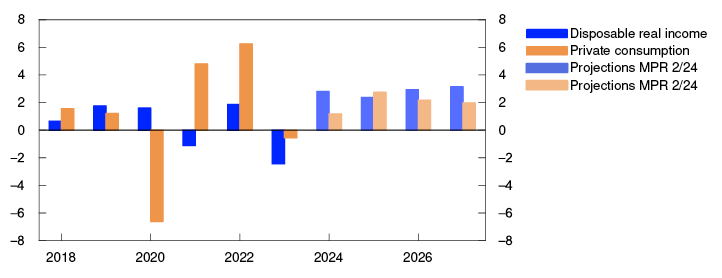
Household real disposable income rose substantially in 2024 Q1. Owing to prospects for higher real wages and employment, household real disposable income is projected to rise further in 2024. Higher purchasing power is expected to boost growth in household consumption (Chart 3.3). Projections for both real disposable income and household consumption in the coming years are higher than in the March Report. In the wake of the pandemic, the saving ratio has been low. Adjusted for pension saving, the saving ratio was negative in 2023, which indicates that households have maintained consumption either by drawing on savings or by borrowing. Looking ahead, households are expected to increase consumption less than the rise in income so that saving rises. The saving ratio projection for 2024 has been revised up compared with the March Report but is little changed for the years ahead.
Real disposable income and private consumption. Annual change. Percent
Continued fall in housing investment
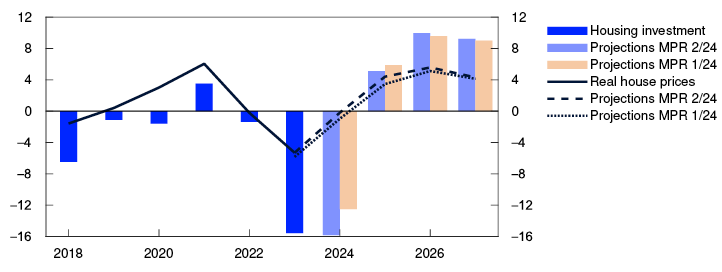
So far in 2024, turnover in the secondary housing market has been high and the stock of unsold homes has fallen back to more normal levels. House prices have risen substantially through spring, which may reflect increased purchasing power and expectations that interest rates have peaked. House prices are expected to continue to rise in the period ahead. Further out, higher house prices are expected to rise on the back of a low supply of new homes, higher real wages and lower residential mortgage rates. House prices are projected to increase somewhat more throughout the projection period than envisaged in March.
Housing investment fell more than expected in 2024 Q1. High construction costs and interest rates have weighed on the profitability of many projects and resulted in few housing construction project starts. In addition, prices in the primary housing market have risen more than in the secondary market over the past few years. Following a rise in new home sales during the pandemic, turnover fell markedly in 2022. The decline continued through 2023 and likely bottomed out in winter. So far in 2024, new home sales have edged up, although turnover remains low. It will also take some time for residential construction projects that have now been sold to be launched, suggesting a further fall in housing investment in the coming quarters. In the period to end-2024, higher new home sales and real house prices are expected to contribute to a slight rise in housing investment (Chart 3.4). Further ahead, higher population growth and lower interest rates further out will also lift housing investment.
Housing investment and real house prices. Annual change. Percent
Household interest burdens have increased considerably
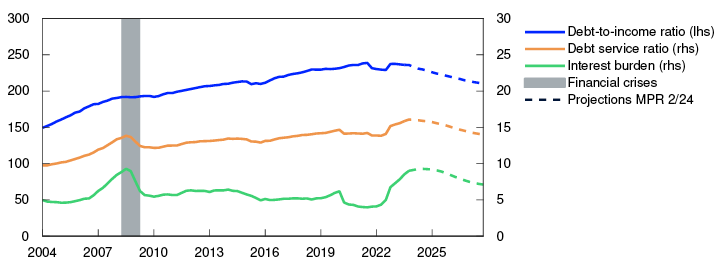
Household debt ratios are high, but household debt growth has slowed since summer 2023, reflecting higher interest rates and low residential construction. High debt, primarily at floating rates, has contributed to a marked increase in household interest expenses (Chart 3.5). Low household debt growth is projected in the years ahead and, combined with prospects for higher real disposable income, is expected to reduce household debt burdens further out in the projection period. The interest burden will likely remain at a high level in 2024, but lower debt ratios and a decrease in the policy rate will thereafter contribute to a gradual decrease in the interest burden.
Percent
Decline in business investment in 2024
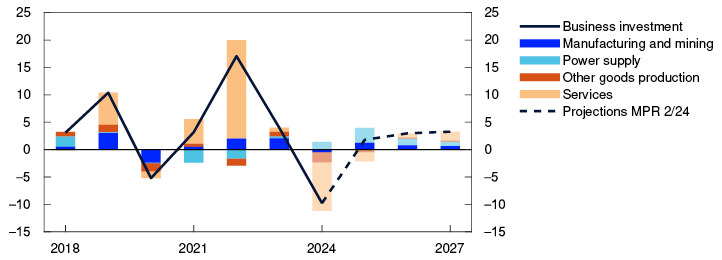
Mainland business investment rose substantially in the period between 2020 and summer 2023 but has fallen in recent quarters. The fall must be viewed in the light of higher interest rates, high cost growth and strong investment growth in 2021 and 2022. Investment is expected to pick up somewhat in 2024 H2 but to remain considerably lower in 2024 than in 2023. Service sector investment in particular is weighing on the projection for overall business investment (Chart 3.6). The decline is dampened by a strong increase in power sector investment ahead, according to Statistics Norway’s investment intentions survey. Investment in both manufacturing and the power sector is set to increase as part of the climate and energy transition. Overall business investment is projected to increase moderately in the years ahead, in line with information from the Regional Network.
Business investment in mainland Norway. Annual change. Contribution to annual change. Percentage points
Investment in the oil and gas sector rose markedly in 2023 after having fallen in the preceding three years. Investment is projected to increase almost as much in 2024. The strong growth in investment in 2023 and 2024 reflects the launch of a number of development projects in autumn 2022 owing to the petroleum tax package and high oil and gas prices. Investment in these projects is expected to decline in the coming years, and the decline will likely not be fully offset by investment in new development projects (Chart 3.7). Petroleum investment is therefore expected to begin declining from 2025. Petroleum investment projections are little changed from the March Report.
Petroleum investment. Constant 2024 prices. In billions of NOK

Moderate export growth ahead
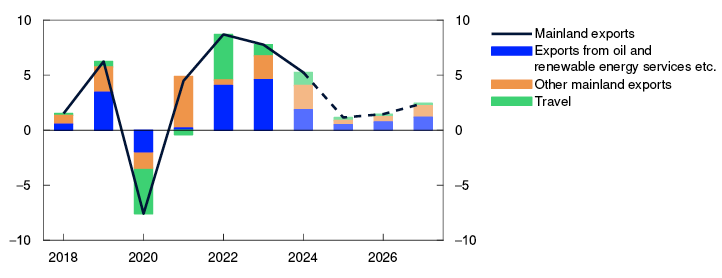
Mainland exports have expanded rapidly over the past two years, driven primarily by a weak krone, increased tourism in Norway in the wake of the pandemic and higher investment in oil, gas and green technology outside Norway. The same factors are expected to lead to solid export growth in 2024, but contributions from tourism, the krone exchange rate and global petroleum investment are expected to wane thereafter (Chart 3.8). On the other hand, exports will likely be boosted by higher growth abroad and increased demand for Norwegian defence technology.
Mainland exports. Annual change. Contribution to annual change. Percentage points
Following rapid growth in 2022, imports fell through much of 2023. Import growth is projected to moderate in 2024 before picking up further out in the projection period, reflecting prospects for higher mainland growth.
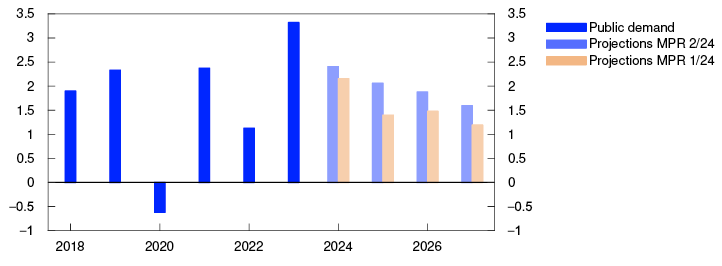
Strong growth in public demand
In recent years, growth in public demand has been higher than projected in Norges Bank’s Monetary Policy Reports. According to the Government’s proposed revised national budget, fiscal policy in 2024 has a slightly more expansionary effect on the economy than the budget adopted in autumn. The upward revisions primarily reflect increased investment in defence, security, police and contingency arrangements. Growth in public demand has been revised up slightly in 2024, in line with the Revised National Budget (Chart 3.9). According to estimates in the Revised National Budget, the structural non-oil budget deficit will increase in 2024 but decline as a share of the Government Pension Fund Global (GPFG). Further out in the projection period, growth in public demand is assumed to be higher than mainland economic growth. The value of the GPFG has increased substantially in recent years, which means that the withdrawal percentage will remain relatively stable at just above 2.5% in spite of high growth in public demand.
Public demand. Annual change. Percent
The projections are uncertain
The projections for the Norwegian economy are uncertain. Following a period of low growth in the Norwegian economy, Norges Bank’s Regional Network contacts now report improved prospects, which may indicate an upswing in the Norwegian economy and higher growth ahead than currently envisaged. At the same time, there are wide differences. This makes it difficult to interpret overall growth prospects for the economy. Housing investment has fallen considerably in recent years and business investment has also fallen since summer 2023. These parts of the economy are highly sensitive to policy rate changes. Monetary policy operates with a lag and investment may fall more than assumed.
In recent years, households have drawn down savings to maintain consumption. If household saving rises more sharply than envisaged, consumption could turn out weaker than assumed. On the other hand, a marked rise in household real disposable income is expected in 2024, which may contribute to a sharper rise in consumption.
SMART – System for Model Analysis in Real Time
The System for Model Analysis in Real Time (SMART) is Norges Bank’s platform for forecasting models.1 In SMART, forecasts from a broad set of different models are weighted based on their historical forecasting properties. The SMART forecasts of mainland GDP have been revised up and the projections for the CPI adjusted for tax changes and excluding energy products (CPI-ATE) are little changed since the March Report.
Model forecasts are an important tool for assessing the outlook for the Norwegian economy but will not necessarily be identical to the Bank’s final projections. For example, deviations may be due to judgement-based assessments of conditions that currently seem different from what the historical relationships imply.
The SMART forecasts of four-quarter CPI-ATE inflation are little changed compared with the March Report (Chart 3.A, left panel). SMART still indicates that inflation will decline ahead, albeit at a slightly more gradual pace than projected in March. The modelling system forecasts a four-quarter inflation rate of 4.0% in 2024 Q2 and 3.7% in 2024 Q3.
Four-quarter change. Percent
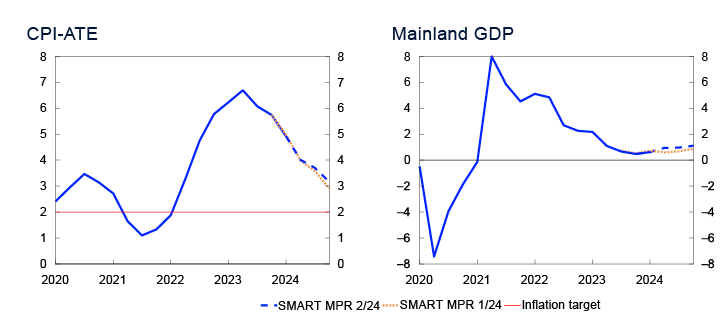
The SMART mainland GDP forecasts are somewhat higher than in the March Report (Chart 3.A, right panel). The modelling system forecasts four-quarter growth of 0.9% in 2024 Q2 and 1.0% in Q3. The upward revision reflects the upward revision of the Regional Network’s growth outlook.
1 Bowe, F., I.N. Friis, A. Loneland, E. Njølstad, S.S. Meyer, K.S. Paulsen and Ø. Robstad (2023) “A SMARTer way to forecast”. Staff Memo 7/2023. Norges Bank
2 Period: 2020 Q1 – 2024 Q4. CPI-ATE: CPI adjusted for tax changes and excluding energy products. Projections from 2024 Q1 for MPR 1/24 and from 2024 Q2 for MPR 2/24. The SMART modelling system for short-term projections is based on historical relationships. It combines empirical models based on previous forecasting properties.
1 Surveys 1/24 and 2/24. Expected growth current and next quarter.
2 Period: 2018–2027. Projections from 2024. Here, the data for petroleum investment include investment in international shipping. Public demand = Public consumption + Public investment.
3 Period: 2018–2027. Projections from 2024. Disposable income is deflated by the CPI.
4 Period: 2018–2027. Projections from 2024. House prices are deflated by the CPI.
5 Period: 2004 Q1 – 2027 Q4. Projections from 2024 Q2 for MPR 2/24. Debt-to-income ratio is debt as share of disposable income. Disposable income is after-tax income less interest expenses. Debt service ratio is interest expenses and estimated principal paymnets on loan debt as a percentage of after-tax income.
6 Period: 2018–2027. Projections from 2024.
7 Period: 2018–2027. Projections from 2024. Data for 2018–2023 from Statistics Norway’s investment intentions survey, deflated by the price index for petroleum investment in the national accounts. The price index is projected to increase by 5% in 2024 and by 2% in 2025.
8 Period: 2018–2027. Projections from 2024.
9 Period: 2018–2027. Projections from 2024. Public demand = Public consumption + Public investment.
3.2 Labour market
Employment is still high
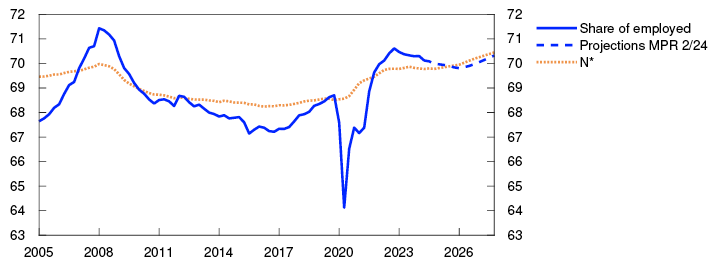
The employment-to-population ratio is high and registered unemployment is low (Chart 3.10). Employment growth slowed through 2023 but picked up again in 2024 Q1. Employment has been slightly higher than projected in the March Report.
Employment to population ratio. 15–74 years. Percent
Employment growth is unevenly distributed across sectors, with the largest increase in private sector employment. In 2024 Q1, employment rose particularly in the private sector. The increase was broad based, with the exception of the construction industry where employment is still falling.
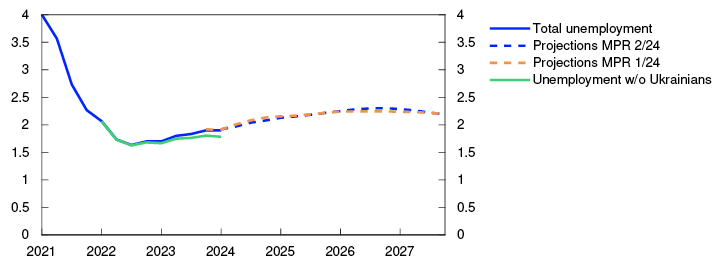
Unemployment has edged up from its lowest level in summer 2022 (Chart 3.11). The increase has likely been dampened by the decline in the number of temporary foreign workers in Norway, many of which have worked in construction, where unemployment has risen. Adjusted for normal seasonal variations, registered unemployment rose to 2.0% in May, as projected in the March Report. The level remains lower than before the pandemic. Close to a third of the rise in unemployment since summer 2022 reflects the fact that Ukrainian refugees have registered as unemployed with the Norwegian Labour and Welfare Administration (NAV).
Unemployed as share of the labour force. Seasonally adjusted. Percent
The Labour Force Survey (LFS) indicates weaker developments than other labour market indicators. LFS unemployment has risen over the past two years and was 4.0% in April. The difference between NAV unemployment and LFS unemployment can largely be explained by the fact that the LFS better captures unemployed youths aged 15 to 19.
Higher labour demand
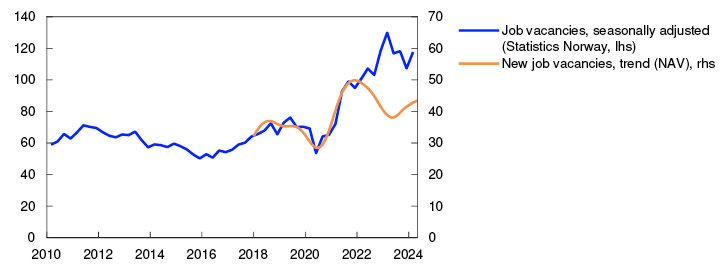
Labour demand has risen since the beginning of 2024, reflected for example in NAV’s statistics on new job vacancies, which show a rise in vacancies so far in 2024. According to Statistics Norway’s sample vacancy survey, the stock of vacancies also increased in Q1. Both sets of statistics show that the number of job vacancies is high and above the pre-pandemic level (Chart 3.12).
Number of job vacancies in thousands
Prospects for continued high employment
Employment is expected to continue to drift up in the period to end-2024. According to register-based data, the number of wage earners fell in April, but information from both the Regional Network and the Expectations Survey indicate a rise in employment in the coming quarters.
In the longer term, employment growth is expected to increase as economic growth shows a renewed rise. In the coming years, the number of temporary foreign workers is also expected to rise again somewhat, in pace with a rebound in construction activity.
The employment-to-population ratio is projected to edge lower in 2024 and 2025, and the employment rate is expected to pick up again on the back of higher employment growth further ahead (Chart 3.10).
In the projections, labour force growth outpaces employment growth and unemployment increases somewhat ahead. Many Ukrainian refugees are assumed to register as job seekers in the years ahead, likely pushing up unemployment somewhat as it may take some time for them to find work (see discussion in the box on the output gap below). The unemployment projections are little changed since the March Report.
Signs of output levelling off near potential
The positive output gap has narrowed over the past year and is now close to potential. Overall capacity utilisation is expected to remain broadly unchanged to the end of 2024, before declining and running somewhat below potential to the end of the projection period. The projections have been revised up somewhat for this year and next and are little changed thereafter.
Capacity utilisation, or output gap, is a measure of the intensity with which the economy makes use of its resources. The output gap is defined as the percentage difference between actual output and potential output in the mainland economy. Potential output is determined by productivity growth and the highest sustainable level of employment consistent with low and stable wage and price inflation, hereinafter referred to as N*. Many of the variables used to estimate the output gap cannot be observed and are therefore uncertain. The Bank estimates the output gap based on an overall assessment of various indicators and models, where particular weight is given to labour market developments.
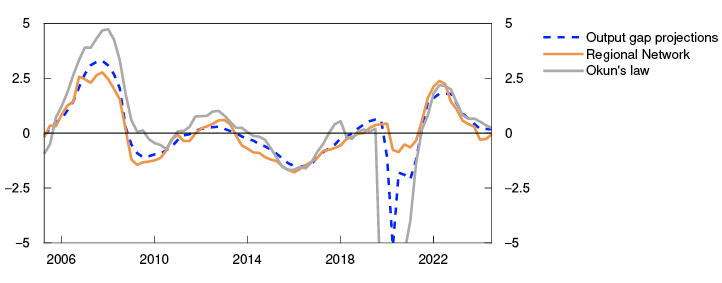
Output declined through 2023, after having been well above potential in 2022 (Chart 3.B). Growth in the Norwegian economy was weak in 2023 and unemployment edged up. Through 2023, the share of Norges Bank’s Regional Network contacts reporting capacity constraints and labour shortages fell. So far in 2024, there are fewer signs that capacity utilisation will continue to decline. More recent information could indicate that the decline in capacity utilisation has halted. The share of Regional Network contacts reporting capacity constraints and labour shortages has increased but is still somewhat below potential. The number of job vacancies has edged up since the beginning of the year. Registered unemployment has risen somewhat but is still lower than the level consistent with potential output. Overall, this indicates that capacity utilisation will be higher in 2024 than projected in the March Report.
Percent
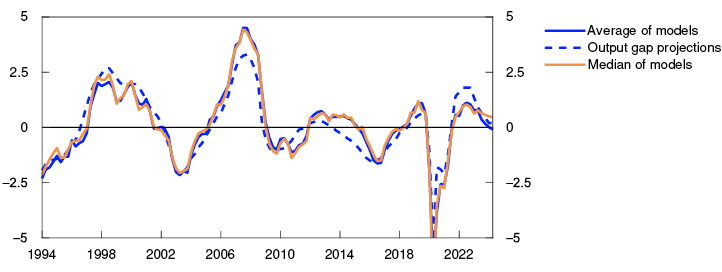
The average of the models in Norges Bank’s modelling system for the output gap indicates that capacity utilisation has declined further in 2024.2 One of the models that uses real credit growth now projects particularly low capacity utilisation. This is because real credit growth has been very low recently. The median of the models gives a higher estimate. Most of the models in the system yield a positive output gap, and the median estimate indicates small changes in capacity utilisation in the recent period (Chart 3.C).
Percent
In 2025, output is expected to increase less than potential output so that unemployment edges up and capacity utilisation declines. The output gap is projected to bottom out at -0.5% in 2026. Compared with the March Report, the projections are somewhat higher for 2024 and 2025 and little changed thereafter.
Over the past couple of years, there has been a large inflow of Ukrainian refugees, with additional inflows expected this year and next, according to official projections. It is estimated that in 2025 Ukrainians will account for close to 2% of the population in Norway aged 15 to 74, contributing to an increase in overall labour supply. Some have already found work. At the same time, a steadily rising number of Ukrainians has registered as unemployed with the Norwegian Labour and Welfare Administration (NAV), which has contributed much of the increase in registered unemployment over the past year (Chart 3.13). It is assumed that it takes some time for Ukrainians to find employment. Given the large number of Ukrainians registered with NAV, unemployment is projected to be a little higher over the next few years than the employment and capacity utilisation projections would normally suggest. A reversal is expected further out as Ukrainians are integrated to a greater extent in the labour market.
In recent years, there has been weak growth in productivity in aggregate and across most sectors. Regional Network contacts report continued low productivity growth in 2024 Q2 and also expect weak productivity developments in Q3. Some of the recent weakness in productivity growth is likely due to the slowdown in the economy, and productivity growth is assumed to pick up gradually ahead. Overall, the projection of potential economic output is little changed (Table 3.A).
There is substantial uncertainty associated with the capacity utilisation projection. Some of the data point to somewhat stronger pressures in the Norwegian economy and possible increase in capacity utilisation ahead. If capacity utilisation increases in the near term, wage growth may turn out to be higher next year. On the other hand, growth in the Norwegian economy is low in a historical context. If potential output increases more than currently envisaged, either due to a further increase in N* or a faster increase in productivity growth, capacity utilisation could fall faster, and wage growth prove lower next year.
Tabell 3.A Output and potential output4
|
Change from projections in Monetary Policy Report 1/2024 in brackets |
Percentage change from previous year |
|||||
|---|---|---|---|---|---|---|
|
1995–2009 |
2010–2023 |
2024 |
2025 |
2026 |
2027 |
|
|
GDP, mainland Norway |
3.1 |
1.9 |
0.8 (0.3) |
1.3 (0.1) |
1.2 (-0.1) |
1.6 (0.0) |
|
Potential output |
3.1 |
1.8 |
1.4 (0.1) |
1.6 (0.1) |
1.5 (0.0) |
1.4 (0.0) |
|
N* |
0.8 |
1.2 |
0.9 (0.1) |
1.1 (0.1) |
0.9 (0.0) |
0.8 (0.0) |
|
Trend productivity |
2.3 |
0.7 |
0.5 (0.0) |
0.5 (0.0) |
0.6 (0.0) |
0.6 (0.0) |
1 Period: 2005 Q2 – 2024 Q3. Regional Network is a direct estimate of the output gap based on the average of the capacity utilisation indicators in the Regional Network and the historical correlation with Norges Bank’s output gap projection where the Regional Network indicator leads by one quarter. Okun’s law is based on an estimated deviation from the trend in registered unemployment as a percentage of the labour force.
2 The modelling system consists of a set of models and is based on information about variables such as mainland GDP, the labour market, wage growth, business investment as a percentage of mainland GDP, domestic inflation, house prices and credit. For a detailed description of the models, see Furlanetto, F., K. Hagelund, F. Hansen and Ø. Robstad (2022) “Norges Bank Output Gap Estimates: Forecasting Properties, Reliability, Cyclical Sensitivity and Hysteresis”. Oxford Bulletin of Economics and Statistics, 85(1), pp 238–267.
3 Periode: 1994 Q1 – 2024 Q2. For a more detailed description of the models, see Furlanetto, F., Hagelund, F. Hansen and Ø. Robstad (2022) “Norges Bank Output Gap Estimates: Forecasting Properties, Reliability, Cyclical Sensitivity and Hysteresis.” Oxford Bulletin of Economics and Statistics, 85(1), pp 238–267.
4 The contributions from N* and trend productivity do not necessarily sum exactly to the annual change in potential output due to rounding.
1 Period: 2005 Q1 – 2027 Q4. Projections from 2024 Q2. N* is an estimate of the highest level of employment that can be maintained over time without driving up wage and price inflation.
2 Period: 2021 Q1 – 2027 Q4. Projections from 2024 Q1 for MPR 1/24 and from 2024 Q2 for MPR 2/24.
3 Period: Statistics Norway: 2010 Q1 – 2024 Q1. NAV: January 2018 – May 2024. As a result of missing data in NAV’s statistics at the start of 2018, only data since January 2018 are shown.
3.3 Prices and wages
Higher wage growth in 2024
Wage growth is high after having risen gradually in the years following the pandemic, amid high inflation, a tight labour market and strong profitability in some business sectors. In this year’s wage negotiations, the wage norm was set at 5.2% for manufacturing. Many of the bargaining areas have now concluded wage negotiations, where a corresponding wage norm has been agreed.
The wage norm for manufacturing is important for wage growth in other sectors. At the same time, sector-specific conditions may also have a bearing, such as wage capacity in individual sectors. While profitability in manufacturing has increased in recent years, partly owing to high commodity prices and a weaker krone, profitability gains in non-tradable sectors have been weaker. On the other hand, strong labour demand and low unemployment could push up wage growth. A model1 that weights together labour market tightness, the wage norm and conditions in individual sectors provides a wage growth projection for 2024 that is in line with the wage norm. In the model, low profitability in individual sectors is offset by relatively low unemployment.
Norges Bank’s Regional Network and expectations survey both indicate wage growth close to the wage norm (Chart 3.13). Overall, wage growth is projected to 5.2% in 2024. The projection is higher than in the March Report.
Annual wage growth in 2024. Percent
In the projections, slower inflation and lower capacity utilisation lead to a gradual decline in wage growth ahead, but wage growth remains high. This is in line with the expectations of the Regional Network and Norges Bank’s expectations survey. Business sector profitability overall holds steady at a high level and capacity utilisation increases somewhat more than previously projected. Together with slightly higher inflation prospects, the projection for wage growth is therefore higher than in the March Report.
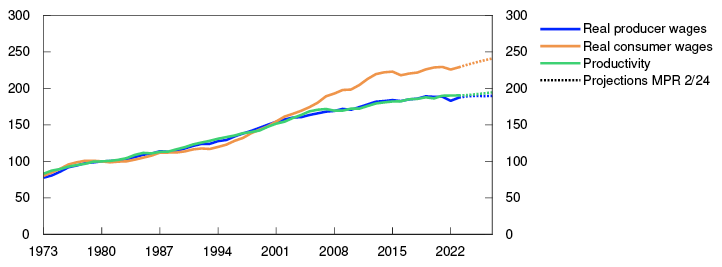
Real wage growth, measured by the CPI, accelerates in 2024 and remains elevated in the years ahead (Chart 3.14). Real wage growth is higher than productivity growth throughout the projection period. Projected real wage growth is nevertheless consistent with a stable labour share, reflecting terms-of-trade gains in the projections. Imported inflation has fallen and is assumed to run lower than the rise in prices for domestically produced goods and services, resulting in lower wage growth for Norwegian firms (real producer wages) than for households (real consumer wages) (Chart 3.15).
Annual change. Percent

Index. 1980=100
Inflation still above target
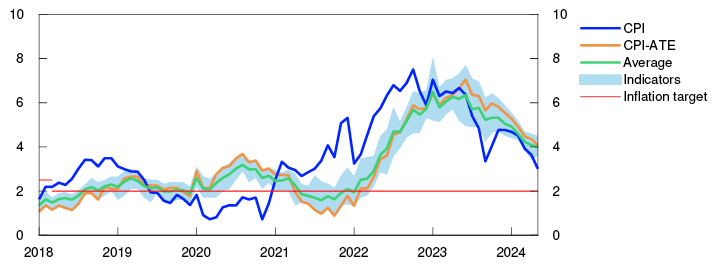
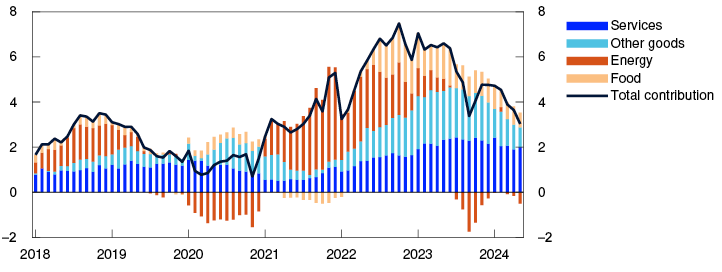
Consumer price inflation has slowed since end-2022 but is still above the target. The CPI was 3.0% higher in May than in the same month one year earlier and lower than projected in the March Report. Underlying inflation, as measured by the CPI adjusted for tax changes and excluding energy products (CPI-ATE), has also fallen over the past six months. In May, the 12-month rise dropped to 4.1%. Other indicators of underlying inflation have fallen in pace with the decline in CPI-ATE inflation (Chart 3.16). Over the past six months, goods inflation has slowed, while services inflation has remained elevated (Chart 3.17). See “What has driven inflation – supply or demand?” for an analysis of inflation drivers in recent years.
CPI and underlying inflation indicators. Twelve-month change. Percent
CPI. Twelve-month change. Percent. CPI subcomponents. Percentage points
Inflation is normally measured as the 12-month change in the CPI. As equal weight is given to the change in prices in each of the past 12 months, this variable changes slowly. The fall in prices over the past three and six months has gathered pace, with both periods showing a somewhat slower rise than the 12-month rise (Chart 3.18). This may indicate that disinflation is still underway, but has recently decelerated, with all the measures of inflation above the 2% inflation target.
CPI-ATE. Annualised change. Seasonally adjusted. Percent
Energy prices dampen inflation
Over the past year, energy prices have fallen and dampened CPI inflation. The projections for consumer energy prices are based on futures prices for electricity and petroleum products and also take into account other factors such as electricity distribution charges and indirect taxes. Electricity futures prices are higher than in March (see “Higher energy and commodity prices”), which partly accounts for the upward revision of the overall inflation projections since March and particularly for 2025. Low energy price inflation is nevertheless expected to contribute to somewhat lower CPI inflation than CPI-ATE inflation ahead.
Prospects for lower imported goods inflation
Imported goods inflation has fallen sharply recently and been lower than projected in the March Report. Goods such as cars and electronic equipment, in particular, have pulled down inflation. Looking ahead, the projections for international price impulses, as measured by the IPK, have been revised up (see “Higher energy and commodity prices”). On the other hand, the projections for the krone exchange rate ahead are somewhat stronger than in March, which will dampen imported price pressures. Imported inflation is expected to continue to slow and the projection is lower than in March (Chart 3.19).
Domestically produced goods and services and imported goods in the CPI-ATE. Four-quarter change. Percent
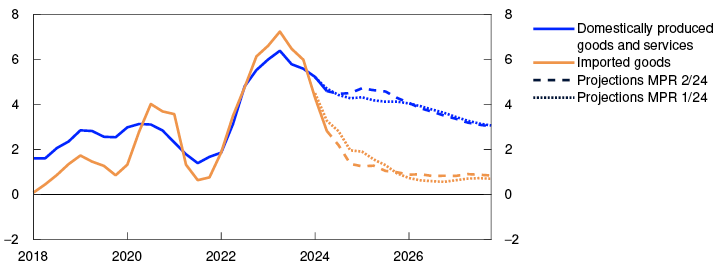
Domestic conditions keep inflation elevated
The rise in prices for domestically produced goods and services slowed slightly in May, broadly in line with the March projection. The continued rise in rents is underpinning inflation. Domestic inflation is projected to increase slightly in the coming period, partly owing to higher wage growth in 2024. At the same time, productivity growth is low. A faster rise in prices for domestically produced goods and services pushes up the CPI-ATE projection for the coming year. Lower wage growth and capacity utilisation are expected to pull down domestic inflation further out.
Domestic inflation can also be affected by international price impulses, for example through imported intermediate goods. Over the past year, imported intermediate goods inflation, measured by the index of international price impulses to Norwegian intermediate imports (IPI), fell sharply (see “Higher energy and commodity prices”). Since the March Report, futures prices for a number of key commodities have risen, and the IPI is expected to be somewhat higher ahead. It takes time before international price impulses to intermediate goods pass through to domestic inflation (see box in Monetary Policy Report 4/2023). Higher imported intermediate goods inflation is expected to accelerate the rise in prices for domestically produced goods and services ahead (Chart 3.19).
Overall inflation is expected to decline in the coming quarters, reflecting the fading impact of the earlier marked rise in prices for electricity and imported intermediate and consumer goods. Even so, it will take time for inflation to come down to the 2% target. High unit labour costs (ULC) are the primary reason why inflation remains elevated ahead (Chart 3.20). The krone depreciation through 2023 will result in a positive, but waning, contribution to underlying inflation ahead.
Contribution to four-quarter change in CPI-ATE. Percentage points
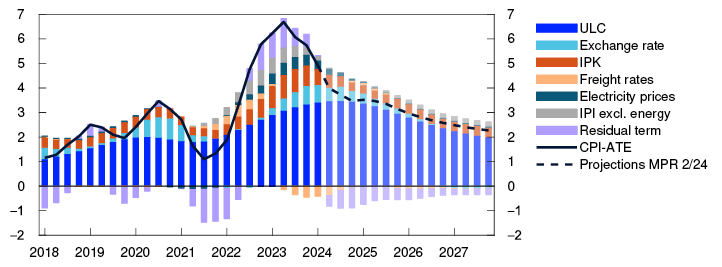
The projections for CPI-ATE inflation are somewhat lower in the period ahead and somewhat higher in 2025 compared with the March Report. The projection is little changed thereafter. The projection for CPI inflation is somewhat higher in 2025 and little changed thereafter compared with the March Report.
Uncertainty surrounding price and wage inflation
There is uncertainty about the cyclical path in the coming period, which adds to uncertainty about wage and price inflation. Increased capacity utilisation, a weaker krone and improved profitability in manufacturing could lead to high wage growth remaining elevated for longer than projected in this Report. On the other hand, a further decline in capacity utilisation, a stronger krone and weaker profitability in manufacturing may reduce wage growth faster than projected.
Inflation uncertainty in the near and medium term has diminished since March but is still higher than normal according to a host of uncertainty indicators (see “Indicators of uncertainty in the near and medium term”). According to the Bank’s expectations survey, inflation expectations are still above the inflation target both two and five years ahead but overall have edged down since 2024 Q1.
Imported goods inflation is expected to continue moderating, stabilising at a level close to its historical average. Freight rates and commodity prices, among other things, have been highly volatile in recent years, which raises the uncertainty surrounding inflation ahead. If the rise in these prices is more pronounced and persistent than currently assumed, this could intensify international price pressures. In that case, it will take longer for overall inflation to return to target, and real wage growth will turn out to be lower than currently projected.
There is considerable uncertainty related to productivity growth ahead. Productivity growth has been weak in recent years and is projected to rise gradually in the course of the projection period. Productivity growth may prove to be weaker than envisaged and contribute to inflation remaining elevated for a longer period than currently expected. On the other hand, a sharper rise in productivity growth could lead to lower inflation and higher real wage growth.
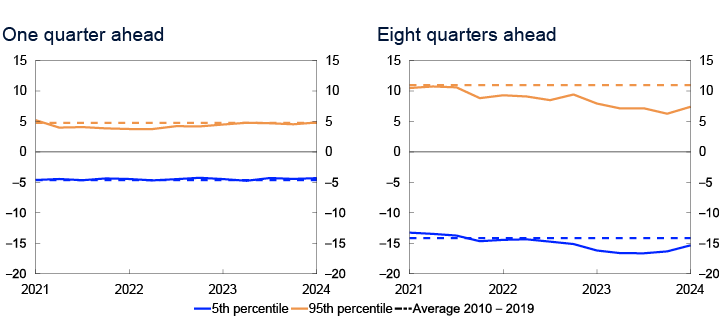
Indicators of uncertainty in the near and medium term
Expectations and projections of future economic developments will always be subject to considerable uncertainty. As an aid in understanding macroeconomic uncertainty, Norges Bank uses a model framework to quantify the uncertainty surrounding developments in three key macroeconomic variables: mainland GDP growth, house price inflation and consumer price inflation.1 The models help shed light on the uncertainty of a set of point estimates but do not provide information about the most probable developments ahead. One of several possible forward-looking risk indicators is derived from the simple model framework. Our overall assessment of risk ahead will always be based on a combination of judgement and model estimates.
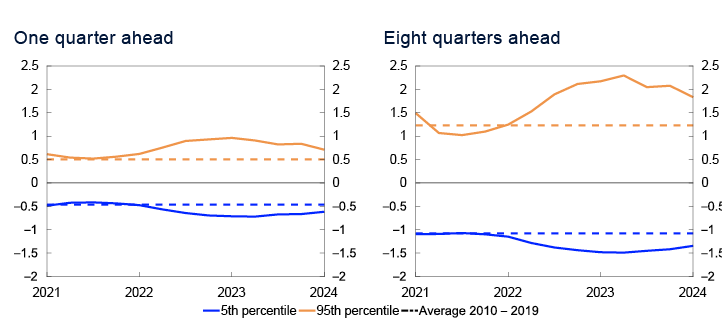
In this box, we use the difference between the median and the 95th and 5th percentiles, respectively, in the model framework’s estimated range of outcomes ahead as a measure of upside and downside risk. The illustrations show the changes in estimated upside and downside risk for the different variables over time. They show both changes in the size of the estimated range of outcomes, as measured by the difference between the 95th and 5th percentiles, and whether there is significant asymmetry between upside and downside risk.
According to the models, inflation uncertainty has been high in recent years. The indicator shows that uncertainty has gradually subsided since summer 2023 (Chart 3.D). One quarter ahead, uncertainty approaches its historical average but is higher than normal eight quarters ahead. The near-term uncertainty surrounding inflation has also become more centred, but the medium-term risk of significantly higher inflation is greater than the risk of significantly lower inflation.
Spread between percentiles and median from quantile regressions. Four-quarter change in CPI-ATE. Percentage points
The model indicates that near-term uncertainty surrounding mainland GDP growth is more centred and near normal levels (Chart 3.E). Medium-term uncertainty is slightly lower than the historical average, albeit skewed more to the upside, primarily due to weaker growth in household credit. Historically, the rapid build-up of credit increases the probability of a financial crisis. Low credit growth can therefore contribute to reducing the downside risk related to output growth. Since the March Report, changes in near- and medium-term uncertainty have been minor.
Chart 3.E Close to average output uncertainty in the near term3
Spread between percentiles and median from quantile regressions. Four-quarter change in mainland GDP. Percentage points
Source: Norges Bank
The models indicate that near-term uncertainty surrounding house price inflation is more centred and close to a normal level (Char 3.F). Eight quarters ahead, the models indicate that uncertainty is skewed to the downside. Developments in household disposable income and household credit growth contributed to a downside shift in uncertainty through 2023. Uncertainty has recently become more centred, primarily reflecting slightly higher growth in disposable income in 2024 Q1.
Spread between percentiles and median from quantile regressions. Four-quarter change in house prices. Percentage points
1 The models use quantile regressions with different indicators to estimate the distribution of output growth, house price inflation and consumer price inflation ahead. See further description in Bowe, F., S.J. Kirkeby, I.H. Lindalen, K.A. Matsen, S.S. Meyer and Ø. Robstad (2023) “Quantifying macroeconomic uncertainty in Norway”. Staff Memo 13/2023. Norges Bank.
2 Period: 2021 Q1 – 2024 Q1. The charts show developments in the difference between the 5th and 95th percentiles from the median for the model estimated distribution of consumer price inflation one and eight quarters ahead, respectively. Broken lines indicates average 5th and 95th percentiles between 2010 and 2019.
3 Period: 2021 Q1 – 2024 Q1. The charts show developments in the difference between the 5th and 95th percentiles from the median for the model estimated distribution of consumer price inflation one and eight quarters ahead, respectively. Broken lines indicate average 5th and 95th percentiles between 2010 and 2019.
4 Period: 2021 Q1 – 2024 Q1. The charts show developments in the difference between the 5th and 95th percentiles from the median for the model estimated distribution of consumer price inflation one and eight quarters ahead, respectively. Broken lines indicate average 5th and 95th percentiles between 2010 and 2019.
1 See Brubakk, L. and K. Hagelund (2022) “Frontfagets betydning for lønnsdannelsen i private tjenestenæringer” [Importance of the wage norm for wage determination in private services]. Staff Memo 5/2022. Norges Bank (in Norwegian only).
2 Period: 2024–2025. Expectations Survey: Social partners’ annual wage growth expectations. The average is pulled down by a small number of observations of very low wage expectations. Regional Network: Expected wage growth in own enterprise. Models for individual sectors: Weighted average of model estimates at the sector level. Model based on Staff Memo 5/2022.
3 Period: 2018–2027. Projections from 2024. Real wages: Nominal annual wage growth adjusted for CPI inflation.
4 Period: 1973–2027. Projections from 2024. Real producer wages are labour costs deflated by the GDP deflator for mainland Norway. Real consumer wages are labour costs deflated by consumer prices. Productivity is mainland GDP per hour worked.
5 Period: January 2018 – May 2024. CPI-ATE: CPI adjusted for tax changes and excluding energy products. Average: Average value of 12-month change for other underlying inflation indicators (CPIM, CPIXE, 20 percent trimmed mean, weighted median, CPIXV, CPI-sticky prices and CPIF) and CPI-ATE. Indicators: Highest and lowest 12-month change for underlying inflation indicators.
6 Period: January 2018 – May 2024. Contributions estimated based on the CPI by consumption categories (group level). In the statistics, some differences occur between the sum of the components and overall inflation.
7 Period: January 2021 – May 2024. Three and six months refer to average annualised monthly change over the different periods.
8 Period: 2018 Q1 – 2027 Q4. CPI-ATE: CPI adjusted for tax changes and excluding energy products. Projections from 2024 Q1 for MPR 1/24 and from 2024 Q2 for MPR 2/24.
9 Period: 2018 Q1 – 2027 Q4. Projections from 2024 Q2 for MPR 2/24. Decomposition of individual contributions from different cost components.
What has driven inflation – supply or demand?
In this box, we present an analysis that sheds light on the contributions to inflation in recent years from domestic and international supply and demand factors. The results indicate that international demand factors contributed to increasing inflation in particular, but also domestic demand factors. Domestic and international supply conditions have each played a somewhat smaller role according to the analysis, including changes in firms’ price margins.
The surge in inflation in the wake of the pandemic is most likely due to both domestic and international supply and demand conditions.1 Early on, the pandemic led to supply-side disruptions. Many countries introduced strict containment measures, and activity halted in parts of the economy. Additionally, both the production and transport of goods were limited at times by high levels of sick leave in many locations. Russia’s full-scale invasion of Ukraine also gave rise to negative supply-side disruptions and led to a sharp increase in electricity prices in many countries, among other things. Some firms may have also taken the opportunity to increase price margins in excess of what the economic situation would normally indicate.
However, the pandemic also affected the demand-side, both directly and indirectly. The Covid-19 pandemic contributed to a sharp shift in consumption from services to goods, both in Norway and internationally. At the same time, the fiscal support measures and low interest rates allowed households to build-up financial buffers through the pandemic. This supported a marked increase in private consumption as the containment measures were phased out. Strong growth in demand in many countries contributed not only to low unemployment, but also to bottlenecks and increased price and wage increases.
Many of the original drivers of inflation have eventually been fully or partially reversed, and inflation has gradually slowed in both Norway and abroad. Nevertheless, underlying CPI inflation is still well above the inflation targets across most countries – including in Norway.
In this analysis, we take a closer look at the extent to which domestic inflation in recent years has been driven by domestic or international conditions and to what extent these conditions are attributable to supply or demand. The analysis builds on insights from previous works. Among other things, we expand upon the model presented in Monetary Policy Report 1/2023 by segregating domestic and international demand factors. In addition, we explicitly allow for possible contributions stemming from changes in firms’ price margins.
The basis for the analysis is an estimated Bayesian vector autoregression (BVAR) model for the Norwegian economy which consists of five variables: four-quarter rise in consumer prices adjusted for tax changes and excluding energy products (CPI-ATE), four-quarter mainland GDP growth, aggregate price margins (measured as deviations from the trend), four-quarter rise in imported intermediate goods prices (measured in NOK) and four-quarter growth in OECD-wide GDP. The latter is intended to cover international economic activity. We use the total gross product for Norwegian mainland firms relative to labour and capital costs as an indicator of the aggregate price margin in the economy.2 The model is estimated on data for the period between 1995 Q1 and 2024 Q1.
We assume that the unexplained variation in the data, ie deviations between actual and estimated values, reflect various unobservable supply and demand shocks. Without additional information, we are unable to connect these deviations to underlying supply and demand shocks. To uncover the contribution from the underlying disturbances to inflation, we need to impose specific restrictions based on economic theory. Restriction choices can affect the results. Here. we assume so-called sign restrictions. Among other things, we assume that a positive demand shock gives rise to both higher inflation and increased activity in the short run, while a negative supply shock leads to higher inflation and decreased activity. We additionally assume that a shock to price margins differs from other supply shocks in that prices and margins move in the same direction in the short term. In order to distinguish between domestic and international shocks, we assume that a domestic disturbance affects international developments to a small degree. In total, we identify five underlying disturbances that drive the five endogenous variables in the model: a domestic supply shock, a domestic price margin shock,3 a domestic demand shock, an international supply shock and an international demand shock.
In charts 3.G and 3.H we show how, according to the model, the international supply and demand shock affects activity and inflation both in Norway and internationally, respectively. A negative international supply shock lifts inflation internationally and dampens activity. Higher prices internationally push up imported goods and services prices, which also raises inflation in Norway. In isolation, subsequent lower production growth internationally reduces activity in Norway.
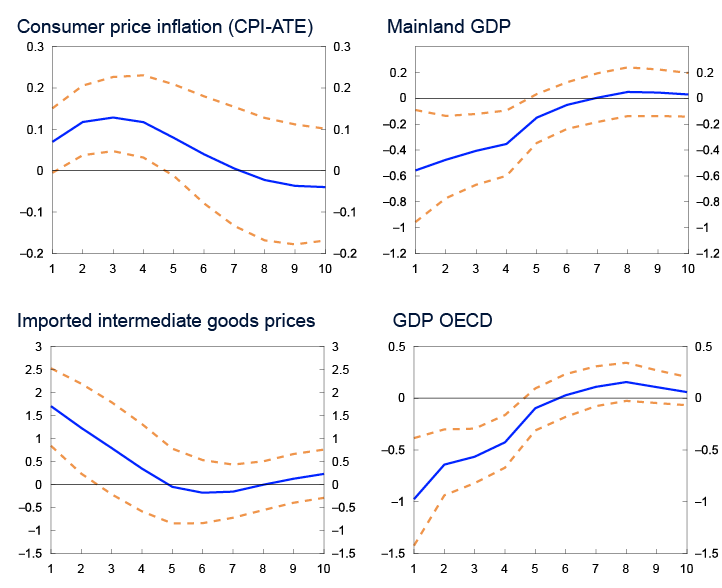
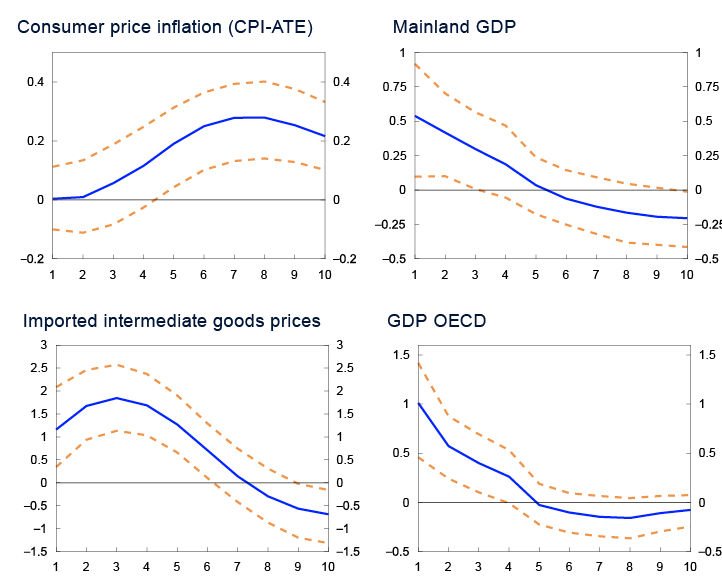
An international demand shock increases both activity and inflation internationally. According to the model results, this will also eventually increase inflation and overall production in Norway. Higher inflation internationally contributes directly to an increase in Norwegian consumer prices through imported consumer goods, but also indirectly through imported intermediate goods. Given the Norwegian system for wage formation, increased demand for Norwegian exports and increased activity in the economy will normally result in higher wage growth, which also contributes to driving up inflation. Chart 3.H shows that it takes time for increased international demand to pass through to domestic consumer prices. This is consistent with the fact that part of the effect goes through wages, which are typically adjusted with a time lag. The difference between the domestic inflation responses in charts 3.G and 3.H, which result from an international supply and demand shock respectively, most likely reflects different paths of wage growth.
Given the estimated model and the imposed restrictions, we can calculate how much each single shock has contributed to inflation since 2019. The results are shown in chart 3.I, where inflation is measured as deviations from a historical average. The results suggest that a significant part of the rapid rise in consumer prices (CPI-ATE) in Norway the past couple of years is attributable to international conditions, first and foremost connected to the demand-side. However, domestic supply and demand conditions also contributed to increasing consumer price inflation.6 The contributions from price margin shocks suggest that firms increase margins in periods somewhat more than the economic situation would normally indicate. When we also include the contributions from price margin shocks, the results show that domestic supply conditions made about the same overall contribution to the increased inflation as domestic demand conditions in the initial stages of the high-inflation period.
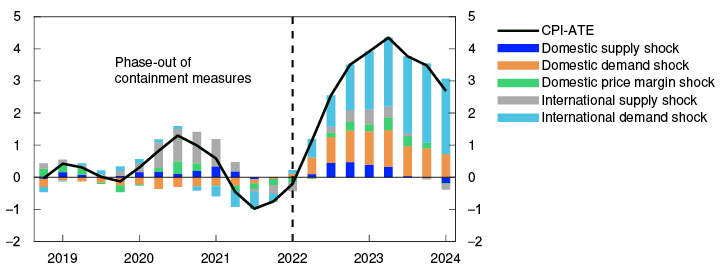
The inflation impulses from domestic supply-side disruptions (beyond price margin shocks) are relatively modest. It is natural to connect the domestic supply-side shocks (beyond price margin shocks) to variations in electricity prices. In that case, the results indicate that increased electricity prices contributed with between 0.3 and 0.5 percentage points to the four-quarter rise in the CPI-ATE in the period between 2022 Q3 and 2023 Q2. This is the same order of magnitude as comparable calculations from Statistics Norway.8
The results from this analysis indicate that the reversal of the negative supply-side disturbances both in Norway and internationally is now, in isolation, reducing consumer prices. At the same time, the knock-on effects from the strong demand growth that followed in the wake of the pandemic still contribute to keeping price growth well above the target, according to the analysis. The interest rate hikes of the past couple of years have helped to dampen demand growth, but wage growth is still high. Chart 3.I suggests that it may take time for the contributions from the initial demand disturbances to die out.
It is especially difficult to estimate how much of the price increase is due to supply and demand conditions, respectively – and whether the disruptions originated in Norway or abroad –when both types of disturbances occur approximately simultaneously in many countries. The fact that high price inflation went hand in hand with a marked increase in both demand and production nevertheless indicates that conditions on the demand side have played an important role. This is also the conclusion of many recent international studies.9
The analysis is based on a simplified account of the Norwegian and international economy. A more nuanced description of the economy and the factors driving inflation requires a more comprehensive framework. A natural extension could be to include the exchange rate explicitly in the model. To the extent that the exchange rate is mainly driven by the type of disturbances we already identify in our analysis, this will probably have little effect on the conclusions. If, on the other hand, the exchange rate is determined to a greater extent by rate-specific factors such as risk premiums, the supply and demand disturbances we identify in this analysis and the estimated contributions to inflation could change.
The model and the analysis are also based on assumptions that will not necessarily always be fulfilled. Uncertainty linked to the model and associated parameter estimates mean that the conclusions must be interpreted with caution.
1 See also boxes in Monetary Policy Report 1/2023, Monetary Policy Report 2/2023 and Monetary Policy Report 3/2023.
2 Excluding power generation. The capital costs are based on estimates for implicit rental prices. See Brubakk, L. and K. Hagelund (2022): ”The downs and ups of mark-ups”. Staff Memo 2/2023. Norges Bank.
3 Which can also be considered a type of supply shock.
4 Period: 1995 Q1 – 2024 Q1. Based on a BVAR model estimated on data for the period between 1995 Q1 and 2024 Q1. The chart shows the simulated effect on a sample of variables related to an international supply shock corresponding to a standard deviation over a 10-quarter period. The link between the broken red lines indicate 68 percent credible intervals. The blue line corresponds with the median effect.
5 Period: 1995 Q1 – 2024 Q1. Based on a BVAR model estimated on data for the period between 1995 Q1 and 2024 Q1. The chart shows the effect on a sample of variables related to an international demand shock corresponding to a standard deviation over a 10-quarter period. The link between the broken red lines indicate 68 percent credible intervals. The blue line corresponds with the median effect.
6 In qualitative terms, this is well in line with the findings from a similar Norges Bank analysis, see box in the Monetary Policy Report 1/2023.
7 Period: 2019 Q4 – 2024 Q1. Based on a BVAR model estimated on data for the period between 1995 Q1 and 2024 Q1. The chart shows the contributions from the different identified shocks to consumer price inflation (CPI-JAE) as a deviation from the average for the sample period based on median effects. In percentage points.
8 See box 2.5 in Økonomiske analyser 1/2023, [Economic analyses]. Statistics Norway (in Norwegian only).
9 See for example Eickmeier, S. and B. Hofmann (2022): ”What drives inflation? Disentangeling demand and supply factors”. BIS Working Paper, 1047. Bank for International Settlements, and Ascari, G., P. Bonomol, M. Hoeberichts and R. Trezzi (2023): ”The Euro Area Great Inflation Surge”. Analyse, February 2023. De Nederlandsche Bank. At the same time there are also examples of studies which present supply-side conditions as the most important contributors to the high inflation, see for example Blanchard, O.J. and B.S. Bernanke (2024): ”An Analysis of Pandemic-Era Inflation in 11 Economies”. NBER Working Papers 32532. National Bureau of Economic Research, Inc. and Dao, M., A. Dizioli, C. Jackson, P.-O. Gourinchas and D. Leigh (2023): “Unconventional Fiscal Policy in Times of High Inflation”. IMF Working Papers 2023/178. International Monetary Fund. Differing methods give differing answers.
4. Monetary policy analysis
On balance, Norges Bank’s analyses indicate a policy rate path that is slightly higher than in the March 2024 Monetary Policy Report. According to the model analysis, the path is pushed up by higher capacity utilisation, higher wage growth and slightly higher international interest rates than projected in the March Report. A somewhat stronger krone in isolation pulls in the direction of a lower policy rate path from 2025.
4.1 The policy rate path and monetary policy objectives
The operational target of monetary policy is annual consumer price inflation of close to 2% over time. Inflation targeting shall be forward-looking and flexible so that it can contribute to high and stable output and employment and to countering the build-up of financial imbalances. The Monetary Policy and Financial Stability Committee’s monetary policy strategy is discussed further on Norges Bank’s web pages.
The policy rate forecast is slightly higher than in the March Report. The policy rate was kept unchanged at 4.5% at the meeting of the Committee on 19 June. The forecast indicates that it will remain at this level to the end of 2024 before gradually declining. At the end of the forecast horizon, the policy rate is projected to be 2.7%.
The projections are uncertain. The Bank’s forecasts have undergone substantial revision in recent years. If the economic outlook, the balance of risks or the assessment of the functioning of the economy change, the policy rate may prove to be different from the one projected.
4.2 New information and assessments
New information suggests a slightly higher policy rate path
To shed light on how developments since the March Report affect the economic outlook, new information and assessments of the economic situation are incorporated into the Bank’s modelling system, while conditioning on the policy rate path from March. This exercise shows the forecasts that the modelling system would have produced with the policy rate path from March. Here the main focus is on the output gap and inflation outlook.
In the exercise with the rate path from March, the capacity utilisation projection has been revised up somewhat compared with the March Report (Chart 4.1). Consumer price inflation adjusted for tax changes and excluding energy products (CPI-ATE) has moved broadly in line with the projections. From 2025, higher wage growth, among other factors, will contribute to keeping inflation elevated for longer than previously envisaged. The exercise indicates a slightly higher policy rate path than in the March Report.
Projections conditioned on new information concerning economic developments and the policy rate forecast in MPR 1/24
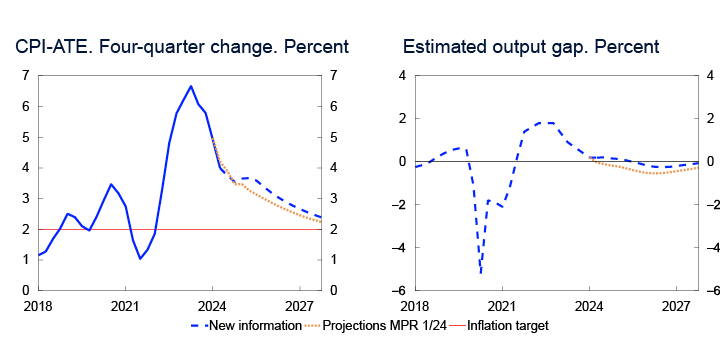
Market policy rate expectations have risen slightly
Market policy rate expectations further out can provide an indication of how market participants have interpreted new information and how they expect Norges Bank to react.
Market interest rates rose at the time of the publication of the March Report and have since edged higher. The policy rate path in this Report is higher than the market-implied path in the period to end-2026 (Chart 4.2). Market expectations indicate a policy rate of approximately 3.0% at the end of the projection period.
Policy rate. Percent
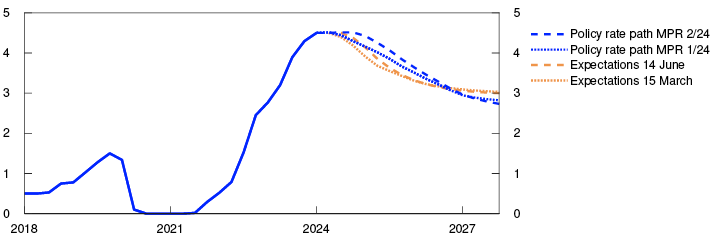
Market policy rate expectations among Norway’s main trading partners for the coming year have risen slightly since the March Report (Chart 4.3) but nevertheless indicate that policy rates will be reduced somewhat earlier among Norway’s trading partners than in Norway. The policy rate differential thus widens somewhat in the coming year and remains positive through the projection period.
Policy rates in Norway and among Norway’s main trading partners. Percent

The simple rule indicates a broadly unchanged policy rate path
A simple policy rate rule shows the monetary policy reaction to changes in the output gap and inflation (see the Monetary Policy Report 1/2022). The estimated rule is based on data for the period 2001–2021. In this Report, near-term projections have been revised up slightly for the output gap and down slightly for inflation, but changes from the March Report are minor. The simple rule therefore indicates a broadly unchanged policy rate path in the coming quarters compared with the March Report, although the level is still higher than the policy rate projection (Chart 4.4).
Three-month money market rate. Percent

1 Period: 2018 Q1 – 2027 Q4. Projections from 2024 Q1 for MPR 1/24 and 2024 Q2 for MPR 2/24.
CPI-ATE: CPI adjusted for tax changes and excluding energy products.
The output gap is a measure of the percentage difference between mainland GDP and projected potential mainland GDP.
2 Period: 2018 Q1 – 2027 Q4. Expectations from 15 March for MPR 1/24. Expectations from 14 June for MPR 2/24.
3 Period: 2018 Q1 – 2027 Q4. Estimated forward rates from 15 March for MPR 1/24 and 14 June for MPR 2/24. The international policy rate is a trade-weighted average of the policy rates of the Bank of England, the ECB, the Federal Reserve and Sveriges Riksbank.
4 Period: 2018 Q1 – 2025 Q1. Projections from 2024 Q1 for MPR 1/24 and 2024 Q2 for MPR 2/24.
4.3 Monetary policy stance and drivers behind the changes in the policy rate path
Compared with the March Report, the policy rate forecast has been revised up slightly, and inflation projections have been revised up somewhat further out. This results in an estimate of the expected real money market rate that is little changed compared with the March Report. (Chart 4.5). The real interest rate is projected to lie above the range that has a neutral effect on the economy in the coming years. As inflation is brought back towards the target and the policy rate is reduced, the real interest rate is expected to be slightly lower. See “Estimate of the neutral real interest rate” for a further discussion on the interval for the neutral real interest rate.
A real interest rate at the current level will weigh down on overall demand and dampen wage and price inflation.5 As long as the real interest rate lies above its neutral level, this will contribute to pulling down domestic household consumption.
Higher residential mortgage rates pull down on household disposable income, which also suggests lower consumption. At the same time, wage growth is now projected to be higher than previously assumed, which points to an increase in household real disposable income. Overall, both household consumption and the saving ratio are expected to be slightly higher in 2024 than in the March Report.
The forecasts suggest broadly unchanged trade-offs
The Committee’s reasoning for the policy rate decision and forward guidance on the policy rate are presented in the “Monetary policy assessment” The trade-offs between bringing inflation quickly back to target and promoting high and stable output and employment is expressed in the forecasts of inflation and the output gap. Chart 4.6 illustrates the trade-offs as measured by the projected inflation deviation from the target and the output gap one to three years ahead.6 The diagram does not necessarily capture all risk factors relevant in the monetary policy assessments. Such risk factors will normally vary. Different ratios of the projected inflation deviation and the output gap in various monetary policy reports do not therefore necessarily mean that the Committee has given different weights to low and stable inflation and high and stable output and employment in various reports. As illustrated in the chart, the policy rate path implies small changes to the forecasts of inflation and the output gap ahead. By this measure, the Committee’s trade-offs between these two objectives and the assessment of the risk factors are not materially different compared with the March Report.
Inflation gap and output gap. Average 1–3 years ahead
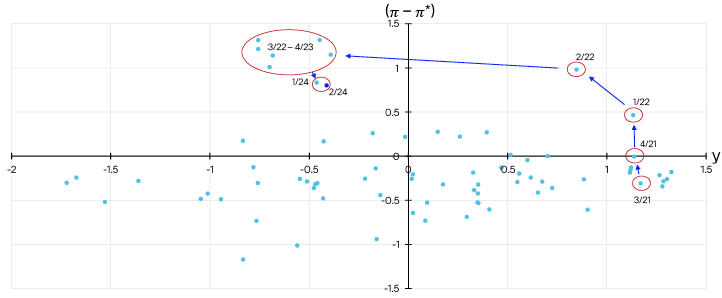
The model-based analysis implies a slightly higher policy rate path
In the decomposition in Chart 4.7, the Bank’s main model NEMO is used to break down the main drivers behind the change in the policy rate path since the March Report. The bars show contributions to changes in the model-based path, and the broken line shows the sum of the bars. The solid line shows the actual change in the rate path.
Cumulative contributions. Percentage points
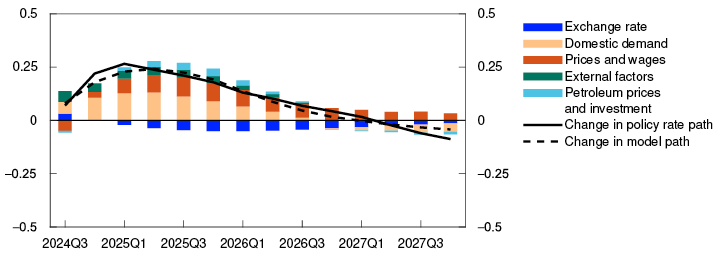
International policy rates are expected to be slightly higher than envisaged earlier. This pulls in isolation in the direction of a weaker krone. The near-term projections for economic growth among Norway’s trading partners have been revised up since the March Report, which in isolation will boost Norwegian goods and services exports ahead. External factors suggest a slightly higher model-based path (green bars).
Since the March Report, gas spot and futures prices have risen, while oil prices show little change. This pulls in isolation in the direction of a higher model-based path. The projection for petroleum investment is little changed since the March Report. Overall, factors relating to petroleum prices and petroleum investment contribute to a slightly higher model-based path (light blue bars).
The krone exchange rate has been somewhat weaker than expected and weaker than changes in the interest rate differential in the model framework would suggest. This pulls in the direction of a higher model-based path. Looking ahead, the krone projections are somewhat stronger than in the March Report. This pulls in the direction of a lower model-based path in the model analysis. Overall, the exchange rate pulls the model-based path slightly down from 2025 (dark blue bars).
In the near term, capacity utilisation is projected to be somewhat higher than envisaged in March. Higher net exports and public demand push up the projection. In addition, there are prospects that private consumption will be higher in the near term than envisaged in the March Report, boosting Norwegian economic activity ahead and lifting the model-based path. Lower-than-expected housing and business investment implies in isolation a lower model-based path. On the whole, domestic demand lifts the model-based path throughout the projection period (orange bars).
Underlying price inflation has been broadly as projected. Imported goods inflation has been lower than projected. This will in isolation pull in the direction of a lower model-based path in the near term. The projections for wage growth have been revised up in the beginning of the projection period. Higher wage growth will slow the process of disinflation to a further extent than previously projected. Price and wage factors on the whole suggest a somewhat higher model-based path from the end of 2024 (red bars).
The model analysis implies a slightly higher policy rate to the end of 2025. The policy rate path has been revised up to approximately the same extent as the model-based path in the near term.
5 See box “The interest rate sensitivity of consumption and investment” in the Monetary Policy Report 4/2023” for a further description of the impact of the policy rate on consumption and investment.
6 See box "Avveiingene i pengepolitikken belyst ved prognosene for inflasjonen og produksjonsgapet" [Trade-offs in monetary policy elucidated by the forecasts of inflation and the output gap] in Norges Bank’s Monetary Policy Handbook. Norges Bank Papers 3/2024. (Forthcoming in English).
7 The chart shows combinations of forecasts for the output gap (y) and inflation (π) (deviation from the target (π*) on average one to three years ahead. Each point represents the forecasts in a specific Monetary Policy Report. Goal attainment improves the closer the points are to origin, although the points will normally lie further from the origin following larger shocks. Their location in the diagram depends on the monetary policy stance. Often, but not always, a reasonable trade-off will entail a policy rate path that implies that the forecasts for the inflation gap and the output gap have opposite signs. The trade-offs from MPR 3/2021 and MPR 2/2024 are marked with red rings. Period: 2005 Q4-2024 Q2.
8 Period: 2024 Q3 – 2027 Q4. Projections. The contributions are based on model estimates from the NEMO model, but there is no mechanistic link between news and changes in the bars. The effect of news feeds through with a lag and the interaction between economic variables may result in a reversal of the effect over time. In addition, projections for the near term may entail news with different signs at different times. The effect on the rate path is therefore shown most clearly by the cumulative contributions.
Estimate of the neutral real interest rate
We project the neutral real money market rate to be in the interval 0% and 1%. The interval is somewhat higher than our previous projections.
The real interest rate, defined as the nominal interest rate less expected inflation, has risen from a very low level over the past year. As an aid to assess whether the real interest rate has a contractionary or expansionary effect on the economy, we project the neutral real interest rate (r*). Calculations of r* will depend on the time horizon on which it is based. With a short-term time horizon, every disturbance, both of a temporary and more permanent nature, will affect r*. This gives an r*, which varies considerably and is unsuitable as a reference point for monetary policy.1 With a long-term time horizon, r* will depend to a greater extent on more structural driving forces like population growth and productivity. In practice, it is challenging to make a precise distinction between different time horizons. We define r* as the real interest rate consistent with a closed output and inflation gap in the medium term. When the real interest rate is higher (lower) than r*, it indicates contractionary (expansionary) monetary policy.
R* is not observable and must be estimated. In a small open economy like Norway, r* will be largely affected by global developments. In Monetary Policy Report 2/2023 we indicated that r*, based on the money market interest rate, was in the interval between -0.5% and 0.5%.2 With new information and new estimates, we estimate that r* currently lies in the interval between 0% and 1%. This suggests a policy rate range of between 1.7% and 2.7% in the medium term given an inflation target of 2% and a money market premium of 0.3 percentage point. There is a high degree of uncertainty both methodologically and statistically associated with the estimates.
Calculations of r* are regularly performed by academics and central banks in many countries. As market interest rates fell internationally in the years preceding the pandemic, many central banks revised down their estimates for r*. In its latest update of r*, the European Central Bank (ECB) emphasises that the pandemic, disruptions in global supply chains, increases in energy prices and an expansionary fiscal policy may have led to a temporary increase in short-term measurements for r*.3 At the same time, the ECB points out that conditions that determine r* in the longer term, such as demographic and technological factors, have likely not changed extensively. Similar arguments have been put forward by economists at the Bank of England.4 Climate change will also likely affect r*, but the direction and magnitude are uncertain.5
A number of central banks have recently revised up their projections of r* somewhat. The Reserve Bank of New Zealand estimates an r* of 0.75%.6 The Bank of Canada is operating with an interval of between 0.25% and 1.25%.7 The Federal Reserve also expects somewhat higher real interest rates, and r* can now be estimated to be 0.8%.8 The ECB’s new estimates indicate that r* is now around 0%, in line with pre-pandemic levels.9
We consider both market and model-based measurements when estimating r* in Norway. The implied long-term money market interest rate is based on five-year rates five years ahead. In Norway, it has largely followed the interest rates of trading partners. Adjusted for market-based measures of inflation expectations, we can use these interest rates as a starting point for market-based measures of r*.10 Over the past few years, market-based measures of expected real interest rates have risen from very low levels both internationally and in Norway (Chart 4.A).
Percent
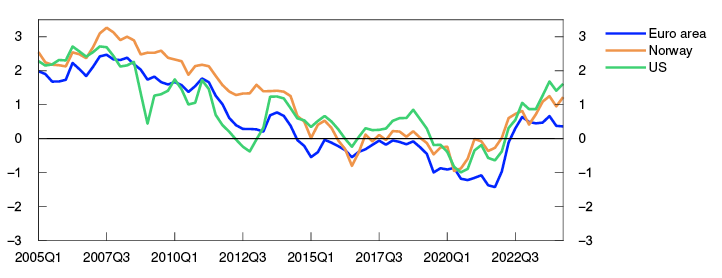
As an alternative to market-based measures, r* can be estimated using economic models. It provides an estimate of r* that corresponds to the real interest rate consistent with a closed output and inflation gap when the effects of short-term economic shocks are exhausted. We use several different models to estimate r*.12 Some of the models are pure time series models, while other models increasingly impose relationships between the variables based on economic theory. The models are estimated using data from 1994 up to and including 2024.13 For 2024, we use available figures and short-term estimates of economic variables from this Report. The latest estimates from the models indicate a small increase in r*. However, a low estimate of the long-term economic growth in the models contributes to keeping the level of r* down.
Model estimates of r* are very uncertain and depend on how the models are specified. Market-based measurements can be affected by term premiums and inflation risk, which are difficult to estimate. As changes in central banks’ asset purchase programmes may have led to an increase in the forward premium in long-term interest rates in recent years, market-based measurements of the real interest rate may indicate a higher real interest rate than expected. A large degree of uncertainty is related to the various approaches to calculate r*, a discretionary evaluation is therefore necessary when this is quantified. Chart 4.B shows the average of the model estimates together with the market-based measure for Norway.14 The chart also includes our estimate of the interval for r* over time, indicated by the broken green lines.15 The upward adjustment of our estimate of the interval for r* reflects the fact that both market-based measurements remain high and model-based measurements indicate a small increase. In this Report, the real interest rate is projected to lie in the interval for r* between 0% and 1% towards the end of the forecast horizon.
Percent
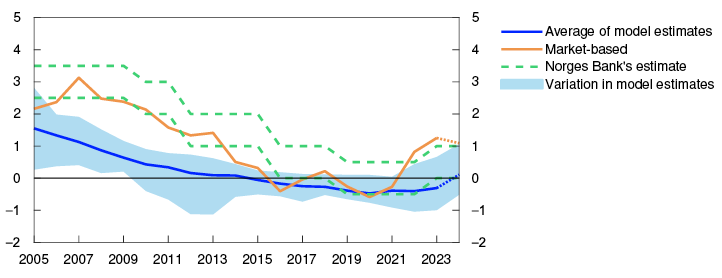
1 See Section 3.3 in Norges Bank’s Monetary Policy Handbook (2024): “Norges Bank’s Monetary Policy Handbook”. Norges Bank Papers 3/2024.
2 See box “Estimates of the neutral real interest rate” in Monetary Policy Report 2/2023.
3 See Economic Bulletin 1/2024. ECB.
4 See Cesa-Bianchi, A., R. Harrison and R. Sajedi (2023): “Global R*”, Bank of England Staff Working Paper No. 990.
5 See box in Monetary Policy Report March 2024 and Economic Commentary No. 5/2024. Riksbank.
6 See Monetary Policy Statement. May 2024 (Figure 7.4) and “New Zealand’s Nominal Neutral Interest Rate”. Bulletin, Vol 87, No. 4. Reserve Bank of New Zealand
7 See Adjalala, F., F. Alves, H. Desgagnés, W. Dong, D. Matveev and L. Simon (2024): “Assessing the US and Canadian neutral rates: 2024 update”. Staff Analytical Note 2024-9. Bank of Canada.
8 This figure is based on a long-term estimate of the policy rate of 2.8% minus inflation estimates of 2%. See Federal Reserve (2024) “Summary of Economic Projections”, 2024 FOMC Meeting. Federal Reserve.
9 See box 7 “Estimates of the neutral interest rate for the euro area: an update”, ECB Economic Bulletin, issue 1/2024.
10 The real interest rates are defined as five-year-on-five-year interest rate swaps minus five-on-five-year inflation swaps. For Norway, the analysis uses inflation expectations five years ahead for economists as a whole from Norges Bank’s Expectations Survey.
11 Period: 2005 Q1 – 2024 Q2. Implied five-year rates five years ahead based on swap rates minus inflation swaps for the same period. For Norway, inflation expectations five years ahead for economists as a whole are used from Norges Bank’s Expectations Survey.
12 See Meyer, S.S., Ulvedal, P.B. and Erik. S. Wasberg (2022): “The neutral real interest rate” Norges Bank Staff Memo 7/2022.
13 In the models, we use a time series for the expected real interest rate, constructed using three-month Nibor less inflation expectations 12 months ahead for economists as a whole from Norges Bank’s Expectations Survey between 2002 and 2012. After 2013, we use our own short-term forecasts for underlying inflation to calculate expected real interest rates (Chart 4.5).
14 Historical model estimates are based on the most recent available data and do not indicate what the model estimates could have been earlier.
15 The green broken lines indicate our estimated range for r*. See Inflation Report 3/2005, Monetary Policy Report 1/2010, Monetary Policy Report 1/2012, Monetary Policy Report 3/2016 and Monetary Policy Report 2/2019 for when r* was revised. The range shows r* at the end of 2024. In cases where a point estimate has been stated, we have added and subtracted 0.5 percentage point to obtain a range. The range shows r* at the end of 2024. In cases where a point estimate has been stated, we have added and subtracted 0.5 percentage point to obtain a range.
16 Period: 2005–2024. The broken green lines show a discretionary interval for the estimate of the neutral real interest rate.
Annex
Detailed tables of projections
TABLe 1 International projections
|
Change from projections in Monetary Policy Report 1/2024 in brackets |
Weights1 Percent |
Percentage change from previous year |
||||
|---|---|---|---|---|---|---|
|
2023 |
2024 |
2025 |
2026 |
2027 |
||
|
GDP |
||||||
|
US |
12 |
2.5 |
2.3 (0.1) |
1.8 (0.2) |
1.8 (0.2) |
1.7 (0.2) |
|
Euro area |
47 |
0.5 |
0.8 (0.1) |
1.4 (-0.2) |
1.5 (-0.1) |
1.5 (-0.1) |
|
UK |
15 |
0.1 |
0.9 (0.6) |
1.4 (0.2) |
1.5 (0) |
1.5 (0.2) |
|
Sweden |
18 |
0.1 |
0.8 (0.5) |
2 (0) |
2 (0) |
1.9 (0.1) |
|
China |
8 |
5.3 |
5.1 (0.6) |
4.2 (0.1) |
3.7 (0) |
3.6 (0) |
|
5 trading partners1 |
100 |
1 |
1.4 (0.3) |
1.8 (0) |
1.8 (0) |
1.8 (0.1) |
|
Prices |
||||||
|
Underlying inflation2 |
5.3 |
3 (0) |
2.3 (0) |
2.2 (0) |
2.1 (0) |
|
|
Wage growth2 |
4.9 |
4.3 (0.3) |
3.5 (0) |
3.2 (0.1) |
3 (0) |
|
|
Prices for consumer goods imported to Norway3 |
-0.5 |
1.3 (0.8) |
0.1 (0.0) |
0.5 (-0.3) |
0.8 (0) |
|
1 The aggregate includes: Euro area, China, Sweden, UK and US. Export weights.
2 The aggregate includes: Euro area, Sweden, UK and US. Import weights.
3 In foreign currency terms. Including composition effects and freight rates.
Sources: LSEG Datastream and Norges Bank
Table 2a Consumer prices. Twelve-month change. Percent
|
2024 |
|||||||
|---|---|---|---|---|---|---|---|
|
Mar |
Apr |
May |
Jun |
Jul |
Aug |
Sep |
|
|
Consumer price index (CPI) |
|||||||
|
Actual |
3.9 |
3.6 |
3.0 |
||||
|
Projections MPR 1/24 |
4.2 |
3.9 |
3.3 |
3.3 |
|||
|
Projections MPR 2/24 |
3.1 |
3.4 |
3.7 |
4.6 |
|||
|
CPI-ATE |
|||||||
|
Actual |
4.5 |
4.4 |
4.1 |
||||
|
Projections MPR 1/24 |
4.7 |
4.5 |
4.2 |
3.9 |
|||
|
Projections MPR 2/24 |
3.6 |
3.7 |
3.6 |
3.8 |
|||
|
Imported consumer goods in the CPI-ATE |
|||||||
|
Actual |
3.6 |
3.4 |
2.8 |
||||
|
Projections MPR 1/24 |
4.3 |
3.9 |
3.5 |
2.7 |
|||
|
Projections MPR 2/24 |
2.3 |
2.2 |
2.2 |
2.3 |
|||
|
Domestically produced goods and services in the CPI-ATE |
|||||||
|
Actual |
4.9 |
4.8 |
4.7 |
||||
|
Projections MPR 1/24 |
4.9 |
4.9 |
4.6 |
4.6 |
|||
|
Projections MPR 2/24 |
4.4 |
4.6 |
4.4 |
4.5 |
|||
Sources: Statistics Norway and Norges Bank
Table 2b House prices. Monthly change. Seasonally adjusted. Percent
|
2024 |
|||||||
|---|---|---|---|---|---|---|---|
|
Mar |
Apr |
May |
Jun |
Jul |
Aug |
Sep |
|
|
Actual |
0.6 |
0.7 |
0.6 |
||||
|
Projections MPR 1/24 |
0.3 |
0.4 |
0.3 |
0.3 |
|||
|
Projections MPR 2/24 |
0.6 |
0.4 |
0.4 |
0.4 |
|||
Sources: Eiendomsverdi, Finn.no, Real Estate Norway and Norges Bank
Table 2c Registered unemployment (rate). Percent of labour force. Seasonally adjusted
|
2024 |
|||||||
|---|---|---|---|---|---|---|---|
|
Mar |
Apr |
May |
Jun |
Jul |
Aug |
Sep |
|
|
Actual |
1.9 |
1.9 |
2.0 |
||||
|
Projections MPR 1/24 |
1.9 |
2.0 |
2.0 |
2.0 |
|||
|
Projections MPR 2/24 |
2.0 |
2.0 |
2.0 |
2.1 |
|||
Sources: Norwegian Labour and Welfare Administration (NAV) and Norges Bank
Table 2e GDP for mainland Norway. Quarterly change.1 Seasonally adjusted. Percent
|
2023 |
2024 |
|||
|---|---|---|---|---|
|
Q4 |
Q1 |
Q2 |
Q3 |
|
|
Actual |
0.3 |
0.2 |
||
|
Projections MPR 1/24 |
0.0 |
0.0 |
||
|
Projections MPR 2/24 |
0.2 |
0.3 |
||
1 Quarterly figures based on monthly national accounts.
Sources: Statistics Norway and Norges Bank
Table 3 Projections for main economic aggregates
|
Change from projections in Monetary Policy Report 1/2024 in brackets |
Percentage change from previous year (unless otherwise stated) |
|||||
|---|---|---|---|---|---|---|
|
In billions of NOK 2023 |
2023 |
Projections |
||||
|
2024 |
2025 |
2026 |
2027 |
|||
|
Prices and wages |
||||||
|
CPI |
5.5 |
3.7 (-0.1) |
3.2 (0.5) |
2.6 (0.0) |
2.3 (0.0) |
|
|
CPI-ATE |
6.2 |
4.0 (-0.1) |
3.4 (0.2) |
2.8 (0.1) |
2.4 (0.1) |
|
|
Annual wages |
5.2 |
5.2 (0.3) |
4.5 (0.2) |
3.8 (0.1) |
3.4 (0.0) |
|
|
Real economy1 |
||||||
|
Gross domestic product (GDP) |
5129 |
0.7 |
1.1 (0.7) |
1.9 (0.1) |
0.4 (-0.1) |
0.6 (-0.1) |
|
GDP, mainland Norway2 |
3858 |
1.1 |
0.8 (0.3) |
1.3 (0.1) |
1.2 (-0.1) |
1.6 (0.0) |
|
Output gap, mainland Norway (level) |
0.8 |
0.2 (0.2) |
-0.2 (0.1) |
-0.5 (0.0) |
-0.3 (0.1) |
|
|
Employment, persons, QNA |
1.3 |
0.6 (0.2) |
0.7 (0.3) |
0.6 (0.0) |
0.9 (-0.1) |
|
|
Registered unemployment (rate, level) |
1.8 |
2.0 (0.0) |
2.2 (0.0) |
2.3 (0.1) |
2.2 (0.0) |
|
|
Demand1 |
||||||
|
Mainland demand2 |
4014 |
0.4 |
-0.6 (-0.6) |
2.5 (0.5) |
2.5 (0.2) |
2.3 (0.0) |
|
– Household consumption |
1924 |
-0.6 |
1.2 (0.2) |
2.7 (0.6) |
2.2 (0.1) |
2.0 (-0.1) |
|
– Business investment |
499 |
4.0 |
-9.8 (-5.4) |
1.8 (-0.1) |
3.0 (0.2) |
3.3 (0.3) |
|
– Housing investment |
208 |
-15.6 |
-15.8 (-3.3) |
5.1 (-0.8) |
10.0 (0.4) |
9.2 (0.2) |
|
– Public demand |
1383 |
3.3 |
2.4 (0.3) |
2.1 (0.7) |
1.9 (0.4) |
1.6 (0.4) |
|
Petroleum investment2 |
216 |
10.5 |
9.0 (-1.0) |
-4.0 (1.0) |
-3.0 (0.0) |
-3.0 (0.0) |
|
Mainland exports2 |
1043 |
7.8 |
5.2 (2.6) |
1.2 (-0.7) |
1.5 (-0.4) |
2.4 (-0.3) |
|
Imports |
1667 |
1.3 |
0.6 (2.3) |
2.8 (0.8) |
2.1 (0.2) |
2.0 (-0.1) |
|
House prices and debt |
||||||
|
House prices |
0.2 |
3.3 (0.4) |
6.9 (0.7) |
7.9 (0.2) |
6.6 (0.1) |
|
|
Household credit (C2) |
3.3 |
2.6 (-0.1) |
2.4 (-0.2) |
2.3 (-0.3) |
2.9 (0.0) |
|
|
Interest rate, exchange rate and oil price |
||||||
|
Policy rate (level) |
3.5 |
4.5 (0.1) |
4.1 (0.2) |
3.4 (0.1) |
2.8 (-0.1) |
|
|
Import-weighted exchange rate (I-44) (level) |
119.5 |
118.3 (-0.5) |
117.5 (-1.2) |
117.5 (-0.9) |
117.5 (-0.6) |
|
|
Policy rate, trading partners (level) |
3.9 |
4.2 (0.1) |
3.3 (0.2) |
2.8 (0.1) |
2.6 (0.0) |
|
|
Oil price, Brent Blend. USD per barrel |
82.5 |
81.7 (-1.9) |
77.4 (-0.6) |
74.2 (-0.2) |
72.2 (0.1) |
|
|
Household income and saving1 |
||||||
|
Real disposable income excl. dividend income |
-2.4 |
2.8 (1.2) |
2.4 (-0.2) |
2.9 (0.2) |
3.1 (0.4) |
|
|
Saving ratio excl. dividend income (rate, level) |
-0.3 |
1.4 (0.4) |
1.5 (0.2) |
1.9 (0.2) |
2.8 (0.6) |
|
|
Fiscal policy |
||||||
|
Structural non-oil deficit as a percentage of GPFG3 |
3.0 |
2.7 (-0.1) |
2.5 (-0.2) |
2.6 (-0.1) |
2.6 (-0.1) |
|
|
Structural non-oil deficit as a percentage of trend GDP |
9.7 |
10.4 (-0.5) |
10.7 (-0.4) |
11.0 (-0.3) |
11.1 (-0.4) |
|
1 All figures are working-day adjusted.
2 Annual figures based on monthly national accounts.
3 Government Pension Fund Global measured at the beginning of the year.
Sources: Eiendomsverdi, Finn.no, LSEG Datastream, Ministry of Finance, Norwegian Labour and Welfare Administration (NAV), Real Estate Norway, Statistics Norway and Norges Bank