Norges Bank’s Monetary Policy and Financial Stability Committee decided to raise the policy rate from 4.0% to 4.25% at its meeting on 20 September. Whether additional tightening will be needed depends on economic developments. Based on the Committee’s current assessment of the outlook and balance of risks, there will likely be one additional policy rate hike, most probably in December.
International inflation recedes but remains high
Consumer price inflation among Norway’s main trading partners has fallen appreciably in recent months but is still above central bank targets of 2%. Underlying inflation remains high and has been approximately as projected in the June 2023 Monetary Policy Report. Oil prices have risen since June, and the spot price is now around USD 95 per barrel. Gas prices are little changed.
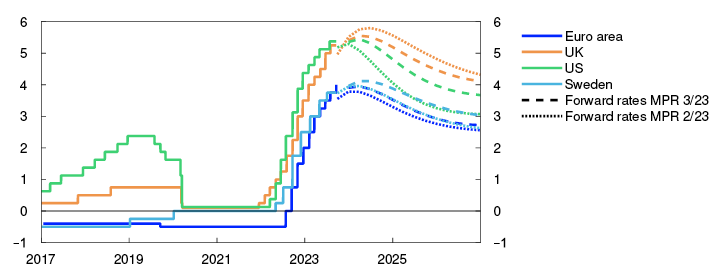
Central banks internationally have raised their policy rates significantly since the spring of last year, and a number of central banks raised interest rates further through summer. Many central banks highlight the fact that monetary policy is now having a tightening effect on the economy. Since June, both policy rate expectations and long-term government bonds yields have continued upwards for Norway’s main trading partners. Market pricing indicates expectations that policy rate rates abroad will be kept close to today’s level in the coming year.
Policy rates and estimated forward rates. Percent
Economic growth among our trading partners has slowed broadly in line with the projections in the June Report. Capacity utilisation has fallen, but labour markets are still tight. Higher interest rates and high inflation are curbing economic activity, and growth is expected to be subdued over the next year. International growth prospects are somewhat weaker than projected in June, in particular for China.
Somewhat stronger krone
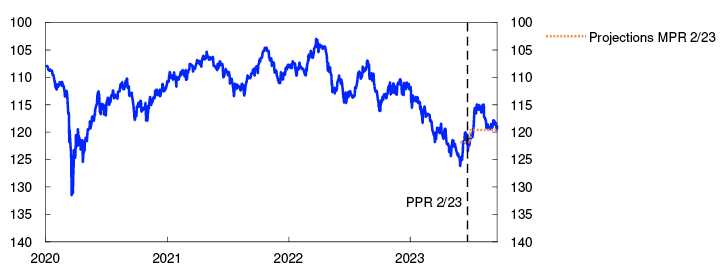
The krone appreciated through summer and has been somewhat stronger than projected in the June Report. The appreciation has coincided with a rise in oil prices and higher interest rates in Norway. Market pricing indicates expectations of a somewhat higher policy rate relative to today’s level of 4%. Interest rates on loans to businesses have risen further since June, and the rise in the average mortgage rate has been broadly in line with expectations.
Import-weighted exchange rate index. I-44
Pressures in the Norwegian economy ease, but labour market remains tight
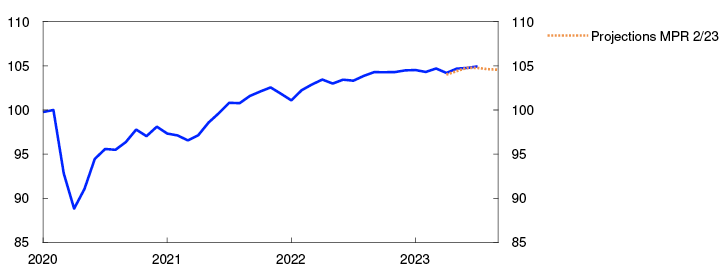
Growth in the Norwegian economy has slowed since last autumn. Mainland GDP has been broadly in line with the June projection. Growth in household consumption has slackened, but less than expected.
GDP for mainland Norway. Seasonally adjusted. Index. February 2020 = 100
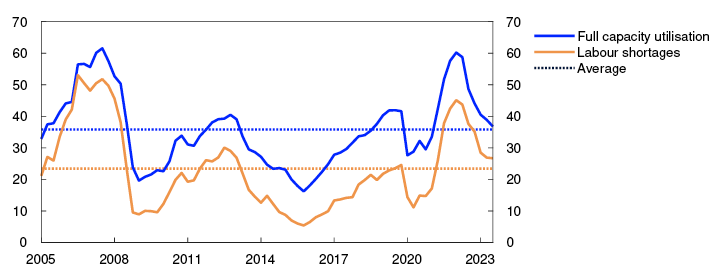
The labour market is still tight. Employment has been higher than expected, and unemployment is low. At the same time, there are signs that the labour market is loosening. The employment rate has edged down a little, and the number of unemployed has risen slightly. The share of enterprises in Norges Bank’s Regional Network reporting that labour shortages are a constraint on production showed little change between Q2 and Q3, after declining since spring 2022. Overall capacity utilisation in the Norwegian economy appears to have fallen but has been somewhat higher than projected in June.
Capacity utilisation and labour shortages according to the Regional Network. Percentage shares
Overall, Regional Network contacts expect an upturn in activity in Q4, but there are wide differences across industries. Growth in oil services is strong thanks to vigorous investment in the petroleum industry. Contacts report that softer household demand and low new home sales are depressing activity in retail trade, construction and manufacturing. The number of unsold existing homes has increased, and house prices have drifted down and been lower than expected.
The rise in interest rates and high inflation will continue to restrain growth in the Norwegian economy ahead. Household consumption and housing investment are expected to contract this year. On the other hand, strong petroleum investment and export growth will support activity in the Norwegian economy in both 2023 and 2024.
Inflation remains markedly above target
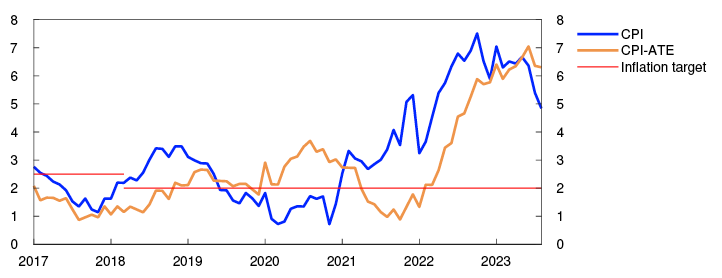
Consumer price inflation (CPI) has drifted down through summer, reflecting a sharp drop in electricity prices, but CPI inflation remains high. The 12-month rise in the CPI moved down to 4.8% in August and was lower than projected in the June Report. The average of different underlying inflation indicators has edged down a little since the June Report. The 12-month rise in the CPI adjusted for tax changes and excluding energy products (CPI-ATE) was 6.3% in August, approximately as projected.
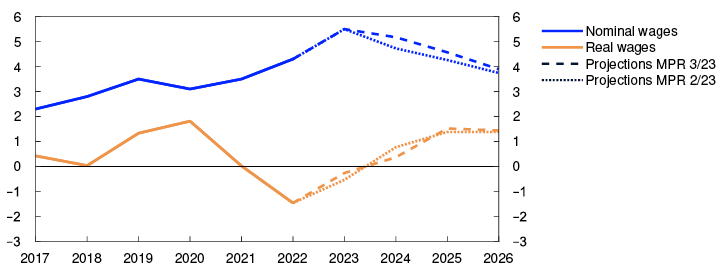
Wage growth is projected at 5.5% in 2023, unchanged from the June Report. The rise in oil prices will boost profitability in parts of manufacturing. Combined with prospects for higher capacity utilisation and a somewhat faster rise in prices than expected, wage growth is set to be higher in 2024 than projected earlier. Both Norges Bank’s Expectations Survey and Regional Network surveys indicate an increase in wage expectations for 2024.
Weaker international inflationary pressures and lower energy prices will curb inflation ahead. On the other hand, higher labour costs and a rapid rise in prices for many intermediate goods will contribute to keeping price inflation elevated.
The expectations survey shows that inflation expectations one to two years ahead have continued to drift upwards a little. Long-term inflation expectations still lie above the 2% target.
CPI and CPI-ATE. Twelve-month change. Percent
Policy rate raised to 4.25%
The operational target of monetary policy is annual consumer price inflation of close to 2% over time. Inflation targeting shall be forward-looking and flexible so that it can contribute to high and stable output and employment and to counteracting the build-up of financial imbalances.
Inflation is high and markedly above target. Persistently high inflation imposes substantial costs on society. The Committee judges that a somewhat higher interest rate is needed to bring inflation down to target within a reasonable horizon.
Growth in the Norwegian economy has slowed, but the labour market remains tight. Business costs have increased considerably in recent years, and labour costs are expected to increase more than projected earlier. This will contribute to keeping inflation elevated ahead. The longer inflation remains elevated, the greater the risk of it becoming entrenched. It may then prove more costly to bring inflation down again at a later stage. On the other hand, the policy rate has been raised significantly over a short period of time, and monetary policy is now having a tightening effect on the economy. The Committee does not want to raise the policy rate more than is necessary to tackle the high level of inflation.
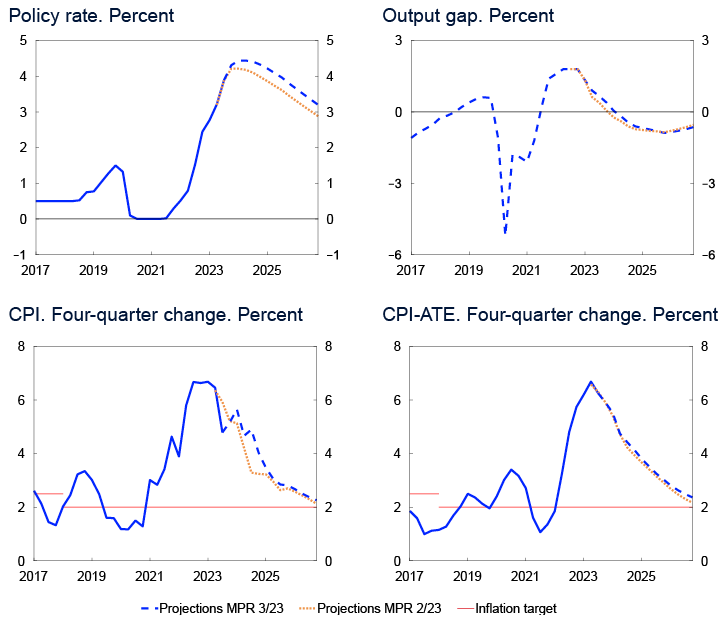
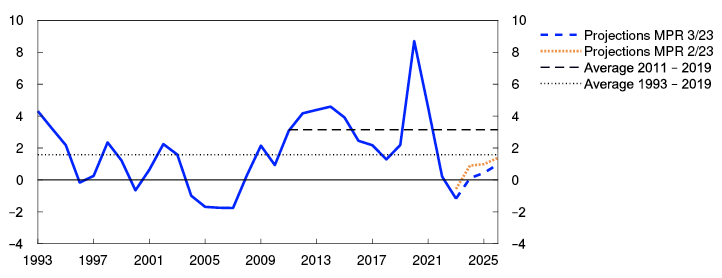
There will likely be a need to maintain a tight stance for some time ahead. The policy rate forecast has been revised up a little compared with the June forecast and indicates that the policy rate will lie around 4.5% through 2024. Economic growth is projected to remain subdued over the next year, before picking up again. Unemployment is expected to edge up. Inflation is projected to recede and approach the target somewhat further out.
There is uncertainty about future economic developments and the extent of the tightening effect of monetary policy at this juncture. If pressures in the economy persist or the krone turns out to be weaker than projected, inflation could remain high for longer than currently envisaged. In that case, the Committee is prepared to raise the policy rate to a further extent than projected in this Report. If there is a more pronounced slowdown in the Norwegian economy or inflation declines more rapidly, the policy rate may be lower than currently envisaged.
The Committee decided unanimously to raise the policy rate by 0.25% percentage point to 4.25% at its meeting on 20 September. Whether additional tightening will be needed depends on economic developments. Based on the Committee’s current assessment of the outlook and balance of risks, there will likely be one additional policy rate hike, most probably in December.
Ida Wolden Bache
Pål Longva
Øystein Børsum
Ingvild Almås
Jeanette Fjære-Lindkjenn
20 September 2023
1 Period: 1 January 2017 – 31 December 2026. Daily data through 19 September 2023. Quarterly data from 2023 Q3 for MPR 2/23 and 2023 Q4 for MPR 3/23. Forward rates at 16 June 2023 for MPR 2/23 and at 19 September 2023 for MPR 3/23. ECB’s deposit facility rate for the euro area.
2 Period: 1 January 2020 – 19 September 2023. A higher I-44 index indicates a weaker krone exchange rate. The axes are inverted.
3 Period: January 2020 – September 2023. Projections from May 2023 for MPR 2/23.
4 Period: 2005 Q1 – 2023 Q3. Share of contacts that will face some or considerable difficulty meeting increased demand and share of contacts citing labour shortages as a constraint on production. The question about labour shortages is asked only to the enterprises reporting full capacity utilisation, but the series shows the share of all contacts included in the interview period.
5 Period: January 2017 – August 2023. CPI-ATE: CPI adjusted for tax changes and excluding energy products.
6 Period: 2017 Q1 – 2026 Q4. Projections from 2023 Q2 for MPR 2/23 and 2023 Q3 for MPR 3/23 for the policy rate, CPI and CPI-ATE. The output gap measures the percentage deviation between mainland GDP and estimated potential mainland GDP. CPI-ATE: CPI adjusted for tax changes and excluding energy products.
1. The global economy
Consumer price inflation is moving down from very high levels in many countries. Trading partner GDP growth is projected to be low in 2023, and growth prospects for 2024 are weaker than in the June 2023 Monetary Policy Report. Oil prices are higher than in the June Report. Policy rate expectations and long-term rates among Norway’s trading partners have risen further since June.
Core inflation expected to decline ahead
Pandemic-related supply and demand conditions and the war in Ukraine have led to high inflation among Norway’s main trading partners since autumn 2021.
Following a peak in summer 2022, US headline inflation has come down to 3.7% (Chart 1.1). In recent months, core inflation has also fallen (Chart 1.2). Currently, higher rents are underpinning core inflation, while the rise in prices for other goods and services is subdued.
Consumer prices. Twelve-month change. Percent
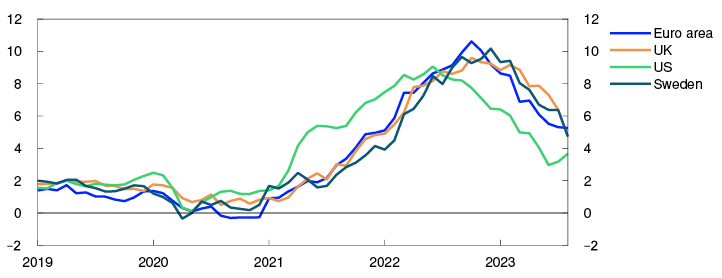
Underlying consumer prices. Twelve-month change. Percent
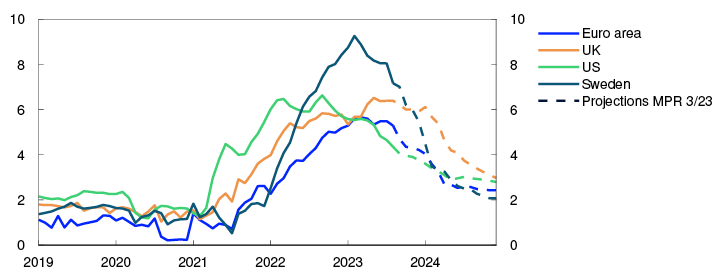
In Europe, headline inflation has also fallen, but the 12-month rise is still above 5%. Core inflation has remained elevated. In Sweden, food prices are included in the measure of core inflation, while they are excluded in the other countries. This is one reason why core inflation is higher in Sweden than in the other countries. In recent months, overall core inflation among Norway’s main trading partners has been broadly as projected in the June Report.
Core inflation among Norway’s main trading partners is expected to moderate in autumn and winter. Freight rates fell to pre-pandemic levels in spring. Prices for a range of commodities, including metals, textiles and food, are far lower than in 2022, but have changed little overall in recent months. Energy prices have also been far lower than in 2022, although oil spot prices have increased by around 25% since the June Report. The rise in futures prices has been somewhat less pronounced. Energy and commodity price developments are discussed further in "Oil prices have risen". Overall wage growth among Norway’s main trading partners is projected to rise to 5% in 2023 and then drift down gradually in the years ahead owing to lower capacity utilisation. Long-term market inflation expectations are close to both US and euro area inflation targets. Expectations have risen slightly in both the US and the euro area since the June Report. Trading partner core inflation is projected at 5.4% in 2023, before slowing to about 3% in 2024 and to around 2% in 2026. Owing in part to prospects for slightly higher wage growth than projected in June, the core inflation projections have been revised up slightly, particularly for the UK.
Higher policy rate expectations abroad
Central banks in Norway’s main trading partner countries have raised policy rates further since June. These central banks continue to describe inflation as too high and emphasise that developments in key economic indicators, in particular inflation and the inflation outlook, will determine the need for further policy rate hikes.
Policy rate expectations have risen further since the June Report, indicating that policy rates abroad will remain close to current levels in 2024. In 2026, policy rate expectations are around 3.5% in the US and around 2.5% in the euro area.
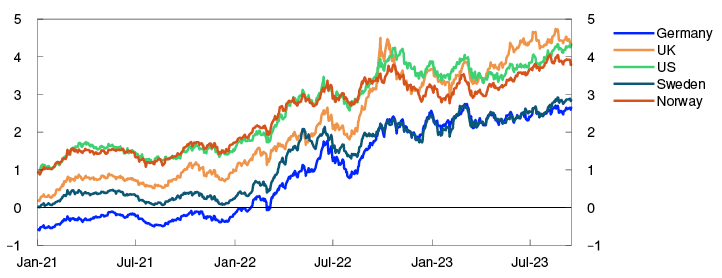
Long-term government bond yields have risen, particularly in the US (Chart 1.3). Equity indexes in main trading partner countries show little change since the June Report, while corporate bond risk premiums have edged down.
Ten-year government bond yields. Percent
International growth likely to remain low in the coming year
Output in main trading partner countries is likely close to potential, but unemployment remains low. International GDP growth is expected to be low in the coming year (Chart 1.4).
GDP for trading partners. Quarterly change. Percent
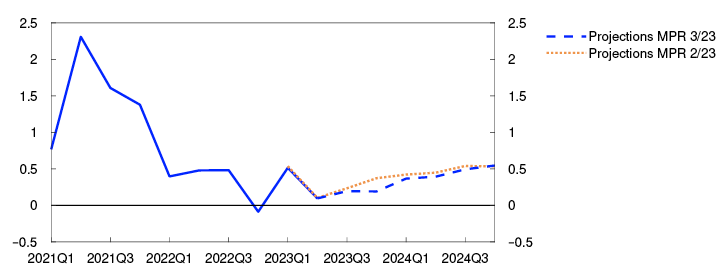
For trading partners as a whole, GDP growth in 2023 Q2 was in line with that projected in the June Report. Among Norway’s main trading partners, China and the US reported the strongest growth in GDP and activity in Sweden showing a pronounced fall.
In the US, increased consumer confidence and stronger growth in both household consumption and the housing sector have likely contributed to solid GDP growth in spring and summer. Monetary policy tightening is expected to weigh more heavily on activity ahead and growth is projected to slow from the end of 2023 and remain low in 2024.
In China, GDP growth was slightly higher than expected in Q2, but housing market activity is declining and growth in household consumption and business investment is weak. Heightened uncertainty, both in the wake of the pandemic and concerning relations between China and the US, as well as low demand for Chinese goods from both the US and Europe are weighing on growth prospects. Unlike previously, the Chinese authorities have so far been cautious in implementing measures to stimulate the economy. This is likely because debt levels in China are already high, particularly in the local government sector, and among real estate developers and state-owned firms. Projected growth in China has been revised down for both 2023 and 2024 compared with the June Report.
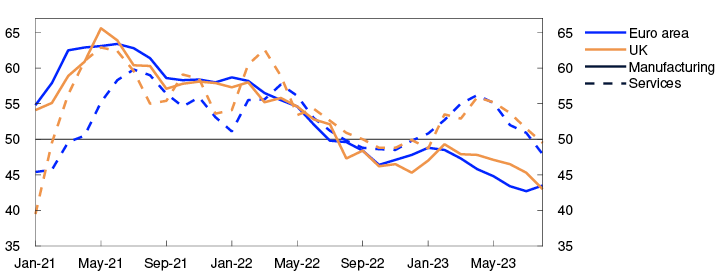
In Europe, high inflation and higher interest rates are weighing on household purchasing power and consumption in 2023, reflecting the high level of inflation and higher interest rates. Activity indicators for manufacturing and services have fallen and point towards very low growth in summer and autumn (Chart 1.5). Both households and firms face tighter lending conditions, and credit growth has declined markedly. In addition, higher oil prices and lower demand from China are dampening growth ahead.
PMI. Manufacturing and services
Policy rates are assumed to move in line with market policy rate expectations and commodity prices to move in line with futures prices. Higher real wages will at some point in time likely lift household purchasing power, and higher defence spending and energy investment in Europe are also likely to boost activity over the projection horizon. In the UK, there are plans for fiscal tightening. Trading partner GDP growth is projected to slow from 3.4% in 2022 to 1% in 2023, before edging up again in 2024 (see Annex Table 1). The projection for 2024 has been revised down from the June Report.
Uncertainty surrounding the economic outlook
The effects of monetary policy tightening are uncertain both because rate hikes have been substantial and rapid and because many countries are tightening monetary policy at the same time. Higher costs faced by households and firms may lead to lower consumption and investment among trading partners than currently envisaged. Consumer price inflation may then also fall more rapidly. On the other hand, growth may prove to be stronger than expected if households spend a larger share of their savings. If wage earners are compensated for the high level of inflation to a larger extent than projected, or if firms increase their margins, price and wage inflation could prove higher than currently projected. If there is a further pronounced decline in the Chinese real estate market, Chinese economic growth is likely to contract more than projected, with a potential fall in commodity prices. Heightened political tensions between the US and China are also adding to the uncertainty about international developments ahead, as is the ongoing war in Ukraine.
Oil prices have risen
Oil prices have risen, while gas prices are little changed from June. Norwegian electricity prices have fallen.
Oil prices have risen since June and are now around USD 95 per barrel (Chart 1.A). The rise in prices may reflect the continued recovery in global oil consumption after the pandemic. OPEC+ countries have maintained the same level of cuts in oil production as in June, and Saudi-Arabia and Russia have made additional cuts. Despite higher oil prices, the rise in non-OPEC+ oil production, particularly in the US, is slower than earlier. Oil inventories are expected to decrease markedly in the remainder of 2023.
Oil futures prices are higher than in June, but still indicate that oil prices will decline somewhat ahead (Table 1.A). If OPEC+ and Saudi-Arabia and Russia extend their oil production cuts, oil inventories may fall substantially and lead to higher prices than indicated by futures prices. On the other hand, oil prices may fall more than implied by futures prices if the outlook for the global economy deteriorates more than projected, particularly if the Chinese economy slows more than expected.
Table 1.A Energy and commodity prices
|
Percentage change from projections in Monetary Policy Report 2/23 in brackets |
Average price (2010–2019) |
Actual prices and futures prices1 |
|||||
|
2021 |
2022 |
2023 |
2024 |
2025 |
2026 |
||
|
Oil, USD/barrel |
80 |
71 |
101 |
84 (8) |
86 (18) |
80 (13) |
76 (10) |
|
Dutch gas, USD/barrel |
40 |
87 |
205 |
71 (-5) |
88 (-1) |
81 (5) |
67 (10) |
|
Petroleum2, USD/barrel |
63 |
85 |
163 |
78 (2) |
88 (6) |
82 (9) |
72 (11) |
|
Coal, EUR/tonne |
66 |
102 |
290 |
118 (4) |
122 (18) |
122 (21) |
120 (19) |
|
Emission allowance prices, EUR/tonne |
10 |
53 |
81 |
85 (-4) |
85 (-11) |
89 (-10) |
92 (-10) |
|
German electricity, øre/kWh |
36 |
106 |
258 |
123 (-8) |
149 (-11) |
138 (-6) |
124 (4) |
|
Nordic electricity, øre/kWh |
32 |
64 |
142 |
62 (-23) |
58 (-26) |
58 (-13) |
52 (-4) |
|
Electricity in South Norway, øre/kWh |
31 |
78 |
206 |
81 (-25) |
83 (-23) |
80 (-17) |
74 (-8) |
|
Electricity in Northern Norway and Central Norway, øre/kWh |
32 |
40 |
38 |
36 (-28) |
32 (-22) |
33 (-18) |
36 (-10) |
|
Aluminium, in thousands of USD/tonne |
1.9 |
2.5 |
2.7 |
2.2 (-3) |
2.3 (-4) |
2.4 (-3) |
2.5 (-3) |
|
Copper, in thousands of USD/tonne |
6.8 |
9.3 |
8.8 |
8.6 (-1) |
8.5 (-1) |
8.5 (0) |
8.6 (0) |
|
Wheat, USD/tonne |
210 |
202 |
331 |
244 (-4) |
240 (-12) |
252 (-8) |
- |
|
Maize, USD/tonne |
183 |
143 |
271 |
228 (-8) |
197 (-14) |
201 (-4) |
196 (-1) |
1 Futures prices at 15 September 2023.
2 An estimated Norwegian petroleum export price. The price has been estimated based on the share of oil and gas in historical export figures. For futures prices, oil and gas shares are calculated on the basis of expected market prices.
Sources: Refinitiv Datastream and Norges Bank The European gas benchmark price is little changed since June. Gas consumption in Europe has decreased over the past year and gas inventories are now at a high level for this time of year. However, Europe is dependent on stable gas imports from other countries after the halt in Russian gas supply since summer 2022. Uncertainty related to gas exports from Australia, one of the world’s largest liquefied natural gas (LNG) exporters, has led to considerable volatility in gas prices in recent months (Chart 1.A).
USD/barrel
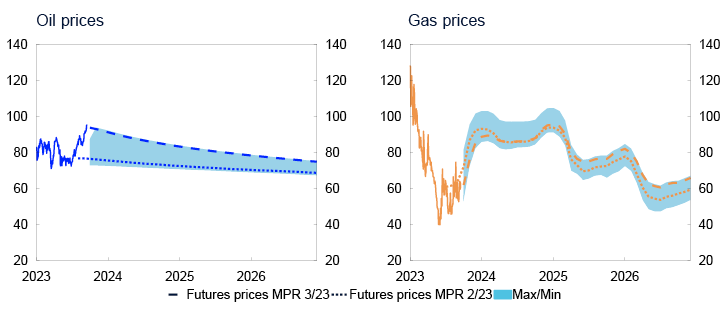
Gas futures prices show a rise from today’s relatively low levels in the period to winter but are lower than at the time of the June Report. High gas inventories may dampen a price rise if gas consumption were to pick up, for example in the event of a cold winter, or if LNG supply to Europe were to be reduced. Futures prices further ahead have edged up since June and are well above the historical average, likely reflecting considerable uncertainty about the gas supply challenges facing Europe in the years ahead.
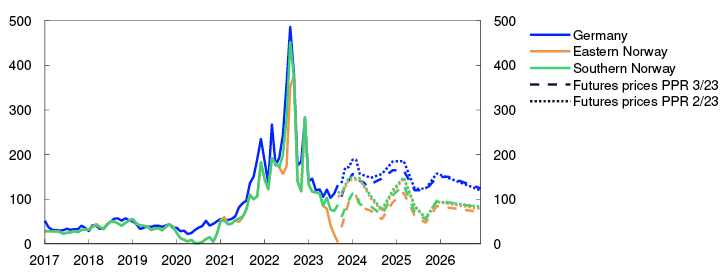
European wholesale electricity prices have largely moved in line with gas prices. As gas-fired power plants have often been the marginal production technology, the cost of gas production has set electricity prices. The number of hours needed for gas power as the marginal production technology will be fewer as wind and solar capacity continues to expand. Electricity prices may then vary considerably over short periods, depending on whether gas power or other cheaper sources of energy, such as wind and solar, set electricity prices. Futures prices for European electricity indicate a rise as winter approaches, albeit a smaller increase than indicated in June. Futures prices suggest that prices will be lower ahead than in 2022 but nevertheless remain at a relatively high level.
Electricity prices in Eastern and Western Norway have fallen substantially since June owing to heavy precipitation and higher water reservoir levels. In Southern Norway, electricity prices have been underpinned by high transmission capacity from Norway to other countries, less precipitation and limited transmission capacity between certain areas in South Norway (Southern Norway, Eastern Norway and Western Norway) (Chart 1.B). Prices in Northern Norway and Central Norway are still relatively low. Price differences in the areas in South Norway are expected to be balanced out in the course of autumn, as in 2022, and futures prices indicate that electricity prices will increase as winter approaches. Nevertheless, futures prices have fallen compared with June futures prices owing to considerably higher water reservoir levels. Futures prices in Northern Norway and Central Norway remain lower than in the areas in South Norway.
Øre/kWh
Industrial metals prices are little changed since June. Futures prices indicate slightly higher prices than current levels and somewhat above pre-pandemic levels. Recently, new stimulus measures in China have likely contributed to underpinning the prices.
Global agricultural commodity prices have fallen since June. Russia has withdrawn from the agreement that ensures safe passage of Ukrainian grain via the Black Sea and has attacked ports and grain silos. Nevertheless, wheat spot and futures prices are lower than in June, likely reflecting record-high crop yields through 2022.
As a result of floods in key production areas, India has imposed an export ban on certain rice varieties, which has pushed up prices in adjacent markets and is likely part of the reason why rice futures prices are higher compared with June. Climate change and weather phenomena such as El Niño could have a greater impact on agricultural commodity prices ahead.
1 Period: January 2019 – August 2023. Last observation is July for the UK.
2 Period: January 2019 – December 2024. Projections from September 2023. For the US, energy and food products are excluded from consumer prices in core CPI, for the euro area and the UK, energy, food products, tobacco and alcohol are excluded, and for Sweden, energy prices are excluded.
3 Period: 1 January 2021 – 15 September 2023.
4 Period: 2021 Q1 – 2024 Q4. Projections from 2023 Q2 for MPR 2/23 and from 2023 Q3 for MPR 3/23. Export weights. 13 trading partners.
5 Period: January 2021 – August 2023. Survey of purchasing managers. Diffusion index centred around 50.
2. Financial conditions
Financial conditions are tighter than at the time of the June 2023 Monetary Policy Report, owing to a higher policy rate and higher long-term market interest rates. The average residential mortgage rate is set to rise to around 5.7% in 2024. The krone has been a little stronger than projected in the June Report.
2.1 The policy rate and market policy expectations
Market policy rate expectations rose after the policy rate was raised from 3.25% to 3.75% in June. Expectations rose further over summer, partly after consumer price data for June indicated higher-than-expected prices, but since then, expectations edged down again. The decision to raise the policy rate from 3.75% to 4.0% percent in August had little effect on the markets. On the whole, market policy rate expectations for the coming years are higher than at the time of the June Report, but a little lower than the policy rate forecast in this Report.
Financial conditions summarise developments in the financing terms for banks, households and firms. Higher interest rates have contributed to tighter financial conditions than in June. Other financial conditions, as measured by Norges Bank’s financial conditions index (FCI), are a little looser than in June (Chart 2.1). The decline in the FCI primarily reflects slightly lower foreign exchange market volatility and a rally in equity markets.
Financial conditions index. Standard deviation from mean
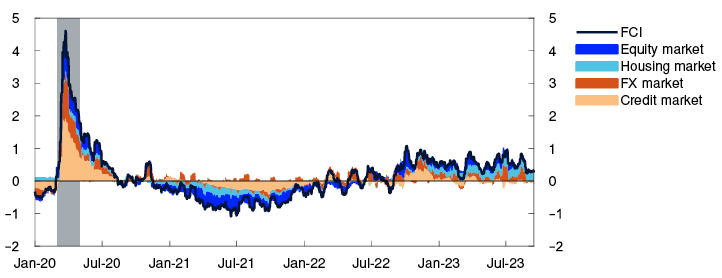
1 Period: 1 January 2020 – 15 September 2023. The Financial conditions index (FCI) provides an overall picture of the price and availability of different types of financing beyond that indicated by the policy rate and policy rate expectations further out. It provides an indication of the tightness or accommodativeness of financial conditions compared with a historic average. For more on the Norwegian FCI, see Monetary Policy Report 4/2022 and Bowe, F., K.R. Gerdrup, N. Maffei-Faccioli og H. Olsen (2023): “A high-frequency financial conditions index for Norway”, Norges Bank Staff Memo 1/2023.
2.2 Interest rates facing households and firms
Household interest rates have risen further
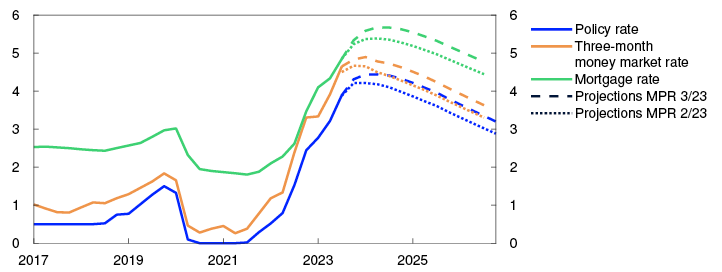
At the end of July, the average residential mortgage rate was 4.7% (Chart 2.2). The average residential mortgage rate includes all floating- and fixed-rate loans. Quoted rates on new loans from Finansportalen indicate a further rise in mortgage rates since July. So far, close to 90% of the increase in the policy rate since autumn 2021 has passed through to mortgage rates. Looking ahead, the transmission of the policy rate to mortgage rates is projected to remain broadly the same as observed so far during the tightening cycle. The policy rate forecast in this Report implies that the average residential mortgage rate will rise to 5.7% in 2024, before edging down from 2025.
Interest rates. Percent
Transmission from the policy rate to household deposit rates weakened somewhat between Q1 and Q2. Since the beginning of the tightening cycle in autumn 2021, the average household deposit rate has risen by around half as much as the increase in the policy rate. In the period ahead, policy rate transmission to deposit rates is expected to strengthen somewhat, owing to increased competition for household deposits, partly because households will draw down savings (see discussion in Section 3.1).
Higher borrowing costs for firms
The policy rate increase has also driven up borrowing costs for firms. At the end of July, the interest rate on new floating-rate corporate loans was 6.2%, measured as a weighted average of bank and bond debt (Chart 2.3), close to 1 percentage point higher than three months previously.
Interest rates on new floating-rate NOK finance for non-financial corporates. Percent
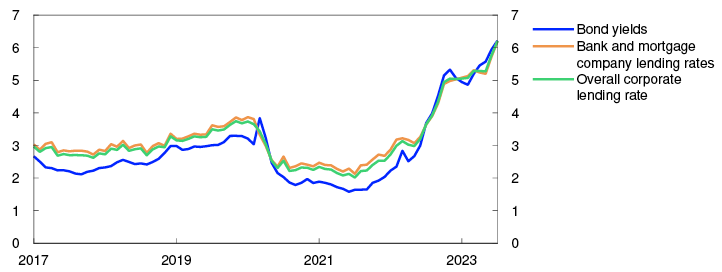
The interest rate on corporate bank loans is usually based on three-month Nibor, plus a margin set for each firm. Three-month Nibor has risen since June, primarily in response to a higher policy rate and expectations that it will be raised somewhat further ahead. Nibor also reflects a risk premium in addition to the expected policy rate. So far in Q3, this premium has on average been just below half a percentage point. In the coming quarters, the premium is set to remain at around this level before edging down (Chart 2.4). The projections are close to the market’s pricing of the premium in forward money market rates.
Money market premium. Percentage points

The average margin firms pay above Nibor on new loans fell somewhat in Q2. At the same time, Norges Bank’s lending survey indicates that the margin on new corporate loans was broadly unchanged between Q1 and Q2.
On the whole, bond market risk premiums for non-financial corporates have fallen a little since June. The same applies to banks, for whom bond funding terms appear to be favourable. Funding conditions are more demanding for commercial real estate (CRE) firms, where risk premiums have risen a little further from already high levels. This reflects the fact that higher interest rates weaken CRE firms’ profitability and that commercial property prices are expected to fall further.
Long-term market rates form the basis for fixed-rate corporate loans. Since June, long-term swap rates have risen by close to 0.4 percentage point to their highest level in over 10 years. The rise reflects similar developments in other countries.
Firms can also obtain equity financing. Overall equity prices on Oslo Børs have risen a little since the June Report. Initial public offerings are at historically low levels, while share issues by already listed companies are around the levels prevailing before the pandemic.
2 Period: 2017 Q1 – 2026 Q4. Projections from 2023 Q2 for MPR 2/23 and from 2023 Q3 for MPR 3/23. The mortgage rate is the average rate on outstanding mortgage loans to households from the sample of banks and mortgage companies included in Statistics Norway’s monthly interest rate statistics.
3 Period: January 2017 – July 2023.
4 Period: 1 January 2017 – 31 December 2026. Five-day moving average. Latest observation on 15 September 2023. Projections from 2023 Q2 for MPR 2/23 and 2023 Q3 for MPR 3/23. The premium in the Norwegian money market rate is the difference between the three-month money market rate and the expected policy rate.
2.3 Household and corporate access to credit
Growth in credit to both non-financial corporates and households has slowed over the past year. Household credit growth is now at its lowest since the mid-1990s, likely reflecting reduced demand for loans as interest rates have risen. Creditworthy households and firms still appear to have ample access to credit. According to Norges Bank’s lending survey for Q2, banks report unchanged credit standards for households and non-financial corporates, except for CRE firms, where standards were tightened further. Banks have also previously reported somewhat higher risk that CRE borrowers will breach their loan covenants. Banks’ large CRE exposures are a key vulnerability in the Norwegian financial system (see Financial Stability Report – 2023 H1).
2.4 Krone exchange rate
Measured by the import-weighted exchange rate index I-44, the krone appreciated through July, in tandem with the increase in the interest rate differential against other countries, oil prices and international equity indexes. The interest rate differential and international equity indexes have since fallen a little, and the krone has weakened somewhat. The krone is now a good 1% stronger than at the time of the June Report. So far in Q3, the average krone exchange rate has been just under 2% stronger than projected in June.
The krone exchange rate is projected to appreciate a little in the near term, in the light of the policy rate forecast in this Report, which is somewhat higher than market expectations. The krone is then projected to appreciate moderately, as the risk premium on the krone is expected to edge down. The projections for the krone further out in the projection period are little changed on the June Report (Chart 2.5).
3. The Norwegian economy
Consumer price inflation is markedly above the 2% target. Unemployment is low but has recently edged up a little.
Higher interest rates have led to a slackening of economic activity in Norway. Inflation is projected to fall and approach the inflation target somewhat further ahead on the back of lower capacity utilisation, weaker international inflationary impulses and lower energy prices. Unemployment is expected to rise somewhat.
3.1 Output and demand
Low growth in the mainland economy
Following solid growth in the Norwegian economy through 2022, growth has slowed so far in 2023. Mainland GDP was virtually unchanged in Q2 and rose by 0.2% in July. The level of activity has been broadly as expected in the June 2023 Monetary Policy Report.
Overall, Norges Bank’s Regional Network enterprises expect output to rise slightly to the end of 2023, but there are wide differences across sectors (Chart 3.1). Oil services contacts expect strong growth ahead owing to high petroleum sector activity in Norway and abroad. Services contacts also expect activity to increase.
Expected output growth according to the Regional Network. Seasonally adjusted. Percent
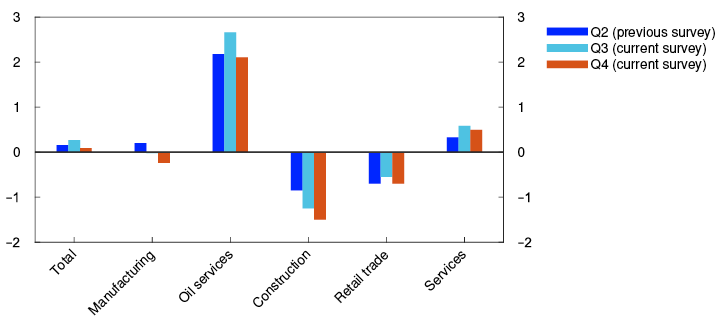
On the other hand, several sectors expect activity to decline. A low level of residential construction is weighing on construction and manufacturing activity. Retail trade contacts expect output to fall, albeit somewhat less than in the June.
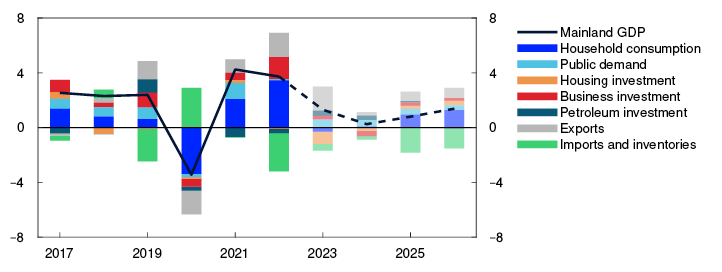
The Norwegian economy is assessed to have reached the peak of the upturn in the second half of 2022. Growth is expected to edge up in the coming quarters. The projections for the current and subsequent quarters have been revised up slightly from the June Report and are in line with the expectations of Regional Network contacts. In the projection, mainland GDP increases by 1.3% in 2023 (Chart 3.2). Higher interest rates and high inflation have dampened demand in the Norwegian economy, and household consumption and housing investment are expected to fall in 2023. On the other hand, a high level of activity in petroleum-related industries contribute to underpinning activity in both 2023 and 2024. Mainland GDP growth is weak in 2024, owing to prospects for a marked decline in business investment. Public demand supports activity throughout the projection period. Towards the end of the projection period, activity picks up gradually, primarily owing to higher private consumption. Mainland GDP projections for the years ahead are little changed from the June Report.
GDP for mainland Norway. Annual change. Contribution to annual change. Percentage points
Higher interest rates and inflation curb consumption
Following high volatility around the beginning of the year, household consumption growth was weak in Q2. Goods consumption, particularly household car purchases, has varied widely. Consumption growth has moderated so far in 2023 but has been slightly stronger than projected. Goods consumption has fallen less than projected, while growth in services consumption has been slightly higher than expected (Chart 3.3). Card transaction data suggest that services consumption remained stable in September, while goods consumption increased slightly (see "Card data help us prepare forecasts of household consumption").
Household consumption of goods and services. Constant 2020 prices. Seasonally adjusted. In billions of NOK
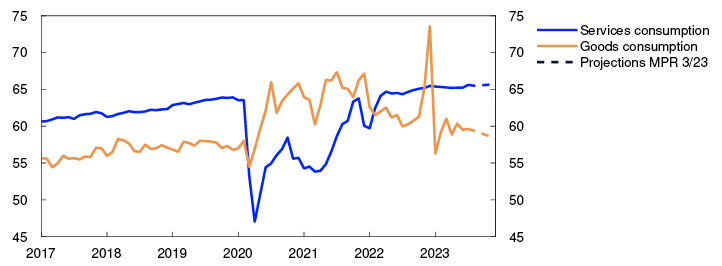
In the projection, weaker purchasing power results in a decline in goods consumption in 2023, while services consumption rises slightly. This is in line with information from Regional Network contacts, where household-oriented services enterprises expect increased demand and retail trade enterprises expect a marked decline in the period ahead.
Higher interest expenses and prospects for a decline in real wages pull down household real disposable income by close to 2% in 2023. In the years ahead, growth in household wage income is projected to be higher than inflation, pushing up household real disposable income from 2024. Improved purchasing power contributes to lifting growth in household consumption. Overall, the projections for both household consumption and real disposable income are slightly higher than in the June Report.
After historically high saving during the pandemic, the household saving ratio fell markedly in 2021 and 2022 (Chart 3.4). The saving ratio was negative in 2023 Q2 and indicates that households have either drawn on savings or increased borrowing to maintain consumption. In the projection, household consumption falls less than household income through 2023, but the saving ratio increases again from 2024.
Household saving ratio excluding dividends. Percent
Weak developments in house prices and housing investment
After rising slowly through spring, house prices have fallen over summer. Existing home sales have been approximately normal, while the number of unsold homes increased. House price developments have been weaker than expected.
House prices are expected to fall slightly through autumn, partly reflecting higher lending rates and the large stock of unsold homes. In 2024, house prices are expected to rise slowly before picking up in 2025 and 2026 on the back of low residential construction activity and mortgage rates that are set to stabilise and eventually decline. While the decline in nominal house prices will likely be moderate compared with previous downturns, high inflation leads to a substantial fall in real house prices (Chart 3.5). Near-term projections of both nominal and real house prices have been revised down from the June Report.
Fall in seasonally adjusted house prices from most recent peak. Prices increase when the line is at zero. Percent

Housing investment fell markedly in Q2 and fell further in July. Weak developments in prices for existing homes and high construction costs have likely contributed to reducing investment so far in 2023. The decline has been slightly more pronounced than projected in the June Report. Housing investment is projected to continue to fall a little ahead owing to continued weak new home sales and a considerable decline in housing starts (Chart 3.6). Further ahead, housing investment is projected to recover somewhat, but projections have been revised down since June.
Housing investment. Constant 2020 prices. Seasonally adjusted. In billions of NOK
Household interest expenses have increased substantially
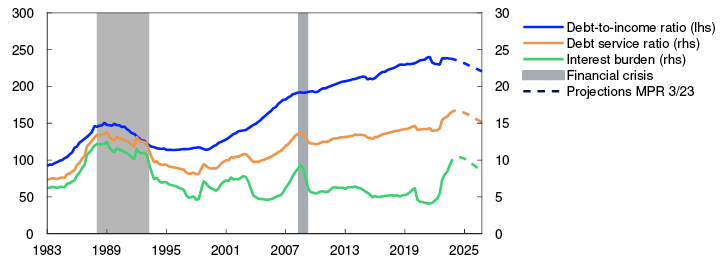
The policy rate has been raised considerably over the past two years. Together with high debt burdens, this has contributed to a marked rise in household interest expenses (Chart 3.7). High indebtedness can increase household vulnerability to unexpected changes in income. It also makes household purchasing power more sensitive to interest rate increases than when debt-to-income ratios are low. Prospects for somewhat higher residential mortgage rates through 2024 than indicated in the June Report will also result in some further increase in household interest expenses. The Bank’s analysis of how the policy rate affects different households suggests that most households have the financial means to cope with higher interest burdens7, although some are likely to tighten consumption when interest expenses account for a larger share of their disposable income.
Percent
Household borrowing has recently declined. Lower residential construction and house prices are set to dampen credit growth ahead. The projections for household borrowing have been revised down compared with the June Report.
Lower business investment in 2024
Business investment increased markedly in 2022, with services investment in particular showing a substantial rise. So far in 2023, growth in business investment has slowed, with business investment growth projected to slacken appreciably in 2023 followed by a contraction in 2024 (Chart 3.8). In the projection, strong cost inflation, higher interest rates and weaker profitability for many firms weigh on investment ahead. Services investment falls in 2023 and 2024, in line with information from Regional Network contacts. On the other hand, the climate and energy transition will push up investment in manufacturing and power supply ahead. Prospects for lower business investment curb credit demand. The projections for both business investment and corporate credit growth have been revised down since the June Report.
Business investment in mainland Norway. Annual change. Contribution to annual change. Percentage points

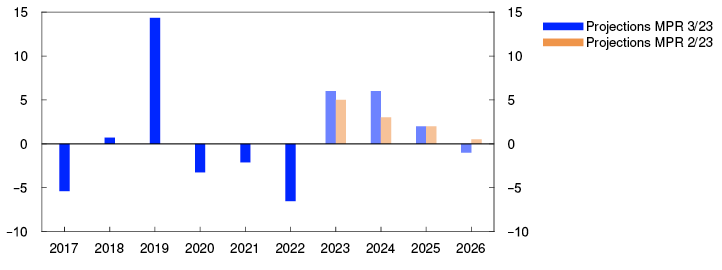
Petroleum investment fell each year between 2019 and 2022, primarily reflecting the completion of various large development projects at the same time as the number of development starts was relatively low. However, owing to the petroleum tax package, oil companies submitted a series of development projects towards the end of 2022. Oil and gas investment is therefore expected to rise substantially until the mid-2020s (Chart 3.9). The projected rise is stronger than in the June Report, partly because of the increase in oil and gas futures prices since June and partly because the latest investment intentions survey from Statistics Norway indicates that investment in 2023 and 2024 will be higher than previously projected.
Annual change. Percent
Mainland exports increased considerably in 2022 (Chart 3.10), driven primarily by increased inbound travel and exports from suppliers of services related to oil, gas and renewable energy. Energy services exports are also expected to rise considerably in 2023, driven by higher investment in global energy production. Other exports also appear set to increase substantially, despite sluggish growth among trading partners. The projections for mainland exports are higher than in the June Report, reflecting somewhat higher exports in the first half of 2023 than assumed in June.
Exports and imports. Annual change. Percent
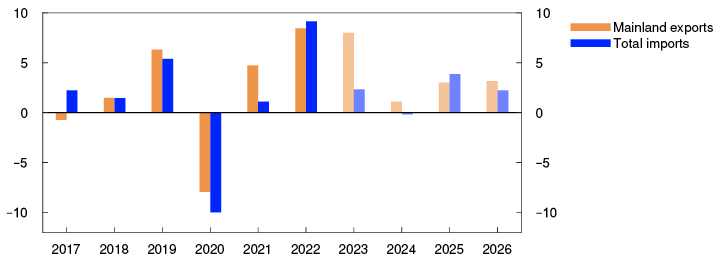
The normalisation of travel habits as reflected in increased border shopping and travel abroad led to a marked pick-up in imports in 2022. So far in 2023, imports have fallen slightly, and weak household demand together with a weaker krone exchange rate in 2023 is projected to curb import growth in 2023 and 2024. Further out in the projection period, imports pick up in pace with higher activity in the Norwegian economy. The near-term projections are slightly lower than in the June Report.
Public demand will cushion the decline in activity in 2024
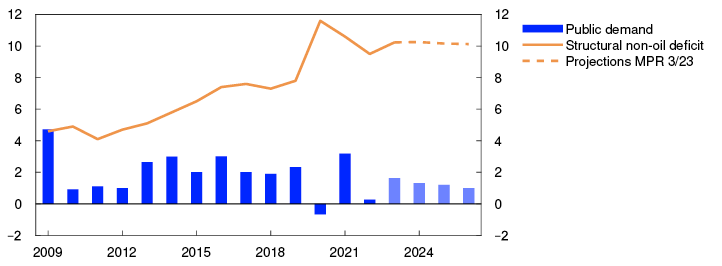
After rising through 2022, growth in public demand has continued so far in 2023, primarily driven by high consumption growth in the local government sector. Growth in public demand is projected to moderate somewhat in the second half of 2023, and overall growth in public demand in 2023 is set to be broadly in line with projections in the June Report. Rapid growth in public demand pulls up activity in 2023. Growth is expected to moderate in the coming years. In isolation, prospects for lower capacity utilisation are helping to sustain public demand.
Following a marked rise in petroleum revenue spending in 2020, the structural non-oil deficit as a percentage of trend GDP has declined somewhat in recent years (Chart 3.11). The deficit is projected to increase in 2023. In the years ahead, deficit spending is assumed to decline slightly. The projection for the structural non-oil deficit is little changed since the June Report.
Public demand. Annual change. Structural non-oil deficit. Share of trend mainland GDP. Percent
The projections are uncertain
According to Norges Bank’s Regional Network, there are wide differences among enterprises in their assessment of the outlook, which makes it difficult to interpret the growth prospects for the economy as a whole. There is also uncertainty related to households’ response to higher consumer prices, higher interest rates and lower house prices. Recent policy rate hikes have yet to pass through to interest rates facing households, and the extent to which households draw on savings to maintain their consumption when their purchasing power declines is unclear. If house prices fall more than assumed, household consumption may fall more than projected.
SMART – System for Model Analysis in Real Time
Empirical models are an important tool for forecasting developments in the Norwegian and international economy. The System for Model Analysis in Real Time (SMART) is Norges Bank’s platform for forecasting models. In SMART, forecasts from a broad set of empirical models are averaged based on their historical forecasting properties. The SMART forecasts for GDP have been revised down from the June Report. The model forecasts for CPI-ATE inflation have been revised up.
The economics literature shows that averaged forecasts from several models are often more accurate than forecasts from individual models. In SMART, we average information from many models for CPI-ATE inflation and mainland GDP based on how well the models have previously forecast economic developments. Read more about SMART in Staff Memo 7/23.1 Forecasts from models are an important tool in evaluating the outlook for the Norwegian economy, but multiple factors may contribute to differences between the model forecasts and the final projections. For example, deviations may be due to judgement-based assessments of drivers that differ from what the historical relationships would suggest. Deviating model forecasts both currently and at the time of previous reports also mean that the change in the model forecast since the previous Report may not necessarily be in the same direction as the change in the final projection.
The SMART forecasts for inflation, measured as the four-quarter change in the CPI-ATE, have been revised up from the June Report (left panel in Chart 3.A). The modelling system forecasts a four-quarter change of 6.2% and 6.1% in Q3 and Q4, respectively. The forecasts indicate that the inflation peak is behind us.
Four-quarter change. Percent
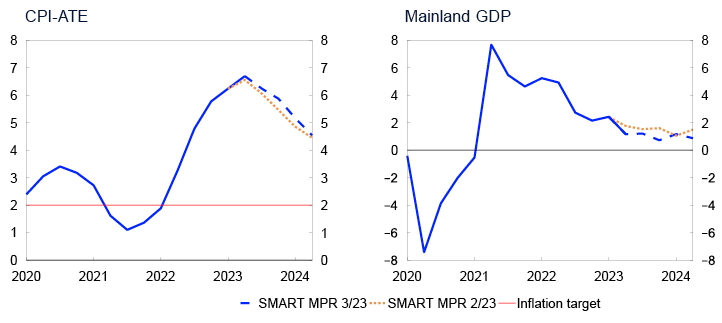
The SMART mainland GDP forecasts are a little lower than in the June Report (right panel in Chart 3.A). SMART forecasts four-quarter growth of 1.2% in 2023 Q3 and 0.7% in Q4.
The upward revision of the SMART forecasts for CPI-ATE largely reflects the fact that inflation has been higher than the SMART forecasts in the June Report (left panel in Chart 3.B). The model forecasts for 2023 Q3 have been revised up substantially since the beginning of 2022, in pace with accelerating inflation. There have been minor changes in the model forecasts through summer, and new information has contributed to a small decline in the CPI-ATE in the recent period.
SMART forecasts for 2023 Q3 at different times. Four-quarter change. Percent
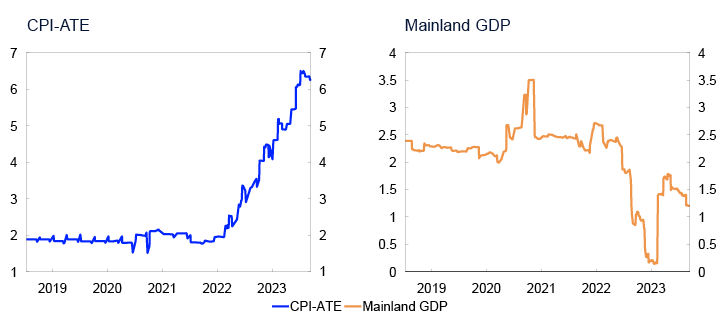
The downward revision of the SMART mainland GDP forecasts largely reflects weaker reported activity than the modelling system expected in Q2 (right panel in Chart 3.B). In earlier periods, the SMART mainland GDP growth forecast for 2023 Q3 has varied, and since the beginning of 2023, the forecasts have been pulled up considerably.
1 Bowe, F., I.N. Friis, A. Loneland, E. Njølstad, S.S. Meyer, K.S. Paulsen and Ø. Robstad (2023). “A SMARTer way to forecast”. Staff Memo 7/2023. Norges Bank
2 Period: 2020 Q1 – 2023 Q4. CPI-ATE: CPI adjusted for tax changes and excluding energy products. Projections from 2023 Q2 for MPR 2/23 and from 2023 Q3 for MPR 3/23. The SMART modelling system for short-term projections is based on historical relationships. It averages empirical models based on previous forecasting properties.
3 Period: 10 July 2018 - 15 September 2023
1 Period: May and August 2023. Expected growth current and next quarter.
2 Period: 2017 – 2026. Projections from 2023. Here, the data for petroleum investment include investment in international shipping. Public demand = Public consumption + Public investment.
3 Period: January 2017 – December 2023. Projections from August 2023.
4 Period: 1993 – 2026. Projections from 2023 for MPR 2/23 and MPR 3/23.
5 Period: 2000 Q1 – 2026 Q4. Projections from 2023. Real house prices are calculated as nominal house prices deflated by the CPI.
6 Period: 2012 Q1 - 2026 Q4. Projections from 2023 Q2 for MPR 2/23 and from 2023 Q3 for MPR 3/23.
7 Lindquist, K.-G., H. Solheim and B.H. Vatne (2022). “Norwegian homeowners’ debt-servicing capacity is adequate” Staff Memo 8/2022. Norges Bank.
8 Period: 1983 Q1 – 2026 Q4. Projections from 2023 Q3 for MPR 3/23. Debt-to-income ratio is debt as a share of disposable income. Disposable income is after-tax income less interest expenses. Debt service ratio is interest and estimated principal payments on loan debt to after-tax income. Interest burden is interest payments as a share of after-tax income.
9 Period: 2017 – 2026. Projections from 2023.
10 Period: 2017 – 2026. Projections from 2023.
11 Period: 2017 – 2026. Projections from 2023
12 Period: 2009 – 2026. Projections from 2023
3.2 Labour market
The labour market is tight
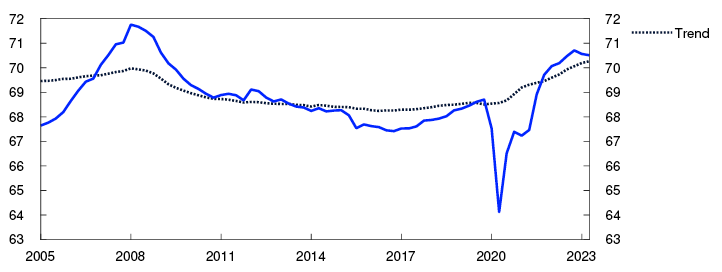
Unemployment remains low, and the employment rate is high (Chart 3.12). At the same time, there are signs of easing labour market pressures. Following a marked rise through 2022, employment growth slowed in the first half of 2023, and the employment rate has also declined slightly. Employment has nonetheless been slightly higher than projected in the June Report and there were 47 000 more people employed in 2023 Q2 than one year earlier. So far in 2023, employment has increased more than output, leading to a decline in productivity.
Employed as a share of the population aged 15–74. Percent
Unemployment has increased a little since June, in line with the projections in the June Report. In August, 54 600 persons were registered as fully unemployed, ie 1.9% of the labour force adjusted for normal seasonal variations. After unemployment began to rise in summer 2022, there has been a particular increase in the number of unemployed in construction. The share of unemployed has also risen somewhat across most other occupations. Some of the rise reflects the increased number of Ukrainians that have entered the labour market over the past year.
The total supply of labour has increased owing to both a slight rise in unemployment and a rise in employment since 2022. This partly reflects the increased inflow of immigrants to Norway and a slight increase in the number of temporary foreign workers over the past year.
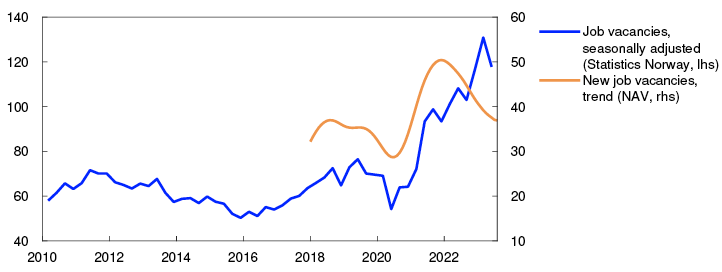
High labour demand
Labour demand is high even though it is showing signs of abating. According to Statistics Norway’s sample vacancy survey, the number of vacancies fell markedly in Q2 but remains high (Chart 3.13). At the same time, NAV statistics show that the number of newly advertised vacancies declined further in recent months and is close to pre-pandemic levels, which also suggests that the stock of vacancies is likely to decrease further ahead.
Number of job vacancies in thousands
The share of Norges Bank’s Regional Network contacts reporting labour shortages showed little change between 2023 Q2 and Q3 and remains slightly higher than normal (see Chart D). Since spring 2022, the share has fallen substantially. The level is appreciably lower in most sectors, but for construction in particular, recruitment difficulties have eased.
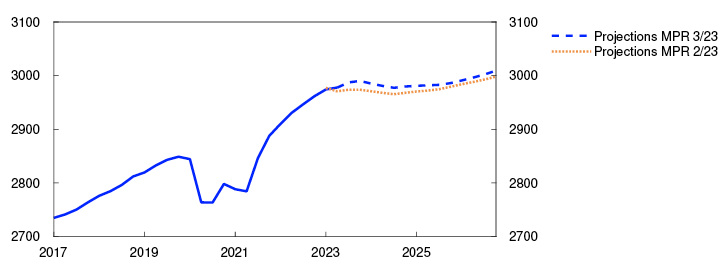
Prospects for higher unemployment
High labour demand indicates a further rise in employment in the period ahead (Chart 3.14). Register-based data indicate that employment rose further in July, and Regional Network contacts expect employment to continue to rise towards the end of the year. Norges Bank’s Expectations Survey indicates that employment growth will eventually slow. Prospects for sluggish growth in the Norwegian economy suggest a slight decline in employment in 2024, with higher activity growth leading to a renewed rise thereafter.
Employed in thousands. Seasonally adjusted
The number of temporary foreign workers has increased slightly, broadly as expected. In 2023 Q2, there were approximately 3 000 more temporary foreign workers than at the same time one year ago, and the number is expected to rise somewhat further in the coming years. The past krone depreciation may, albeit with high uncertainty, dampen the increase in temporary foreign workers.
Owing to the war in Ukraine, the number of Ukrainians in Norway has risen markedly, and the Norwegian authorities estimate that this number will increase further in 2024. It will likely take some time for most of this group to enter the labour market.
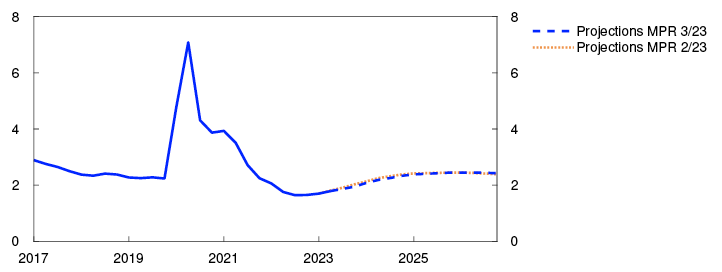
With prospects for weak employment growth in the coming years, unemployment is expected to edge up. Unemployment is projected to rise to approximately 2.4% in the course of the next few years, remaining close to this level to the end of the projection period (Chart 3.15). Unemployment will then be slightly above the levels observed in the years leading up to the pandemic. For 2023 and 2024, unemployment projections have been revised down slightly from the June Report and are little changed thereafter.
Registered unemployed as share of the labour force. Seasonally adjusted. Percent
Capacity utilisation is declining
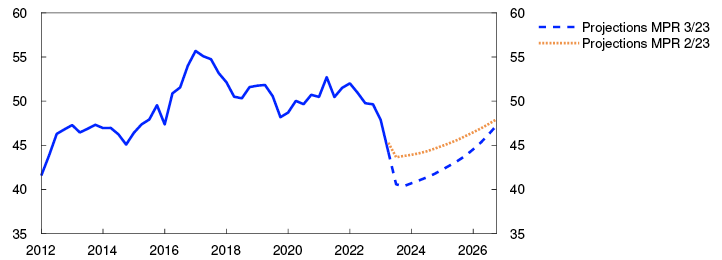
Capacity utilisation is expected to decline ahead, with output falling below potential in the course of 2024. There are prospects that output will remain below potential thereafter, but edge higher in 2026.
The output gap is a measure of the difference between actual output (mainland GDP) and potential mainland output. Potential output is determined by productivity growth and potential employment. Potential employment can be interpreted as the highest level of employment that can be maintained over time without driving up wage growth and inflation. Potential output and the output gap cannot be observed and must therefore be estimated. The Bank’s output gap estimates are based on an overall assessment of various indicators and models. Particular weight is given to labour market developments.
The output gap is assessed to have risen into 2022, with output remaining above potential through the year (Chart 3.C). In this period, unemployment was low, job vacancies were high and a large share of Norges Bank’s Regional Network enterprises reported capacity constraints. At the same time, wage growth accelerated.
Percent
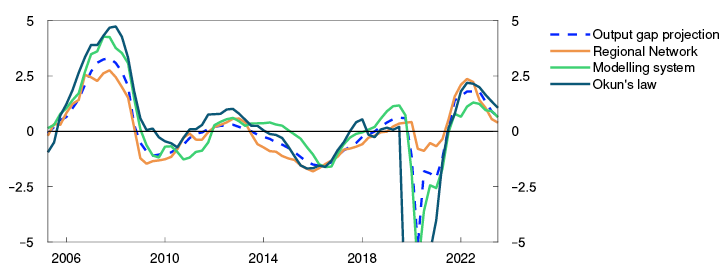
So far in 2023, there are clear signs that overall capacity utilisation in the economy has declined. Growth in the Norwegian economy fell through the first half of the year. In Q3, fewer Regional Network contacts reported capacity constraints. In addition, unemployment has risen slightly, and the number of job vacancies has fallen. At the same time, capacity utilisation is now set to decline less through 2023 than projected in the June Report, on the back of higher-than-projected employment and indications of a further rise in employment in the period to the end of the year, according to both register data and Regional Network contacts. Moreover, the share of Regional Network contacts reporting labour shortages was little changed in Q3. Norges Bank’s modelling system for estimating the output gap, which is based on information about such variables as mainland GDP, unemployment, wage growth and domestic inflation, indicates some decline in capacity utilisation in Q3. In the Bank’s overall assessment, the output gap declines to 0.7% in Q3.
Looking ahead, the output gap is expected to decline further and bottom out at negative 0.9% at the end of 2025, reflecting prospects for a decline in household consumption and lower housing investment. The output gap projections have been revised up slightly for 2023 and 2024 and are little changed thereafter.
In recent years, productivity developments have been weak (Chart 3.D) across most sectors. Owing to weaker-than-expected productivity, the projection for potential output has been revised down a little for 2023 (Table 3.A), while it has been revised up further ahead, reflecting prospects for slightly higher population growth.
Productivity. Quarterly change. Moving average. Percent
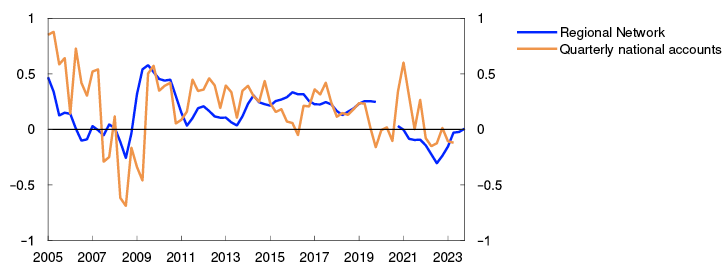
Table 3.A Output and potential output1
|
Change from projections in Monetary Policy Report 2/23 in brackets |
Percentage change from previous year |
|||||
|
1995–2009 |
2010–2022 |
2023 |
2024 |
2025 |
2026 |
|
|
GDP, mainland Norway |
3.1 |
2.0 |
1.3 (0.1) |
0.3 (0.1) |
0.8 (-0.1) |
1.4 (0.0) |
|
Potential output |
3.1 |
1.8 |
2.2 (-0.1) |
1.4 (0.1) |
1.3 (0.0) |
1.4 (0.1) |
|
Potential employment |
0.8 |
1.1 |
1.5 (0.1) |
0.7 (0.2) |
0.7 (0.0) |
0.7 (0.1) |
|
Trend productivity |
2.3 |
0.6 |
0.7 (-0.2) |
0.6 (-0.1) |
0.6 (0.0) |
0.6 (0.0) |
1 The contributions from potential employment and trend productivity do not necessarily sum exactly to the annual change in potential output due to rounding.
1 Period: 2005 Q2 – 2023 Q3. Regional Network is the average of the capacity utilisation indicators in the Regional Network after they have been converted to output gaps using a simple model estimation.
The modelling system for the output gap includes information about GDP, employment, unemployment, wage growth, inflation, house prices and credit. For a more detailed description of the models, see Furlanetto et al (2023) “Norges Bank Output Gap Estimates: Forecasting Properties, Reliability, Cyclical Sensitivity and Hysteresis.” Oxford Bulletin of Economics and Statistics, 85.1, 238–267. Okun’s law is based on estimated deviation from the trend in registered unemployment as a percentage of the labour force.
2 Period: 2005 Q1 – 2023 Q4. Productivity growth in the Regional Network is calculated as enterprises’ reported output growth less employment growth. The observation for 2023 Q4 is based on contacts’ expectations. A three-quarter centered moving average is then calculated. Observations from the Regional Network in 2020 have been removed due to challenges in comparisons with observation from the pandemic (see Regional Network Report 2/2020). Productivity growth in the quarterly national accounts is given as mainland GDP per employed person. A five-quarter centered moving average is then calculated. Employment figures are adjusted for furloughs during the pandemic.
1 Period: 2005 Q1 – 2023 Q2. Trend is based on model estimates for different population groups and are extrapolated based on a population projection from Statistics Norway. See box in MPR 3/21 for details.
2 Period: Statistics Norway: 2010 Q1 – 2023 Q2. NAV: January 2018 – August 2023. As a result of missing data in NAV’s statistics at the start of 2018, only data since January 2018 are shown.
3 Period: 2017 Q1 – 2026 Q4. Projections for employment from 2023 Q2 for MPR 2/23 and from 2023 Q3 for MPR 3/23.
4 Period: 2017 Q1 – 2026 Q4. Projections from 2023 Q2 for MPR 2/23 and from 2023 Q3 for MPR 3/23.
3.3 Prices and wages
Continued high inflation
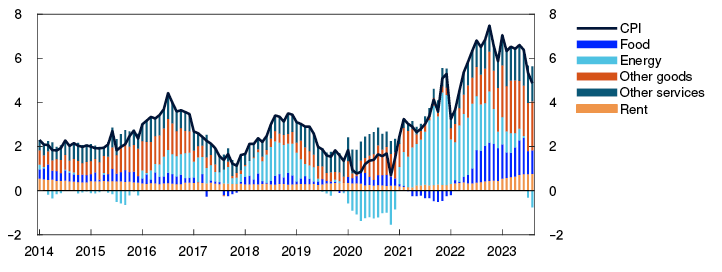
Inflation has declined through summer but remains markedly above the 2% inflation target. In August, the consumer price index (CPI) was 4.8% higher than in the same month one year earlier. This was 1.3 percentage points lower than projected in the June Report, primarily because energy prices have been lower than expected.
In 2021, a pronounced rise in energy prices pushed up inflation (Chart 3.16), and food prices also increased considerably through 2022. Both goods and services inflation have remained elevated in 2023. The marked rise in both energy and commodity prices in 2021 and parts of 2022 has pushed up goods and services prices in the recent period (see "Inflation increasingly driven by wage costs and operating margins"). Rent inflation, which is normally a sticky variable given a high weight in the CPI, has picked up markedly since the beginning of 2023.
CPI. Twelve-month change. Percent. CPI subcomponents. Percentage points
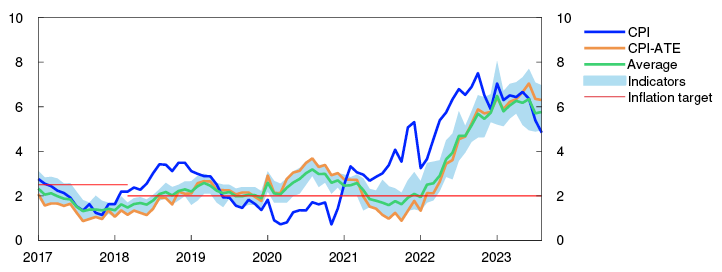
Overall, underlying inflation has moderated since the June Report. The 12-month rise in the CPI adjusted for tax changes and excluding energy products (CPI-ATE) moved down to 6.3% in August (Chart 3.17), approximately as projected in the June Report. Other underlying inflation indicators have also fallen during summer, and the average of the indicators is now lower than CPI-ATE inflation.
CPI and underlying inflation indicators. Twelve-month change. Percent
Easing international inflationary pressures
Imported goods inflation has remained high through summer, reflecting the krone depreciation in the first half of 2023. Imported inflation has been higher than projected in the June Report.
Following a sharp rise in global freight rates in the wake of the pandemic, the cost of transporting goods has now returned to normal levels. Energy and non-energy commodity prices have also fallen, which, together with a slower rise in prices for goods imported from trading partners, dampens price pressures from abroad (Chart 3.18). On the other hand, inflationary pressures on domestic consumer goods prices have remained strong in 2023, partly owing to the krone depreciation through spring. In the coming years, imported inflation is projected to recede and pull down overall inflation. The projections are slightly higher than in the June Report.
International price impulses for imported consumer goods (IPK) with freight rates in NOK and foreign currency terms. Annual change. Percent

Domestic factors keeping inflation elevated
Prices for domestically produced goods and services have risen substantially in recent years (Chart 3.19). This reflects a marked rise in intermediate goods prices and an acceleration in wage growth, while productivity growth has been low. The rise in prices for domestically produced goods and services has slowed in recent months and developments so far in 2023 have been less pronounced than projected in the June Report.
Domestically produced goods and services and imported goods in the CPI-ATE. Four-quarter change. Percent
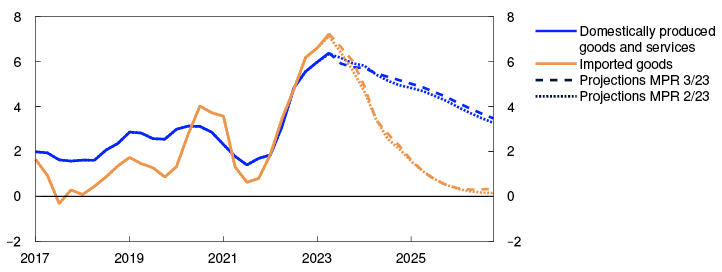
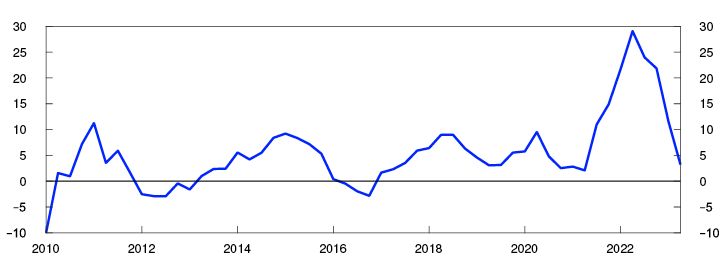
Through 2022, high electricity prices pushed up business costs. Now that electricity prices have fallen, business costs are declining, which will help dampen domestic inflation ahead (see box in Monetary Policy Report 3/2022 on how electricity prices affect firms’ costs and consumer prices). Imported intermediate goods inflation has also moderated markedly from the high levels seen in 2022 (Chart 3.20), which is also likely to help dampen domestic inflation ahead. Prospects for lower capacity utilisation also suggest lower inflation.
Four-quarter change. Percent.
On the other hand, there are signs that inflation has recently been driven to a greater extent by second-round effects in the form of higher labour costs and profit margins (see "Inflation increasingly driven by wage costs and operating margins"). Looking ahead, owing to such second-round effects, inflation is expected to moderate more slowly than implied solely by the easing of the original inflationary pressures. The rise in prices for domestically produced goods and services is projected to moderate to the end of 2023 and into 2024. From mid-2024, the projections for the rise in prices for domestically produced goods and services are slightly higher than in the June Report (Chart 3.19), primarily reflecting slightly higher prospects for wage growth ahead.
The inflation peak is assessed as likely to have passed, and CPI-ATE inflation is expected to move down from 2023 Q3. The projection for CPI-ATE ahead has been revised up slightly owing to the higher projections for domestic inflation.
Energy prices pull inflation down ahead
The energy component of the CPI has fallen by 15% over the past 12 months (Chart 3.21), primarily reflecting the decline in electricity prices (see "Oil prices have risen").
Energy index. Twelve-month change. Percent. Contribution to the energy index. Percentage points
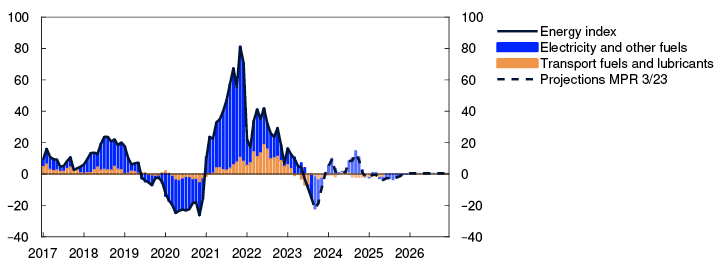
Consumer energy price projections assume futures prices for energy and petroleum products. Weight is also given to other factors such as taxes and electricity distribution charges. Since the June Report, futures prices for the remainder of 2023 have declined overall, so that energy prices pull down inflation more in the near term than anticipated then. Energy prices are also expected to help dampen inflation further ahead, albeit less than assumed in June.
Higher wage growth
Wage growth has picked up in recent years on the back of high inflation, a tight labour market and solid profitability in some business sectors. In 2022, wages increased by 4.3%.
Annual wage growth is projected to increase further to 5.5% in 2023, somewhat above the wage norm set for manufacturing and unchanged from the June Report. Wage statistics for 2023 Q2 indicate that wages have risen broadly as envisaged in June. The social partners have revised up their expectations somewhat and now expect wage growth of 5.6% in 2023 (Chart 3.22). Regional Network contacts still expect wages in their own enterprises to increase by 5.4% in 2023.
Annual wage growth. Percent
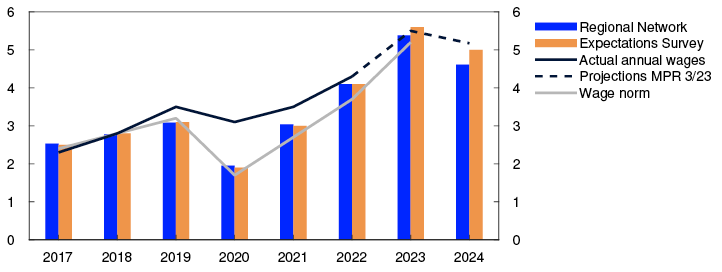
In the projection, prospects for lower inflation and capacity utilisation gradually dampen wage growth in the years ahead. In 2024, annual wage growth is 5.2%, which is higher than in the June Report and reflects the fact that both inflation and capacity utilisation are set to be higher than projected earlier. Higher oil prices and prospects for increased activity in petroleum-related industries also suggest higher wage growth than previously assumed, partly owing to improved profitability in some manufacturing segments. The upward revision is also in line with the social partners’ wage growth expectations for 2024, which now comes to 5.0% overall. Wage projections for the coming years have also been revised up slightly since the June Report.
According to the Expectations Survey, the social partners expect a slight rise in real wages in 2023. In the projection, real wages decline by 0.3% in 2023 (Chart 3.23), reflecting prospects for a further increase in inflation since the wage settlement in spring. In the period between 2024 and 2026, real wages increase by an annual average of just above 1%, in line with projected productivity growth and improvements in Norway’s terms of trade.
Annual change. Percent
Uncertainty is greater when inflation is high
There is considerable uncertainty related to price and wage inflation ahead. A model-based exercise suggests that inflation uncertainty is higher than normal in both the near and medium term (see "Indicators of uncertainty in the near and medium term"). The factors that have contributed to the marked rise in inflation in recent years are expected to push down inflation ahead. At the same time, there are other factors that will contribute to keeping inflation elevated (see "Inflation increasingly driven by wage costs and operating margins"). This makes it difficult to estimate the time horizon for bringing down inflation.
There is also considerable uncertainty regarding future productivity growth, which is projected to rise gradually throughout the projection period. If productivity growth turns out to be weaker than projected, inflation may moderate more slowly than currently envisaged.
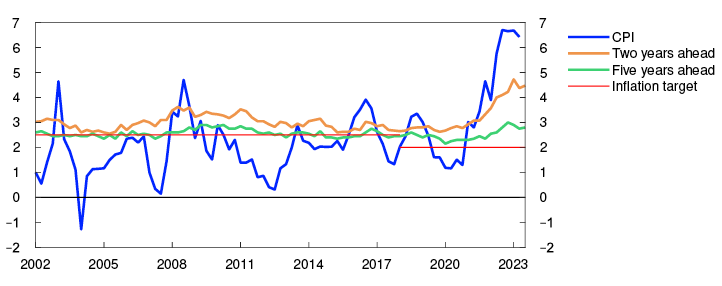
According to Norges Bank’s Expectations Survey, inflation expectations increased slightly in Q3. Expectations are above the 2% inflation target, both two and five years ahead (Chart 3.24). If inflation expectations remain high, inflationary pressures could take longer to recede than currently envisaged.
Inflation expectations ahead. Percent
Indicators of uncertainty in the near and medium term
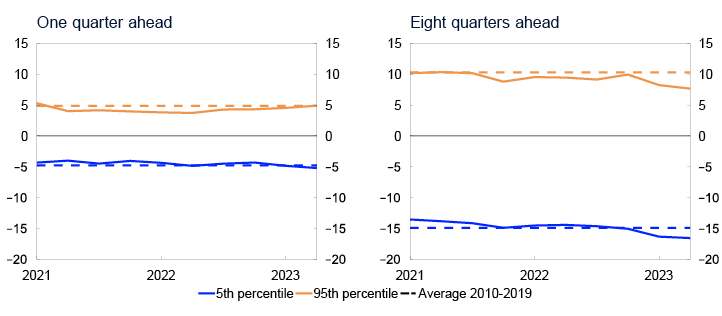
Expectations and projections of future economic developments will always be subject to considerable uncertainty. The level of uncertainty will vary over time. Assessments of uncertainty are essential for making economic decisions and economic policy, including monetary policy. As an aid in understanding macroeconomic uncertainty, Norges Bank uses a model framework to quantify the uncertainty surrounding developments in three key macroeconomic variables: output growth, house price inflation and consumer price inflation. The models help shed light on uncertainty around a set of point estimates but do not give us any information about the most probable developments ahead. The simple model framework provides an indicator of risk developments over time but will not be able to provide a complete description of uncertainty. Our overall assessments of risk ahead will always be a combination of judgement and model estimates.
The models use quantile regressions with several indicators to forecast the distribution of these variables further out in time. Uncertainty can both vary over time and be asymmetrical. A formal evaluation of the framework indicates that it has good empirical properties.1 In this box, we use the difference between the median and the 95th and 5th percentiles, respectively, in the model framework’s estimated distribution ahead as a measure of upside and downside risk. The charts below show developments over time in upside and downside risk for the different variables. They illustrate both changes in the size of the estimated sample space and whether there is significant upside or downside asymmetry.
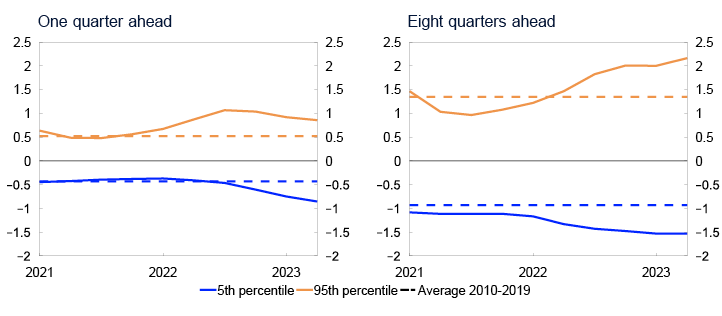
According to the models, inflation uncertainty has risen considerably in recent years. The left panel in Chart 3.E shows that near-term uncertainty is high compared with the historical average. The models indicated that at the end of 2021, uncertainty was skewed towards higher inflation. The skewness peaked in 2022. It has been falling since the end of the year, and risks are now more balanced, which is particularly attributable to a slower rise in prices for a number of imported intermediate goods. Medium-term uncertainty is also historically high and has continued to rise in the recent period (right panel in Chart 3.E). At this horizon, the upside risk is rising more than the downside risk, resulting in a more asymmetrical balance of risks, which is largely being driven by the recent high inflation. In the models, previous price developments will affect expected future inflation uncertainty. High inflation today therefore entails a risk of higher inflation ahead.
Spread between percentiles and median from quantile regressions. Four-quarter change in CPI-ATE. Percentage points
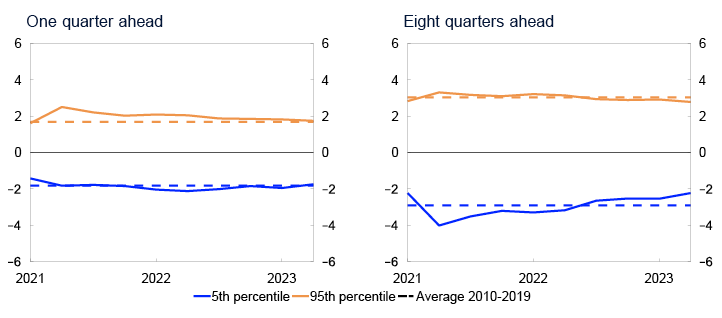
For output growth, the model indicates that the uncertainty surrounding near-term developments is at normal levels with little asymmetry (left panel in Chart 3.F). Medium-term uncertainty is a little lower than the historical average, with some upside bias (right panel in Chart 3.F). This means there is a slightly higher probability of significantly higher growth than of significantly lower growth. Weaker household credit growth in particular contributes to lower overall medium-term uncertainty for output growth. This may be because a historically rapid build-up of credit has increased the likelihood of a financial crisis, for example as prior to the banking crisis in the 1980s and the financial crisis in 2008. Low credit growth may therefore reduce the downside risk to output growth.
Spread between percentiles and median from quantile regressions. Four-quarter change in mainland GDP. Percentage points
The models indicate that uncertainty surrounding house price inflation ahead is close to its historical average in the near term (left panel in Chart 3.G). In the medium term, there is a bias to the downside (right panel in Chart 3.G). At this horizon, the upside risk has fallen and the downside risk has increased over the past year. These developments in the model can be largely explained by the fall in real household disposable income and weaker growth in household credit.
Spread between percentiles and median from quantile regressions. Four-quarter change in house prices. Percentage points
1 Bowe, F., S.J. Kirkeby, I.H. Lindalen, K.A. Matsen, S.S. Meyer and Ø. Robstad (2023). “Quantifying macroeconomic uncertainty in Norway”. Staff Memo 13/2023. Norges Bank.
2 Period: 2021 Q1 - 2023 Q2. The charts show developments in the difference between the 5th and 95th percentiles from the median for the model-estimated distribution of consumer price inflation one and eight quarters ahead, respectively. Broken lines indicates average 5th and 95th percentiles between 2010 and 2019.
3 Period: 2021 Q1 - 2023 Q2. The charts show developments in the difference between the 5th and 95th percentiles from the median for the model-estimated distribution of GDP growth one and eight quarters ahead, respectively. Broken lines indicate average 5th and 95th percentiles in the period between 2010 and 2019.
4 Period: 2021 Q1 - 2023 Q2. The charts show developments in the difference between the 5th and 95th percentiles from the median for the model-estimated distribution of house price growth one and eight quarters ahead, respectively. Broken lines indicate average 5th and 95th percentiles between 2010 and 2019.
1 Period: January 2014 – August 2023. In the statistics, some differences occur between the sum of the components and overall inflation.
2 Period: January 2017 – August 2023. CPI-ATE: CPI adjusted for tax changes and excluding energy products. Average: Average value of 12-month change for other underlying inflation indicators (CPIM, CPIXE, 20 percent trimmed mean, weighted median, CPIXV and CPI-sticky prices and CPIF) and CPI-ATE. Indicators: Highest and lowest 12-month change for other underlying inflation indicators.
3 Period: 2022 – 2026. Prices for imported consumer goods. Projections from 2023.
4 Period: 2017 Q1 – 2026 Q4. CPI-ATE: CPI adjusted for tax changes and excluding energy products. Projections from 2023 Q2 for MPR 2/23 and from 2023 Q3 for MPR 3/23.
5 Period: 2010 Q1 - 2023 Q2. Price index for imported intermediate goods, from Statistics Norway’s Foreign trade with goods.
6 Period: January 2017 – December 2026. Projections from August 2023. The energy index is a weighted series for key energy products in the CPI. The contribution shows the approximate contribution from “electricity and other fuels” and “transport fuels and lubricants”, respectively.
7 Period: 2017 – 2024. Annual wages: Actual annual wages from Statistics Norway. Norges Bank’s projections for 2023 and 2024. Norges Bank’s Expectations Survey: Social partners’ wage growth expectations for the current year as measured by Norges Bank’s Expectations Survey in Q3 each year. Regional Network: Expected wage growth for own business in current year as reported in Q3 each year. For 2024: Corresponding wage growth expectations for next year (Q3 2024).
8 Period: 2017 – 2026. Projections from 2023 for MPR 2/23 and MPR 3/23. Real wages: Nominal annual wage growth adjusted for CPI inflation.
9 Period: 2002 Q1 – 2023 Q3. Inflation expectations two years ahead are the average of expectations among households, business leaders, economists and social partners. Inflation expectations five years ahead are the average of expectations among economists and social partners.
Card data help us prepare forecasts of household consumption
Since the coronavirus pandemic, Norges Bank has received aggregated card transaction data covering a large share of Norwegian households. Card data provide useful information on real-time developments in consumption as measured in the national accounts and help the Bank forecast consumption in the national accounts.
Household consumption accounts for around 50% of mainland GDP. A solid understanding of household economic behaviour is important for monetary policy decision-making. The national accounts and other official statistics are the main sources of information on household behaviour, but they are published with a lag and only provide information about overall developments over a month. During the coronavirus pandemic, Norges Bank began to receive daily card transaction data, which was very useful for understanding real-time developments in household consumption in a period of substantial volatility in consumer spending.1 In recent years, the Bank has worked to obtain card data from more agents in order to capture a larger share of household consumption and better understand household behaviour.
Norges Bank now receives current transaction data from BankID BankAxept, TietoEvry and Nets Branch Norway at daily frequency broken down by consumption category. The data are aggregated to a national level and do not contain sensitive personal information. In all, the transaction data received covers over 90%2 of all debit and credit card transactions. This means that the Bank receives accurate current information about Norwegians’ card use in Norway but not foreign nationals’ purchases in Norway.
Card transactions cover a large share of current Norwegian household consumption. At the same time, there are a number of consumption categories where it is more common to be billed rather than pay with a bank card, such as motor vehicle purchases and electricity. A comparison of card transactions for goods purchases with the amounts for goods consumption in the national accounts excluding electricity and motor vehicles shows that these two data sets track one another closely (left panel in Chart 3.H).
Segments of goods and services consumption in the national accounts and card transaction data. Value in billions of NOK. Unadjusted
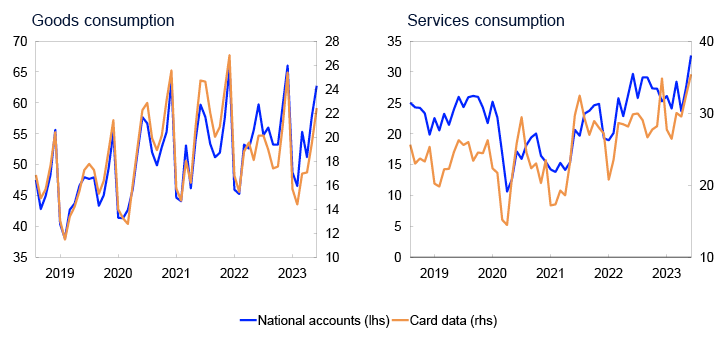
The covariance between developments in card data and the national accounts is weaker for services consumption4 than for goods consumption5 (right panel in Chart 3.H), which may reflect in part the inclusion in the national accounts of foreign nationals’ purchases in Norway.
When preparing forecasts of household consumption, we forecast the underlying activity in the Norwegian economy, corrected for seasonal variations and price movements. If we adjust for seasonal variation6, we see that the covariance and the data’s forecasting properties are weaker.
In order to use card data to forecast developments in consumption, we have therefore developed a number of simple models. The models are based on the historical covariance between card data and the national accounts and are used to provide direct estimates of consumption for periods when card data are available but when the national accounts have not been published. The models are estimated in pseudo real-time, that is, they only use information available when the forecast was made but are estimated based on the most recent available publication of the national accounts. A challenge posed by card data is their very short history.
Table 3.B shows the relative forecast error of a simple model including card data and a simple model excluding card data. The model containing card data is better at forecasting seasonally adjusted services consumption than a simple model. Nevertheless, there is less of an improvement in the forecasting properties of the model containing card data for services consumption than for the components of goods consumption. Card data are particularly useful for forecasting grocery purchases in the national accounts, compared with a simple model excluding card data.
Table 3.B RMSE1 for unadjusted versus seasonally adjusted volume of goods and services consumption
Percent. January 2020 – June 2023
|
Simple model excluding card data |
Model including card data |
Forecast improvement2 |
|
|
Consumption t+1 |
Consumption t+1 |
Consumption t+1 |
|
|
Seasonally adjusted volume |
|
|
|
|
Services |
0.13 |
0.08 |
38% |
|
Goods |
|
|
|
|
Groceries |
0.06 |
0.03 |
50% |
|
Other goods |
0.04 |
0.03 |
12% |
1 Root mean square error (RMSE) is a measure of average forecast errors over time. Values close to zero indicate accurate forecasts.
2 Percentage improvement in RMSE.
Card data are good at providing information on consumption developments in real time, especially in periods of high volatility in consumer spending, such as during the pandemic. In periods when consumption is more stable, card data have proved to be particularly useful in forecasting developments for some types of goods consumption, such as groceries, but challenges related to seasonal adjustment remain.
In addition to their forecasting properties, the data are very useful for understanding household behaviour over time. Card data contain more detailed information on online shopping and household purchases of consumer goods.
In the period ahead, we will continue to develop services consumption models using card data and improve the forecasts of the seasonally adjusted volume of goods consumption. We will also use card data to be able to quickly gauge sudden swings in household consumption, changes in consumption composition and household behaviour over time.
1 Fastbø, T. and K.N. Torstensen (2020). “Kortbruk gir rask informasjon om husholdningenes forbruk” [Card use provides timely information about household consumption]. Bankplassen blogg 26 August 2020. Norges Bank (in Norwegian only).
2 Norges Bank (2023). “Retail payment services 2022”. Norges Bank Papers 1/2023.
3 Period: August 2018 - June 2023. Services consumption includes hotel and restaurant services, recreational services, passenger transport and motor vehicle repair in the national accounts. Goods consumption includes groceries and other goods in the national accounts.
4 Services consumption includes only hotel and restaurant services, recreational services, passenger transport and motor vehicle repair.
5 Goods consumption excluding cars and electricity.
6 Card transaction data are seasonally adjusted using X-12-ARIMA.
Inflation increasingly driven by wage costs and operating margins
While the high rate of inflation through 2022 primarily reflected the rise in electricity and import prices, there are now signs that wages and operating margins are increasingly driving up inflation. This can be partly attributed to the effects of workers and producers seeking compensation for the decline I real wages and real returns that in isolation follows from higher consumer prices.
Inflation over the past few years has largely been driven by a series of sharp, albeit likely transitory, inflation shocks. The coronavirus pandemic led to a pronounced shift from spending on services to goods, both in Norway and internationally, which engendered global supply bottlenecks, soaring freight rates and a steep rise in imported goods prices. The war in Ukraine propelled gas prices to record-high levels and resulted in a surge in electricity prices in many countries, including Norway. Both factors have contributed both directly and indirectly to driving up consumer price inflation. Combined, these effects can be referred to as first-round effects. High inflation can on its own lead to an increase in wage growth and operating margins, generating an additional inflation impulse. This can be referred to as the second-round effects of the initial price shocks.
The direct effects, including increases in electricity prices (facing households),and prices for imported consumer goods, are relatively quickly reflected in the CPI, while the indirect first-round effects, which are largely transmitted through commodities and imported intermediate goods via domestic productions stages with further processing for final delivery of domestically produced goods and services, are reflected in the CPI with a lag. This also means that it will take time before a reversal of the initial inflationary impulses is fully reflected in the inflation data. In Chart 3.I, we have attempted to illustrate how an increase in prices on electricity and imported intermediate goods move down the production chain through, among other things, prices for domestically produced intermediate goods and then on to producer prices in services and retail trade. Producer prices in these industries comove relatively closely with the rise in prices for comparable goods and services components in the consumer prices index.1
Percent
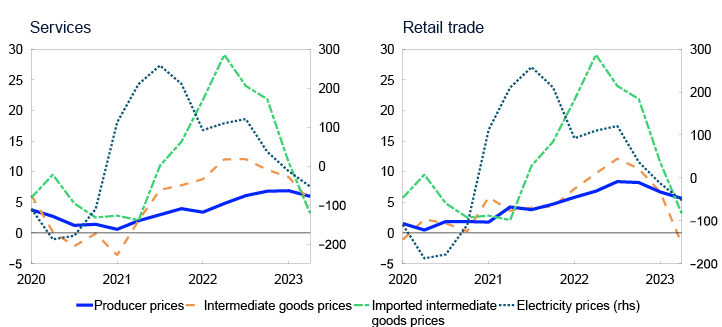
The two following factors are particularly worth noting. First, the chart shows that electricity prices have shown the steepest rise, while the rise has been somewhat more subdued for the more processed products further down the production chain. This is because a higher processing degree, as the term implies, requires among other things a higher labour input, and the price of labour, ie wages, has increased moderately compared with prices for different kinds of intermediate goods further up the chain. Second, the chart indicates that it takes time before higher electricity and import prices find their way to the prices for domestically produced goods and services.
Many of the factors that have driven up inflation have now fully or partly reversed. Both electricity prices and freight rates are lower than one year ago – even though electricity futures prices are still at relatively high levels. Further down the production chain, a more subdued rise in prices for other intermediate goods and services is in isolation helping drive down domestic inflation. Producer prices in different industries are not, however, driven exclusively by intermediate goods prices. So what are the factors driving inflation at this juncture?
To shed light on this question, we decompose the rise in producer prices in consumer-oriented industries, private services and retail trade, based on monthly national accounts data. Producer prices are implicitly defined as the unit output value in the respective sector aggregates. Since output value is equal to the sum of labour costs, gross operating profit3 and intermediate consumption, it follows that changes in producer prices can be expressed as a weighted sum of changes in unit labour costs (ULC) and operating margin defined as gross operating profit unit of output on the one hand, and intermediate good prices (per unit of output) on the other.4 Changes in operating margins reflect among other things capital costs and price margins.
The monthly national accounts data do not permit a further division of the gross product into labour costs and operating profit. We therefore content ourselves here with suggesting the overall contribution. The decomposition is shown in Chart 3.J. The data indicate that the rise in producer prices, and hence likely consumer prices as well, in both private services and retail trade through 2022, is primarily attributable to a rise in intermediate good prices. It is natural to suppose that this originates in higher electricity and import prices through much of 2022, as Statistics Norway researchers have also concluded.5 Intermediate good prices do indeed also contain a not insignificant labour and capital cost component, but earlier analyses of annual data6 indicate that compensation linked to labour and capital made a minor contribution to driving up the average rise in intermediate goods prices in services and retail trade through 2022. In 2023, however, the rise in producer prices, both in services and retail trade, increasingly comoves with the rise in ULC and operating margins. The future path of inflation will depend among other things on the degree to which workers and capital owners are compensated for inflation, and the extent to which a reversal of the first-round effects dominates the second-round effects.
Growth contribution. Percentage points
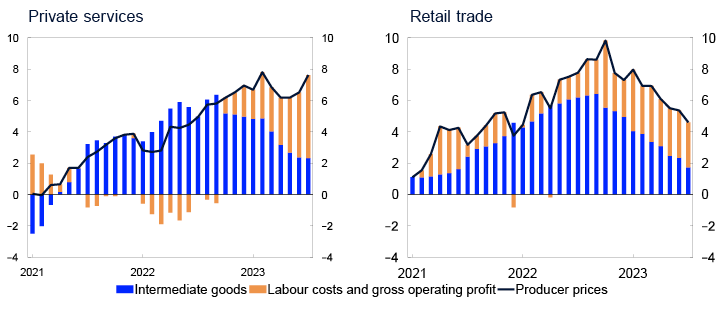
In order to distinguish between the contributions from labour costs and operating margins, we can use quarterly national accounts data, where the gross product of the different sectors is broken down into labour costs and gross operating profit. Chart 3.K shows a decomposition of producer price inflation in services and retail trade where we also isolate the contribution from productivity growth. We see that the inflation impulses from both hourly labour costs and operating margins increased relative to intermediate good costs from mid-2022. In services, there appears to be an increase in the contribution from hourly labour costs this year, while the contributions from both labour costs and operating margins to producer price inflation in retail have remained relatively steady over the past three quarters.
The reversal of the inflation impulses from higher electricity and import prices is now overall driving down inflation, even though the exchange rate contribution is driving up inflation in isolation. Chart 3.K suggests a kind of normalisation of the inflationary process so far in 2023, after higher electricity prices and import prices had been the main drivers of inflation through 2022. Inflation reflects developments in wage costs and operating margins. The unwinding of the initial inflationary shocks and prospects for a gradual softening of wage growth a little further out will in isolation push inflation down closer to the target over time.
Growth contribution. Percentage points
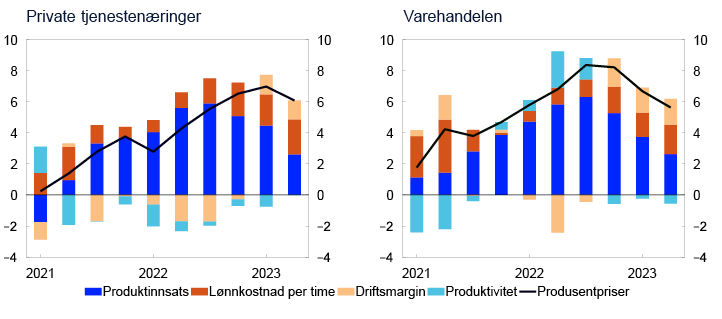
1 This is not that surprising as consumer prices are also part of producer prices in the said industries.
2 Period: 2020 Q1 - 2023 Q2.
3 Operating profit including capital depreciation and net industry taxes.
4 It should be noted that this a purely mechanical, accounts-based presentation that assigns current changes in producer prices to contemporaneous changes in intermediate goods prices, ULC and operating margin. National accounts data are subject to uncertainty and future revisions could changes the conclusions. The decomposition does not necessarily reflect causal relationships. For example, producer prices today may be exclusively determined by factor costs in previous periods and be fully independent of costs accruing in the current period. Nevertheless, by following developments over time, we are likely to obtain an overall impression of the relative contributions.
5 See, eg, article in DN 23 February 2023 (in Norwegian only).
6 See box “Limited impact from higher profit margins to inflation”, Monetary Policy Report 2/2023.
7 Period: January 2021 - July 2023. The estimations are discussed in detail in the text.
8 Period: 2021 Q1 - 2023 Q2. The estimations are discussed in detail in the text.
4. Monetary policy analysis
On balance, Norges Bank’s analyses indicate a higher policy rate path than in the June 2023 Monetary Policy Report. According to Norges Bank’s model analysis, the path is pushed up primarily by higher capacity utilisation, higher wage growth, higher international interest rates and higher petroleum prices and petroleum investment than projected in the June Report.
4.1 The policy rate forecast and monetary policy objectives
The operational target of monetary policy is annual consumer price inflation of close to 2% over time. Inflation targeting shall be forward-looking and flexible so that it can contribute to high and stable output and employment and to countering the build-up of financial imbalances. The Committee’s monetary policy strategy is discussed further in "Norges Bank’s monetary policy strategy".
The policy rate forecast has been revised up from the June Report. The policy rate was raised by 0.25 percentage point to 4.25% at the meeting of the Monetary Policy and Financial Stability Committee on 20 September, and the forecast indicates that it will most likely rise to 4.5% in December. The policy rate is projected to be slightly above 3% around the end of the projection period.
Projections are always subject to uncertainty, but the uncertainty surrounding the inflation projections are especially high now that inflation is high, and the Bank’s forecasts have been revised substantially over the past year. Simple model estimates of the uncertainty surrounding the further evolution of some key indicators are described further in "Indicators of uncertainty in the near and medium term". If the economic outlook, the balance of risks or the assessment of the functioning of the economy changes, the policy rate may prove to be different from the one now indicated by the policy rate path.
4.2 New information and new assessments
New information suggests a higher policy rate path
To shed light on how new information affects the economic outlook, new information and assessments of the economic situation are incorporated into the modelling system, while conditioning on the policy rate path from the June Report. This exercise shows the forecasts that the modelling system would have produced if the policy rate path were unchanged. Here the main focus is on the outlook for developments in the output gap and inflation, two important considerations to which the Committee gives weight in the conduct of monetary policy.
In the exercise with an unchanged rate path, both the inflation and capacity utilisation projections are higher than the projections in the June Report throughout the forecast period (Chart 4.1). The output gap is pulled up primarily by a less pronounced fall in consumption and higher petroleum investment than projected. Pulling down somewhat is lower housing investment. CPI-ATE inflation has moved broadly in line with the projections, but there are prospects for higher inflation ahead owing to higher imported inflation and higher capacity utilisation. Further out in the projection period, higher wage growth also pulls up inflation.
Projections conditioned on new information concerning economic developments and the policy rate forecast in MPR 2/23
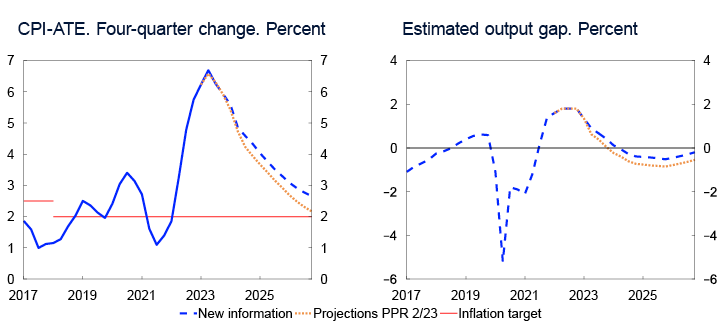
Market policy rate expectations have risen
Market policy rate expectations further out can provide an indication of how market participants have interpreted new information and how they believe Norges Bank will react.
Market expectations have edged up since the monetary policy meeting in June and now indicate a peak of just above 4.3% (Chart 4.2). Policy rate expectations are now higher than the policy rate path in the June Report at the beginning of the projection period and towards the end but are otherwise broadly in line with the policy rate path in the June Report.
Policy rate. Percent
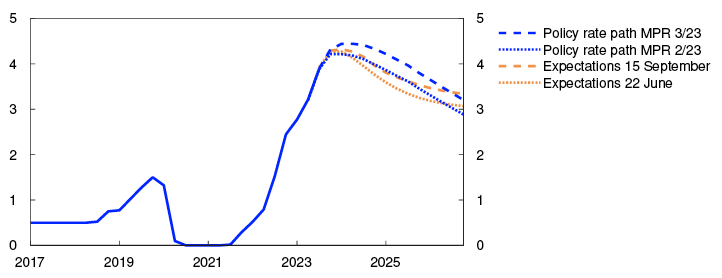
A simple rule indicates a higher policy rate
A simple policy rate rule shows the monetary policy reaction to changes in the output gap and inflation (see Monetary Policy Report 2/2022). The estimated rule is based on data for the period 2009–2021. The near-term inflation and output gap projections have been revised up. This implies that the simple rule indicates a higher policy rate in the coming quarters than in the June Report (Chart 4.3). The simple rule indicates a somewhat larger upward revision than the actual upward revision of the policy rate path in this Report.
Money market rate. Percent
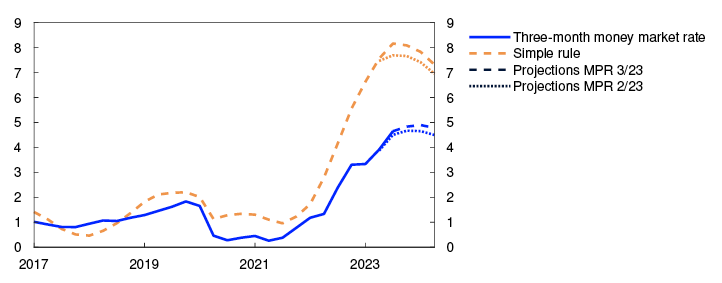
Over the past year, an abnormally large gap has emerged between the simple rule and the actual money market rate. Even though the simple rule is based on Norges Bank’s previous policy rate setting, there may be good reasons to deviate from the simple rule in the current situation. One of the reasons monetary policy is mandated to be flexible and forward-looking is that the policy rate operates with a lag. The simple rule, on the other hand, is relatively myopic and largely uses forecasts from the same quarter to set the policy rate. In the current situation, where inflation moves down considerably through the forecast period, the gap between the myopic simple rule and the forward-looking implementation will be wider than normal.
1 Period: 2017 Q1 – 2026 Q4. Projections from 2023 Q2 for MPR 2/23 and 2023 Q3 for MPR 3/23.
CPI-ATE: CPI adjusted for tax changes and excluding energy products.
The output gap measures the difference in percentage terms between GDP for mainland Norway and projected potential GDP for mainland Norway.
2 Period: 2017 Q1 – 2026 Q4. Expectations from 22 June for MPR 2/23. Expectations from 15 September for MPR 3/23.
3 Period: 2017 Q1 – 2024 Q2. Projections from 2023 Q2 for MPR 2/23 and 2023 Q3 for MPR 3/23.
4.3 Monetary policy stance and drivers behind the changes in the policy rate path
Monetary policy influences the economy through both nominal and real interest rates. The average residential mortgage rate has risen broadly in pace with the policy rate, which reduces household disposable income and leads to a reduction in consumption by many households. Higher nominal interest rates will therefore have a tightening effect on the economy. See "Both nominal and real interest rates influence consumption" for a further discussion of the effect of different interest rates on household consumption.
Compared with the June Report, the policy rate forecast has been revised up more than the inflation projections. This means that the projection for the expected real interest rate has been revised up for the entire projection period (Chart 4.4). The neutral real interest rate is an uncertain variable but is estimated to lie in the upper part of the range between -0.5% and 0.5% (see Monetary Policy Report 2/2023 for a further description). The real interest rate is projected to lie above its neutral level from the next quarter. This means that monetary policy, as measured by the real interest rate, will have a tightening effect on the economy through the remainder of the projection period.
Estimate of the expected real money market rate. Percent
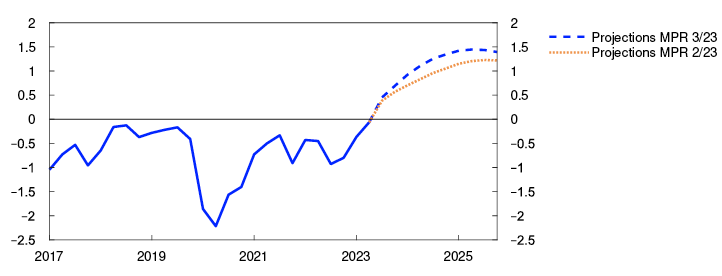
The model-based analysis suggests a higher policy rate path
The Committee’s reasoning for the policy rate decision and forward guidance on the policy rate are presented on Norges Bank’s website. In the decomposition in Chart 4.5, we use our main model NEMO to break down the main drivers behind the change in the policy rate path since the previous Report. The bars show contributions to changes in the model-based path, and the broken line shows the sum of the bars. The solid line shows the actual change in the rate path.
Cumulative contributions. Percentage points

Forward rates indicate that international policy rates will be somewhat higher throughout the projection period than previously assumed, which contributes in isolation to a slightly weaker krone. Economic growth among Norway’s trading partners is set to be somewhat weaker ahead than previously projected, which in isolation will lead to lower exports of Norwegian goods and services. Overall, external factors suggest a somewhat higher model-based path (grey bars).
Since the June Report, oil spot prices have risen sharply. Oil and gas futures prices overall are also higher further out in the projection period. This will boost activity on the Norwegian shelf. Statistics Norway’s investment intentions survey also indicates higher petroleum investment in 2023 and 2024 than projected earlier, and the projections for petroleum investment in the coming years have therefore been revised up. Petroleum prices and petroleum investment pull up the model-based path (red bars).
The krone has been stronger than projected in the June Report and stronger than implied by the changes in the interest rate differential against other countries and oil and gas prices. A stronger krone pulls down on imported goods inflation but also curbs activity somewhat through lower exports. On balance, exchange rate factors pull down the model-based path somewhat (dark blue bars).
Capacity utilisation is higher than envisaged in June, owing in part to higher-than-projected employment and consumption. At the same time, higher capacity utilisation contributes to higher price and wage inflation than projected earlier and suggests a higher model-based path. House price developments have been weaker than assumed in the June Report, and house price inflation ahead has been revised down, partly reflecting an increase in the stock of unsold homes. Housing investment has also fallen more than expected in June. Housing factors suggest in isolation a slightly lower model-based path. Overall domestic demand contributes to a slightly higher model-based path in the coming years (orange bars).
Core inflation has moved broadly in line with the June projections. The projections for imported inflation have been revised up somewhat, despite the stronger krone. This pulls up the model-based path a little. The wage projections have been revised up further out in the projection period, and somewhat more than implied by developments in capacity utilisation and oil prices alone would suggest. This pulls up a little on the model-based path. Pulling down a little on the model-based path are lower electricity prices than projected in the June Report. Price and wage factors on the whole suggest a slightly higher model-based path (light blue bars).
The model analysis implies a higher policy rate than projected in the June Report throughout the projection period. The policy rate path has been revised up less than the model-based path in the first half of the projection period, but somewhat more towards the end.
4 Period: 2017 Q1 – 2025 Q4. The expected real interest rate is the projected money market rate over the next four quarters less expected CPI-ATE inflation over the same period. For Q2 and in the projection period, the expected real interest rate is estimated based on the projections in this Report.
For all previous periods, the expected real interest is based on the most up-to-date Monetary Policy Report at the time in question.
5 Period: 2023 Q4 – 2026 Q4. Projections. The contributions are based on model estimates from the NEMO model, but there is no mechanistic link between news and changes in the bars. The effects of news feed through with a lag and the interaction between economic variables may result in a reversal of the effects over time. In addition, projections for the near term may entail news with different signs at different times. The effect on the rate path is therefore shown most clearly by the cumulative contributions.
Both nominal and real interest rates influence consumption
Households face a number of different interest rates when making decisions, and both the nominal and real interest rate have an effect on consumption. The effect of different interest rates on consumption is also important for how interest rates affect in the economy as a whole.
The interest rate influences household consumption through a number of channels. This box will discuss the cash flow channel and the substitution channel, but other channels (including the wealth channel and collateral channel) may also have a bearing. The cash flow channel operates through the effect of higher nominal interest rates on household disposable income. For households with net interest-bearing debt, a higher interest rate will reduce income available for consumption and saving, and the cash flow effect on consumption is therefore negative. For households with more bank deposits than debt, the cash flow channel will have the opposite effect. As Chart 4.A shows, the nominal residential mortgage rate has risen substantially since 2021. The deposit rate has also risen, but by less that the mortgage rate. Together with the fact that the average Norwegian household holds more interest-bearing debt than deposits, this means that higher nominal interest rates have a contractionary effect. The strength of the cash flow channel to consumption depends on the household debt burden, but also households’ ability to lower principal payments, increase borrowing or draw on savings. Factors such as taxation and credit conditions will also be of importance.
Nominal interest rates
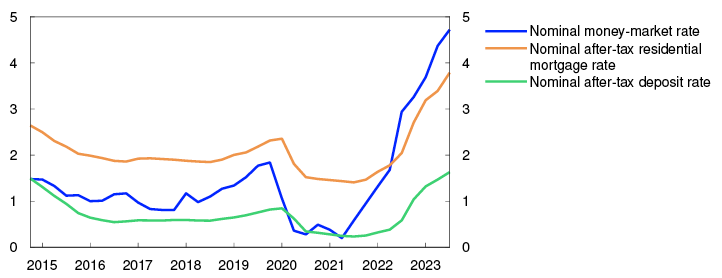
For a family with NOK 1m in mortgage loans, a 4 percentage point increase in the residential mortgage rate will mean around NOK 40 000 in higher annual interest expenses. Nevertheless, disposable income does not fall pari passu with the increase in interest expenses. First, as interest expenses are tax-deductible, the after-tax cost is reduced by the tax rate on ordinary income, which is 22%. Furthermore, the vast majority of Norwegian households’ residential mortgage loans are self-amortising. The principal portion of a self-amortising loan will be adjusted so that higher interest expenses are offset to some degree by lower principal payments in the short term (lower saving). The increase in current mortgage payments will thus be lower than implied by the higher interest rate. This is one reason why debt service ratios have risen less than interest burdens in recent years (Chart 3.7).
The substitution channel describes the effect of the real interest rate on households’ decisions to consume today or save for consumption later. If the nominal interest rate rises by 1 percentage point, while expected inflation rises by 2 percentage points, the expected real interest rate falls. Savings generate a return in nominal terms, but that nominal return will buy fewer goods and services than before. This makes it more attractive to consume today rather than save for tomorrow. However, a greater increase in the nominal interest rate than in inflation expectations results in a higher expected real interest rate, which will incentivise saving more and consuming less today. Between 2019 and 2021, the real money market rate, measured as three-month Nibor less Norges Bank’s projection for inflation one-year ahead, fell from around negative 0.5% in 2019 to around negative 1.25% in 2021 (Chart 4.B), a decline that was driven by lower policy rates. In general, this had an expansionary effect, but at the same time, the pandemic limited household consumption opportunities. Real interest rates have since increased, and real money market rates are now positive and are expected to rise further ahead. The chart also shows developments in the real after-tax residential mortgage rate. The residential mortgage rate is the most important interest rate facing Norwegian households, and since interest expenses are tax-deductible, the real cost of borrowing is the inflation-adjusted after-tax interest rate. The real after-tax mortgage rate has risen in pace with nominal rates but is still negative. In the forecast, the real after-tax mortgage rate for households rises to around 1.4% at the end of 2025. The real after-tax deposit rate has also risen but remains at a low level. The residential mortgage and deposit rates used in the chart are an average, and different households will face higher or lower rates.
Nominal interest rates less expected inflation
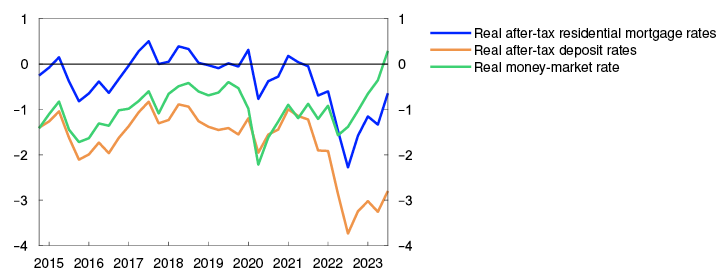
In this box we have described how both nominal and real interest rates can influence consumption. It is difficult to estimate precisely the strength of the different interest rate channels, since these channels work simultaneously. On balance, it is assumed that the current interest rate level is having a contractionary effect on the economy.
1 Period: 2014 Q4 - 2023 Q3. Residential mortgage rates and deposit rates are average rates for households. The money market rate is three-month NIBOR.
2 Period: 2014 Q4 - 2023 Q3. Residential mortgage rates and deposit rates are average rates for households. The money market rate is three-month NIBOR. All rates are deflated by Norges Bank’s projection for four-quarter CPI-ATE inflation at the applicable time
Annex
Detailed tables of projections
TABLE 1 International projections
|
Change from projections in Monetary Policy Report 2/23 in brackets |
Weights1 Percent |
Percentage change from previous year |
||||
|
2022 |
2023 |
2024 |
2025 |
2026 |
||
|
GDP |
||||||
|
US |
9 |
2.1 (0) |
2.2 (0.6) |
1.1 (0.1) |
1.5 (-0.2) |
1.8 (0.1) |
|
Euro area |
35 |
3.4 (-0.1) |
0.4 (-0.2) |
0.9 (-0.5) |
1.8 (0.1) |
1.6 (0) |
|
UK |
11 |
4.1 (0) |
0.4 (0.1) |
0.4 (-0.2) |
1.4 (-0.2) |
1.7 (0) |
|
Sweden |
13 |
2.9 (0) |
-0.5 (-0.4) |
0.5 (-0.3) |
2.3 (0.1) |
2 (0.2) |
|
China |
6 |
3.2 (0) |
4.9 (-0.3) |
3.9 (-0.6) |
4.1 (0.1) |
4 (0.3) |
|
13 trading partners1 |
100 |
3.4 (-0.1) |
1 (-0.1) |
1.3 (-0.3) |
2.2 (0.1) |
2.1 (0.1) |
|
5 trading partners2 |
3.2 (-0.1) |
1 (-0.1) |
1.1 (-0.4) |
2.1 (0.1) |
2 (0.1) |
|
|
Prices |
||||||
|
Underlying inflation3 |
4.8 (0) |
5.4 (0.1) |
2.9 (0.1) |
2.4 (0.1) |
2.1 (0) |
|
|
Wage growth3 |
4.3 (0) |
5 (0) |
4.1 (0.1) |
3.5 (0) |
3.1 (0) |
|
|
Prices for consumer goods imported to Norway4 |
7.3 (0) |
-0.4 (-0.2) |
1.2 (0.1) |
0.9 (0.1) |
0.8 (0) |
|
1 The aggregate includes: Euro area, China, UK, Sweden, US, Brazil, Denmark, India, Poland, South Korea, Singapore, Thailand and Turkey. Export weights.
2 The aggregate includes: Euro area, China, Sweden, UK and US. Export weights.
3 The aggregate includes: Euro area, Sweden, UK and US. Import weights.
4 In foreign currency terms. Including composition effects and freight rates.
Sources: Refinitiv Datastream and Norges Bank
TABlE 2a Consumer prices. Twelve-month change. Percent
|
2023 |
|||||||
|
Jun |
Jul |
Aug |
Sep |
Oct |
Nov |
Dec |
|
|
Consumer price index (CPI) |
|||||||
|
Actual |
6.4 |
5.4 |
4.8 |
||||
|
Projections MPR 2/23 |
6.0 |
6.2 |
6.1 |
5.5 |
|||
|
Projections MPR 3/23 |
4.2 |
4.4 |
5.4 |
5.7 |
|||
|
CPI-ATE |
|||||||
|
Actual |
7.0 |
6.4 |
6.3 |
||||
|
Projections MPR 2/23 |
6.6 |
6.3 |
6.4 |
6.2 |
|||
|
Projections MPR 3/23 |
6.1 |
6.0 |
6.1 |
5.8 |
|||
|
Imported consumer goods in the CPI-ATE |
|||||||
|
Actual |
7.3 |
6.9 |
6.6 |
||||
|
Projections MPR 2/23 |
6.9 |
6.5 |
6.5 |
6.2 |
|||
|
Projections MPR 3/23 |
6.4 |
6.2 |
6.2 |
5.8 |
|||
|
Domestically produced goods and services in the CPI-ATE |
|||||||
|
Actual |
6.7 |
6.0 |
6.0 |
||||
|
Projections MPR 2/23 |
6.6 |
6.3 |
6.3 |
6.0 |
|||
|
Projections MPR 3/23 |
5.8 |
5.8 |
5.9 |
5.7 |
|||
Sources: Statistics Norway and Norges Bank
TABLE 2b House prices. Monthly change. Seasonally adjusted. Percent
|
2023 |
|||||||
|
Jun |
Jul |
Aug |
Sep |
Oct |
Nov |
Dec |
|
|
Actual |
-0.6 |
0.1 |
-0.6 |
||||
|
Projections MPR 2/23 |
0.0 |
0.0 |
-0.1 |
-0.2 |
|||
|
Projections MPR 3/23 |
-0.4 |
-0.3 |
-0.2 |
-0.1 |
|||
Sources: Eiendomsverdi, Finn.no, Real Estate Norway and Norges Bank
TABLE 2c Registered unemployment (rate). Percent of labour force. Seasonally adjusted
|
2023 |
|||||||
|
Jun |
Jul |
Aug |
Sep |
Oct |
Nov |
Dec |
|
|
Actual |
1.8 |
1.8 |
1.9 |
||||
|
Projections MPR 2/23 |
1.8 |
1.9 |
1.9 |
2.0 |
|||
|
Projections MPR 3/23 |
1.9 |
1.9 |
2.0 |
2.0 |
|||
Sources: Norwegian Labour and Welfare Administration (NAV) and Norges Bank
TABLE 2d GDP for mainland Norway. Monthly change. Seasonally adjusted. Percent
|
2023 |
|||||||
|
Jun |
Jul |
Aug |
Sep |
Oct |
Nov |
Dec |
|
|
Actual |
0.1 |
0.2 |
|||||
|
Projections MPR 2/23 |
0.3 |
0.0 |
-0.1 |
-0.1 |
|||
|
Projections MPR 3/23 |
-0.1 |
-0.1 |
0.1 |
0.1 |
0.1 |
||
Sources: Statistics Norway and Norges Bank
TABLE 2e GDP for mainland Norway. Quarterly change.1 Seasonally adjusted. Percent
|
2023 |
||||
|
Q1 |
Q2 |
Q3 |
Q4 |
|
|
Actual |
0.2 |
0.0 |
||
|
Projections MPR 2/23 |
0.1 |
0.2 |
0.0 |
|
|
Projections MPR 3/23 |
0.3 |
0.1 |
||
1 Quarterly figures based on monthly national accounts.
Sources: Statistics Norway and Norges Bank
TABlE 3 Projections for main economic aggregates
|
Change from projections in Monetary Policy Report 2/23 in brackets |
Percentage change from previous year (unless otherwise stated) |
|||||
|
In billions of NOK 2022 |
2022 |
Projections |
||||
|
2023 |
2024 |
2025 |
2026 |
|||
|
Prices and wages |
||||||
|
CPI |
5.8 |
5.8 (-0.2) |
4.8 (0.9) |
3.1 (0.2) |
2.5 (0.1) |
|
|
CPI-ATE |
3.9 |
6.3 (0.0) |
4.7 (0.1) |
3.4 (0.1) |
2.6 (0.2) |
|
|
Annual wages |
4.3 |
5.5 (0.0) |
5.2 (0.5) |
4.6 (0.3) |
3.9 (0.2) |
|
|
Real economy1 |
||||||
|
Gross domestic product (GDP) |
5 545 |
3.2 |
1.4 (0.1) |
0.4 (-0.1) |
1.0 (-0.1) |
1.1 (0.1) |
|
GDP, mainland Norway2 |
3 559 |
3.7 |
1.3 (0.1) |
0.3 (0.1) |
0.8 (-0.1) |
1.4 (0.0) |
|
Output gap, mainland Norway (level) |
1.8 |
0.8 (0.2) |
-0.3 (0.2) |
-0.8 (0.0) |
-0.7 (0.0) |
|
|
Employment, persons, QNA |
3.9 |
1.5 (0.3) |
-0.1 (0.1) |
0.1 (-0.1) |
0.6 (0.0) |
|
|
Registered unemployment (rate, level) |
1.8 |
1.8 (-0.1) |
2.2 (-0.1) |
2.4 (0.0) |
2.4 (0.0) |
|
|
Demand1 |
||||||
|
Mainland demand2 |
3 762 |
4.9 |
-0.3 (0.3) |
-0.1 (-0.4) |
1.8 (0.0) |
2.1 (0.2) |
|
– Household consumption |
1 807 |
7.0 |
-0.6 (1.0) |
0.1 (0.0) |
1.9 (-0.2) |
2.5 (-0.1) |
|
– Business investment |
449 |
14.5 |
2.3 (-0.4) |
-3.0 (-2.5) |
1.9 (-0.3) |
1.5 (0.2) |
|
– Housing investment |
232 |
-1.4 |
-14.5 (-3.8) |
-4.7 (-2.6) |
4.4 (1.6) |
6.6 (2.8) |
|
– Public demand |
1 275 |
0.3 |
1.6 (0.0) |
1.3 (0.2) |
1.2 (0.1) |
1.0 (0.2) |
|
Petroleum investment2 |
176 |
-6.5 |
6.0 (1.0) |
6.0 (3.0) |
2.0 (0.0) |
-1.0 (-1.5) |
|
Mainland exports2 |
935 |
8.4 |
8.0 (1.9) |
1.1 (-1.3) |
3.0 (-0.1) |
3.2 (0.0) |
|
Imports |
1 515 |
9.2 |
2.3 (-0.8) |
-0.2 (-0.8) |
3.9 (0.1) |
2.2 (0.1) |
|
House prices and debt |
||||||
|
House prices |
4.9 |
-0.3 (-0.6) |
0.8 (0.2) |
4.3 (0.8) |
6.0 (1.1) |
|
|
Household credit (C2) |
4.5 |
3.7 (-0.3) |
3.1 (-0.3) |
2.7 (-0.3) |
2.4 (-0.4) |
|
|
Interest rate, exchange rate and oil price |
||||||
|
Policy rate (level) |
1.3 |
3.5 (0.0) |
4.4 (0.3) |
4.0 (0.3) |
3.4 (0.3) |
|
|
Import-weighted exchange rate (I-44) (level) |
110.0 |
118.7 (-0.7) |
117.4 (-0.7) |
116.5 (-0.1) |
116.4 (0.2) |
|
|
Policy rate, trading partners (level) |
0.7 |
3.8 (0.0) |
4.2 (0.2) |
3.4 (0.2) |
3.1 (0.3) |
|
|
Oil price, Brent Blend. USD per barrel |
101.0 |
84.2 (6.2) |
86.2 (12.8) |
80.0 (9.0) |
75.8 (6.6) |
|
|
Household income and saving1 |
||||||
|
Real disposable income excl. dividend income |
2.7 |
-2.1 (0.3) |
0.7 (-0.2) |
2.3 (0.0) |
2.9 (0.1) |
|
|
Saving ratio excl. dividend income (rate, level) |
0.2 |
-1.2 (-0.6) |
0.1 (-0.8) |
0.4 (-0.6) |
1.0 (-0.4) |
|
|
Fiscal policy |
||||||
|
Structural non-oil deficit as a percentage of GPFG3 |
2.7 |
3.0 (0.0) |
2.7 (0.1) |
2.6 (0.0) |
2.5 (0.0) |
|
|
Structural non-oil deficit as a percentage of trend GDP |
9.4 |
10.2 (0.1) |
10.3 (0.2) |
10.2 (0.1) |
10.1 (0.1) |
|
1 All figures are working-day adjusted.
2 Annual figures based on monthly national accounts.
2 Government Pension Fund Global measured at the beginning of the year.
Sources: Eiendomsverdi, Finn.no, Ministry of Finance, Norwegian Labour and Welfare Administration (NAV), Real Estate Norway, Refinitiv Datastream, Statistics Norway and Norges Bank