Monetary policy assessment
Consumer prices have risen rapidly, and inflation is markedly above target. Activity in the Norwegian economy is still high, and unemployment has remained very low. At the same time, the Norwegian economy is slowing down.
Since the September 2022 Monetary Policy Report, inflation has been higher than projected and is expected to remain high for longer than previously projected. At the same time, the labour market appears to be a little tighter than anticipated. On the other hand, the policy rate has been raised considerably over a short period of time, and monetary policy has started to have a tightening effect on the economy. There are signs that the slowdown may prove somewhat more pronounced than envisaged in September.
Norges Bank’s Monetary Policy and Financial Stability Committee decided to raise the policy rate from 2.5% to 2.75% at its meeting on 14 December. Based on the Committee’s current assessment of the outlook and balance of risks, the policy rate will most likely be raised further in 2023 Q1.
High inflation and weaker global growth outlook
Elevated energy prices, strong demand and supply side constraints have led to high global inflation over the past year, but consumer price inflation may now have passed the peak in some countries, such as the US. Futures prices indicate that both gas and electricity prices will remain high over the coming year but will fall thereafter. Other commodity prices have edged down over the past six months, and global supply chain disruptions appear to have eased. Global freight rates have shown a marked decline.
Chart A Lower gas and electricity prices1 Øre/kWh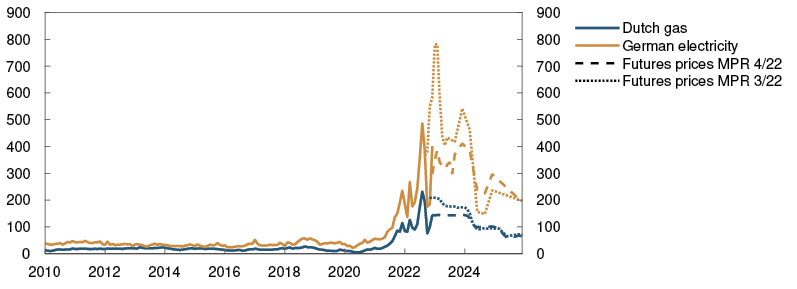
Central banks in many trading partner countries have responded to the surge in inflation by raising policy rates to the highest levels seen in more than a decade. Labour markets are tight, but the fall in unemployment appears to have come to a halt in some countries. Wage growth has accelerated and is expected to remain high next year. Economic activity among our trading partners has been slightly higher than projected in the September Report, but forward-looking indicators point to weaker growth ahead. High inflation and higher interest rates are expected to curb consumption growth. At the same time, high energy prices have prompted some European companies to scale back production. GDP growth among our trading partners is expected to be low next year.
Chart B Sharp tightening of monetary policy in many countries2 Policy rates and estimated forward rates in selected countries. Percent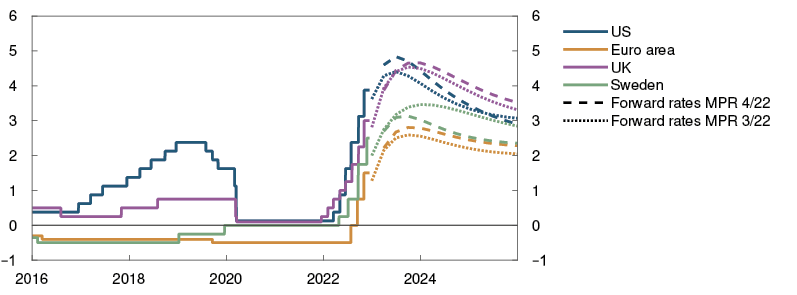
Volatile financial markets
Financial markets have been highly volatile since the September Report. Market-based expectations of global policy rates are a little higher in the near term but indicate expectations of a gradual moderation in the pace of policy rate hikes over the next year.
The krone exchange rate has fluctuated considerably in recent months but is now broadly in line with the projections in the September Report. The volatility in financial markets is adding to the uncertainty about movements in the krone exchange rate ahead. The expected path of Norway’s policy rate has fallen since September. Higher money market premiums have pushed up corporate borrowing costs. The rise in mortgage lending rates has been broadly as expected.
High activity in the Norwegian economy, but prospects for weaker growth ahead
Activity in the Norwegian economy has been higher through 2022 than previously assumed, and mainland GDP has increased faster in recent months than expected. High inflation and higher interest rates have reduced household purchasing power, but consumption has so far remained higher than projected in the September Report.
Chart C Higher-than-projected economic activity3 GDP for mainland Norway. Seasonally adjusted. Index. February 2020 = 100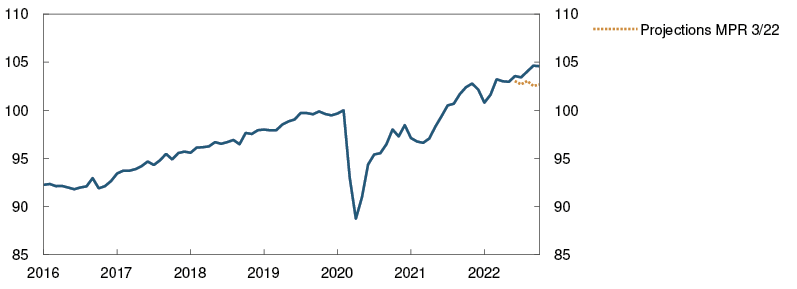
The labour market is tight. Employment has continued to rise, and unemployment has remained very low. Seasonally adjusted registered unemployment was 1.6% in November, which was slightly lower than projected in the September Report. There are still considerable labour shortages, but shortages are easing. The share of enterprises in Norges Bank’s Regional Network reporting that labour shortages are limiting output fell further in November. The number of job vacancies has also decreased.
Chart D Labour shortages have eased4 Capacity utilisation and labour shortages according to the Regional Network. Percentage shares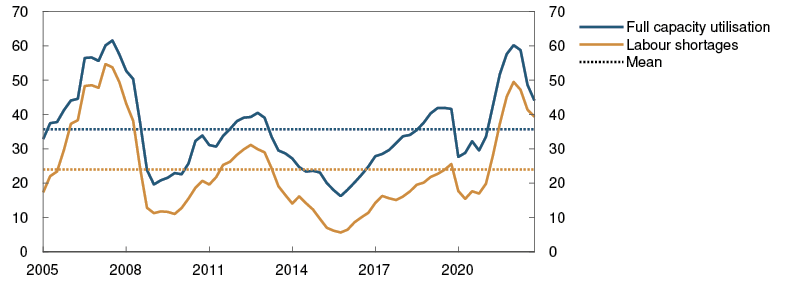
Regional Network enterprises on the whole expect a marked decline in output over the next half year. Enterprises expect lower demand ahead, on the back of high price and cost inflation, higher interest rates and a decline in public sector projects.
The housing market has turned. House prices have fallen faster than projected, and the number of unsold homes has increased markedly. House prices are expected to fall further in the period to autumn 2023. A reduction in household wealth due to a fall in house prices, combined with the prospect of a notable decline in household real disposable income in 2023, pushes down consumption between 2022 and 2023. The household saving ratio is declining, and saving is expected to remain low ahead.
Activity in the Norwegian economy is projected to fall in the near term. Higher inflation and a weaker housing market are expected to contribute to a more rapid cooling of the Norwegian economy than envisaged in September. Substantial investments in the petroleum industry and activities related to climate transition are expected to lift activity somewhat further ahead.
Prospects of high inflation for a longer period
Inflation in Norway is high and appreciably higher than projected in the September Report. In November, the 12-month rise in the consumer price index (CPI) was 6.5%. Energy and food prices in particular have risen sharply over the past year, but prices across a range of other goods and services have also risen more than normal. The 12-month rise in the consumer price index adjusted for tax changes and excluding energy products (CPI-ATE) has moved up and stood at 5.7% in November. Prices for both imported goods and domestically produced goods and services are rising at a fast pace. Other indicators of underlying inflation have also edged higher. Inflation is expected to remain higher in the period ahead than previously projected.
According to Norges Bank’s Expectations Survey, inflation expectations for the coming years have increased recently. Long-term inflation expectations increased further in 2022 Q4 and are above the 2% target.
Wage growth is set to be higher in 2022 than in 2021, partly reflecting labour market tightness. Register-based wage statistics indicate that wage growth in the first three quarters of 2022 may have been slightly lower than projected. The projection for wage growth in 2022 has been revised down to 3.9%, implying a sharp decline in real wages. Norges Bank’s Expectations Survey indicates that wage growth expectations for 2023 have increased since September and nominal wage growth is expected to show a marked increase in 2023.
Chart E Inflation markedly above the 2% target5 CPI and CPI-ATE. Twelve-month change. Percent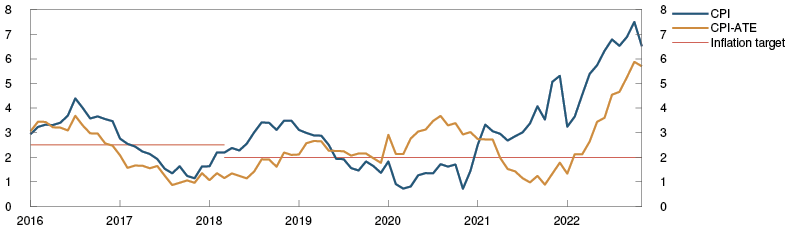
Need for higher interest rates in the Norwegian economy
The operational target of monetary policy is annual consumer price inflation of close to 2% over time. Inflation targeting shall be forward-looking and flexible so that it can contribute to high and stable output and employment and to countering the build-up of financial imbalances.
The Committee assesses that a higher policy rate is still needed to dampen inflation. Consumer prices have risen rapidly, and inflation is markedly above target. Activity in the Norwegian economy is still high, and unemployment has remained very low. At the same time, the economy is slowing down, and higher inflation is reducing household purchasing power. An easing of economic pressures will help curb inflation further out.
Since the September Report, inflation has been higher than projected and is expected to remain high for longer than previously projected. At the same time, the labour market appears to be a little tighter than anticipated. On the other hand, the policy rate has been raised considerably over a short period of time, and monetary policy has started to have a tightening effect on the economy. There are signs that the slowdown may prove somewhat more pronounced than envisaged in September.
Chart F Higher policy rate curbs inflation6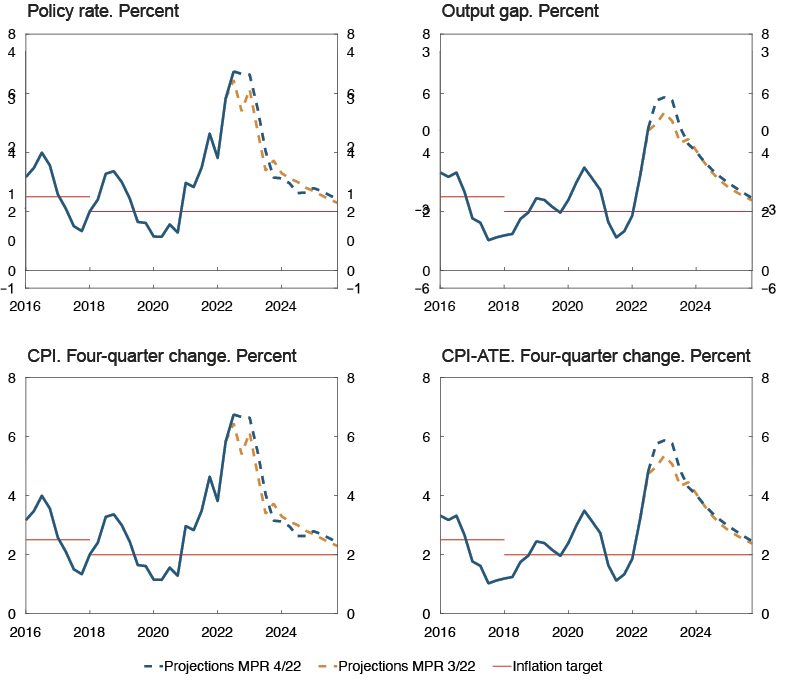
The policy rate forecast indicates a policy rate of around 3% in 2023, slightly higher than in the previous Report. In the projections, inflation falls and approaches the inflation target further out. The output gap falls, and output stays somewhat below potential in the coming years. Unemployment then increases somewhat, albeit from a low level.
In its discussion, the Committee was concerned with higher-than-normal uncertainty surrounding the forecasts for the Norwegian economy. There is uncertainty associated with households’ response to higher inflation and increased interest rates, and the potential effects of high inflation on wage and price formation. The future path of the policy rate will depend on economic developments. If the pressures in the economy persist, and signs emerge that inflation will remain high for longer than currently projected, a higher policy rate may be needed than currently envisaged. If inflation falls faster or unemployment rises more than projected, the policy rate may be lower than projected.
The Committee decided unanimously to raise the policy rate by 0.25 percentage point to 2.75%. Based on the Committee’s current assessment of the outlook and balance of risks, the policy rate will most likely be raised further in 2023 Q1.
Ida Wolden Bache
Pål Longva
Øystein Børsum
Ingvild Almås
Jeanette Fjære-Lindkjenn
14 December 2022
1 Period: January 2010 – December 2025. Futures prices at 20 September 2022 for MPR 3/22 and at 13 December 2022 for MPR 4/22.
2 Period: 1 January 2016 – 31 December 2025. Daily data through 13 December 2022. Quarterly data from 2022 Q4 for MPR 3/22 and 2023 Q1 for MPR 4/22. Forward rates at 16 September 2022 for MPR 3/22 and at 13 December 2022 for MPR 4/22. ECB’s deposit facility rate for the euro area.
3 Period: January 2016 – October 2022. Projections from June 2022 for MPR 3/22.
4 Period: 2005 Q1 – 2022 Q4. Share of contacts that will face some or considerable difficulty meeting increased demand and share of contacts citing labour shortages as a constraint on production. The question about labour is asked only of the enterprises reporting full capacity utilisation, but the series shows the share of all contacts included in the interview period. The local government and hospital sector is omitted from the capacity utilisation series, but is, however, included in the labour force series.
5 Period: January 2016 – November 2022. CPI-ATE: CPI adjusted for tax changes and excluding energy products.
6 Period: 2016 Q1 – 2025 Q4. Projections from 2022 Q3 for MPR 3/22 and 2022 Q4 for MPR 4/22 for the policy rate, CPI and CPI-ATE. The output gap measures the percentage deviation between mainland GDP and estimated potential mainland GDP. CPI-ATE: CPI adjusted for tax changes and excluding energy products.
Assessment of the countercyclical capital buffer requirement
In March, the decision was made to raise the countercyclical capital buffer rate to 2.5%, effective from 31 March 2023. At its meeting on 14 December, Norges Bank’s Monetary Policy and Financial Stability Committee decided to maintain this requirement.
The countercyclical capital buffer is intended to strengthen banks’ solvency and mitigate the risk that banks amplify an economic downturn. If a downturn will or could cause a marked reduction in credit supply, the countercyclical capital buffer rate should be lowered.
Activity in the Norwegian economy is still high, and unemployment has remained very low. At the same time, the Norwegian economy is slowing down. The uncertainty surrounding the forecasts for the Norwegian economy is higher than normal.
Property prices have risen substantially in recent years, and many households are highly indebted. Such vulnerabilities may amplify a downturn. Household credit growth has slowed in autumn, while corporate credit growth has remained elevated. At the same time, residential and commercial property prices have fallen, and they are expected to fall further. Persistently low yields increase the risk of a sharp fall in commercial property prices.
Creditworthy firms and households appear to have ample access to credit, even if there are some signs of a tightening of banks’ credit standards. Bond risk premiums have risen markedly in 2022, particularly for commercial real estate firms.
Norwegian banks satisfy the capital requirements and are highly profitable. Bank losses are expected to be low ahead. Analyses in Financial Stability Report 2022 show that banks are resilient and able to absorb losses and maintain lending in a severe economic downturn. The countercyclical capital buffer rate of 2.5% helps banks to remain resilient so that they can perform their tasks also in the event of economic downturns.
The Committee unanimously decided to keep the countercyclical capital buffer rate at 2.5%.
Ida Wolden Bache
Pål Longva
Øystein Børsum
Ingvild Almås
Jeanette Fjære-Lindkjenn
14 December 2022
1 The global economy
Consumer price inflation is very high in many countries. European gas and electricity prices remain at high levels, but futures prices for the coming year are lower than in September. The high level of inflation is reducing household purchasing power. Trading partner GDP growth is expected to be low in 2023. The projection has been revised down since the September 2022 Monetary Policy Report. The high degree of financial market volatility has persisted since September. Market forward rates indicate that policy rate expectations for the period ahead are slightly higher than in September and that central banks will gradually slow the pace of monetary policy tightening.
High gas and electricity prices dampen activity ahead
Among most of Norway’s trading partners, labour markets are tight, and GDP rose more than expected between 2022 Q2 and Q3. Growth picked up in the US and China, while activity levels in the euro area and the UK were little changed.
Growth prospects for the coming quarters are weak. European gas and electricity prices remain at historically high levels. Futures prices indicate that gas and electricity prices will remain elevated but in the coming year, be lower than assumed in the September Report (see "Futures prices for energy and other commodities remain high"). In autumn, many European firms scaled back production due to high energy costs (Chart 1.1). Households in many countries are receiving fiscal support, but energy costs will still be high in the coming quarters. It is difficult to project the economic impact of gas and electricity market developments. High gas and electricity prices are now expected to dampen activity in Europe more than assumed in the September Report.
Chart 1.1 Energy-intensive industrial production in the euro area has fallen1 Industrial production. Index. 2019 = 100. Three-month moving average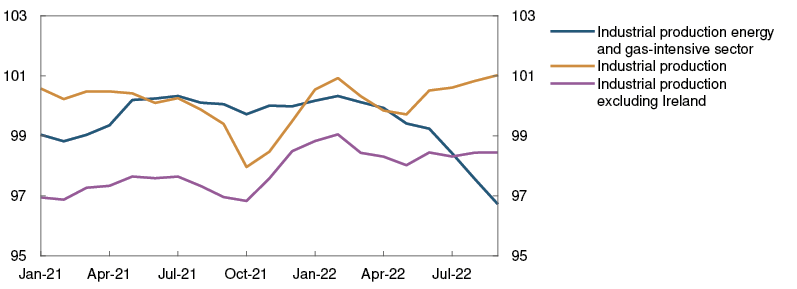
Consumer price inflation is very high. In addition, many central banks have raised their policy rates substantially since spring, and market policy rate expectations indicate further rate hikes in the period to summer 2023 in both Europe and the US. Households are expected to reduce saving further, but consumption in Europe will likely decline in the coming quarters due to the high cost of living. Activity indicators for manufacturing and services are low (Chart 1.2), and investment is expected to decline ahead. These factors combined imply a likely decline in European economic activity through autumn and winter. In addition, lockdowns related to higher Covid infection rates will dampen growth in China.
Chart 1.2 Activity indicators point to lower growth in Europe2 PMI manufacturing (output) and services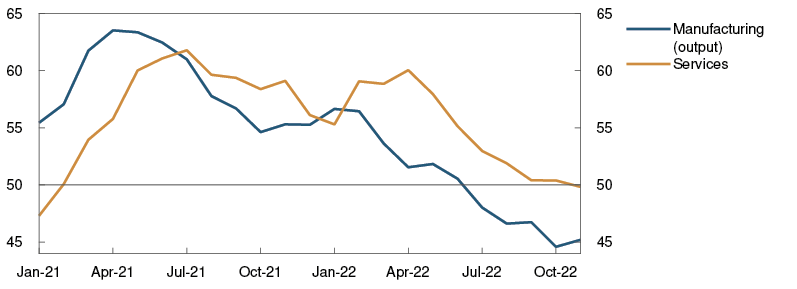
Monetary policy is assumed to be tightened in line with market policy rate expectations and commodity prices to move in line with futures prices. In the UK, there are plans for considerable fiscal tightening, while higher defence and energy investment in Europe are likely to boost activity further out in the projection period. In China, growth is expected to be slower ahead than in the pre-pandemic years. This partly reflects measures to ensure more domestic consumption-driven growth and less dependence on foreign trade, as well as ongoing trade conflicts with other countries. Trading partner GDP growth is projected to slow from 3.4% in 2022 to 0.5% in 2023, before picking up again in 2024 (Annex Table 1). The projections for 2023 and 2024 have been revised down since the September Report (Chart 1.3). Import growth among trading partners is projected to fall from over 7% in 2022 to below zero in 2023.
Chart 1.3 Weaker growth outlook3 GDP for trading partners. Quarterly change. Seasonally adjusted. Percent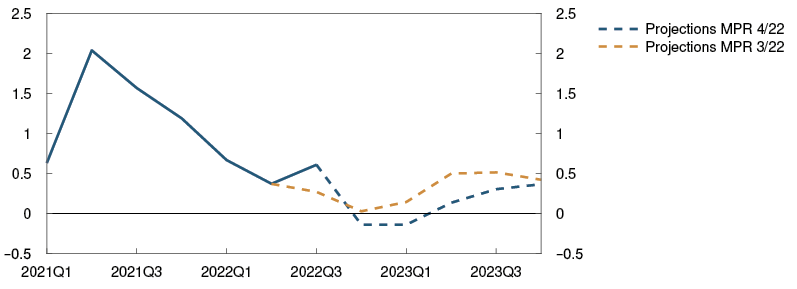
High consumer price inflation
Pandemic-related supply and demand conditions and the war in Ukraine have contributed to high inflation among Norway’s main trading partners since autumn 2021, but consumer price inflation may now have passed the peak in some countries, such as the US. In the US, 12-month CPI inflation fell somewhat in recent months, while core CPI inflation has run slightly above 6% (Chart 1.4). In the euro area, headline inflation slowed to 10% from October to November 2022. Both energy and food price inflation is high. Underlying consumer price inflation was 5% in November. In recent months, underlying inflation among trading partners has been higher than projected in the September Report, particularly in Europe.
Chart 1.4 Consumer price inflation remains high4 Consumer prices. Twelve-month change. Percent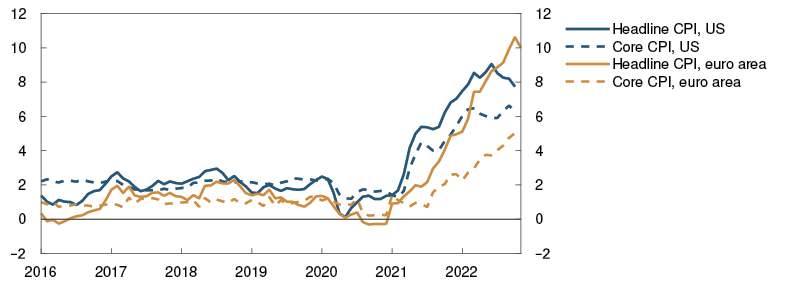
Goods freight rates have fallen substantially over the past six months, with rates from Asia to the US down to pre-pandemic levels. At the same time, many commodity prices fell markedly over summer and autumn, which will eventually dampen consumer goods inflation. On the other hand, high energy prices have pushed up business costs, with some expected pass-through to prices for goods and services.
Labour markets are tight, but the fall in unemployment appears to have come to a halt in a number of countries and labour demand appears to be declining in both the US and Europe. Wage growth among Norway’s main trading partners is projected to be about 4.5% in both 2022 and 2023, slowing gradually thereafter. Long-term market-based inflation expectations are little changed since the September Report and are close to the inflation targets of both the US and the euro area. Underlying consumer price inflation for trading partners as a whole is projected to slow from 4.8% in 2022 to slightly above 4% in 2023, before gradually drifting down to around 2%. The projections have been revised up from the September Report.
Further policy rate rises abroad
Since the September Report, central banks abroad have continued to tighten monetary policy, primarily in response to high inflation. Central banks in the US, euro area, UK and Sweden have all raised their policy rates, which are now at their highest levels since the financial crisis. The market’s policy rate expectations for the coming period have risen slightly since the September Report. At the same time, forward rates indicate expectations of a slower pace of increase in policy rates in the coming year, which also reflects what most central banks have signalled.
The high degree of financial market volatility has persisted. Long-term global government bond yields rose in autumn but fell back in recent weeks to approximately the same level as in the September Report (Chart 1.5). Global equity indexes have advanced slightly since the September Report, while corporate bond risk premiums have declined.
Chart 1.5 Volatility in long-term interest rates5 Ten-year government bond yields for selected countries. Percent
Uncertainty surrounding the economic outlook
The ongoing war in Ukraine is adding to the uncertainty about developments ahead. The effects of the current broad and simultaneous monetary policy tightening are also uncertain. There is a risk that the higher cost of living for households and higher business costs will lead to lower consumption and investment among trading partners than currently envisaged. Consumer price inflation may then fall more rapidly. Energy supply constraints may also dampen activity more than anticipated. On the other hand, growth may prove to be stronger than expected if households spend more of their savings. The projections assume that wage earners will not be fully compensated for the high rate of inflation, but if that were to be the case, price and wage inflation could remain high for longer than currently expected. The pandemic is still adding to uncertainty. In China, the easing of pandemic-related restrictions may lift activity more than expected in the near term but could also lead to more lockdowns further ahead. There is also a risk of further decline in the Chinese housing market.
1 Period: January 2021 – September 2022. Energy- and gas-intensive sectors comprise mining and quarrying, manufacture of basic metals and fabricated metal products, except machinery and equipment, manufacture of rubber, plastic products and other non-metallic mineral products, manufacture of wood, paper, printing and reproduction of recorded media, manufacture of chemicals and chemical products and manufacture of coke and refined petroleum products. Weighted by share of total industry added value in 2019.
2 Period: January 2021 – November 2022. Aggregate for the euro area, UK and Sweden. Export weights.
3 Period: 2021 Q1 – 2023 Q4. Projections from 2022 Q3 for MPR 3/22 and from 2022 Q4 for MPR 4/22. Export weights. 13 trading partners.
4 Period: January 2016 – November 2022. Core CPI is consumer prices excluding energy and food in the US and consumer prices excluding energy, food, tobacco and alcohol in the euro area. Data to October for the US and to November for the euro area.
5 Period: 1 January 2020 – 9 December 2022.
Futures prices for energy and other commodities remain high
Energy and non-energy commodity prices are set to remain elevated ahead but have fallen back from the record levels seen earlier in 2022.
Key energy prices on the continent, such as Dutch wholesale gas and German wholesale electricity prices, are lower for this year and 2023 than envisaged in September (see Chart A in “Monetary policy assessment”), reflecting different EU policy measures for energy saving, higher energy production, and signals of possible price regulation. Moreover, energy consumption has declined as a result of mild weather through autumn. In addition, wind power production was high and the supply of liquified natural gas (LNG) was ample. European gas inventories increased and fears of winter rationing have eased. In recent weeks, wholesale natural gas and electricity prices have increased again, in large part due to cold, still and dry weather.
European futures prices indicate that wholesale gas and electricity prices will remain high in the year ahead. Uncertainty about price developments is very high, particularly related to the level of Russian gas exports and French nuclear power production. In addition, winter weather plays a significant role. Further ahead, futures contracts suggest that prices will again decline, although prices are expected to remain higher than they have been historically (Table 1.A). A prolonged reduction in Russian gas exports and problems related to nuclear power production in France could contribute to energy shortages in Europe in the coming years.
Table 1.A Energy and commodity prices
|
Percentage change from projections in Monetary Policy Report 3/22 in brackets |
Average price |
Actual prices and futures prices1 |
|||||
|
2020 |
2021 |
2022 |
2023 |
2024 |
2025 |
||
|
Oil, USD/barrel |
80 |
42 |
71 |
101 (-1) |
77 (-8) |
75 (-4) |
73 (-2) |
|
Gas, USD/barrel |
40 |
18 |
87 |
207 (-16) |
235 (-18) |
180 (2) |
120 (0) |
|
Petroleum2, USD/barrel |
63 |
34 |
85 |
164 (-16) |
200 (-18) |
153 (1) |
106 (-1) |
|
Coal, EUR/tonne |
66 |
44 |
102 |
278 (-5) |
241 (-17) |
234 (-14) |
213 (-18) |
|
Emission allowance prices, EUR/tonne |
10 |
25 |
53 |
81 (1) |
89 (19) |
94 (19) |
99 (18) |
|
German electricity, Øre/kWh |
36 |
36 |
106 |
265 (-20) |
392 (-25) |
297 (19) |
192 (-3) |
|
Nordic electricity, Øre/kWh |
32 |
12 |
64 |
148 (-16) |
209 (20) |
99 (25) |
79 (24) |
|
Electricity in southern Norway, Øre/kWh |
31 |
10 |
78 |
205 (-26) |
254 (-3) |
135 (11) |
107 (13) |
|
Electricity in northern Norway, Øre/kWh |
32 |
10 |
40 |
32 (23) |
50 (35) |
50 (47) |
49 (58) |
|
Aluminium, in thousands of USD/tonne |
1.9 |
1.7 |
2.5 |
2.7 (1) |
2.5 (8) |
2.6 (7) |
2.7 (6) |
|
Copper, in thousands of |
6.8 |
6.2 |
9.3 |
8.8 (1) |
8.5 (11) |
8.5 (11) |
8.5 (11) |
|
Wheat, USD/tonne |
210 |
202 |
258 |
331 (-2) |
276 (-15) |
280 (-10) |
268 (-6) |
|
Maize, USD/tonne |
183 |
143 |
227 |
271 (-1) |
246 (-5) |
231 (-3) |
214 (-1) |
1 Futures prices at 9 December 2022.
2 An estimated Norwegian petroleum export price. The price has been estimated based on the share of oil and gas in historical export figures. For futures prices, oil and gas have equal shares.
Sources: Refinitiv Datastream and Norges Bank
Wholesale electricity prices in southern Norway are also lower than assumed in the September Report, reflecting developments in European wholesale gas and electricity prices and higher water reservoir levels (Chart 1.A). Electricity futures prices for southern Norway are also lower than in September, but cold, still and dry weather has led to increased prices here as well in recent weeks. Futures prices indicate that wholesale electricity prices are expected to be markedly higher in the coming years than they have been historically. In northern Norway, wholesale electricity prices have recently increased substantially, primarily owing to lower wind and nuclear power production in Sweden and Finland. Futures prices nonetheless indicate that prices in northern Norway will remain lower than in southern Norway.
Chart 1.A Lower electricity prices in southern Norway but higher prices in Northern Norway1 Øre/kWh
Oil prices have declined since September and are around USD 75 per barrel (Chart 1.B). Futures prices further ahead have changed less and indicate a decline in oil prices to approximately USD 70 per barrel in 2025 (Table 1.A). Oil prices may fall more if global economic growth slows further. On the other hand, oil prices may remain elevated if OPEC+ cuts oil production further. In addition, the impact of the EU’s ban on Russian oil imports on Russian oil exports and the G7’s price cap on the sale of Russian oil to other countries is highly uncertain.
Chart 1.B Lower oil prices2 USD/barrel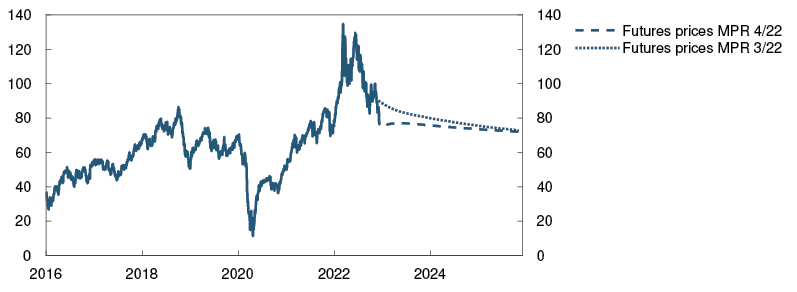
Industrial metals prices have risen since the September Report. An increased need for metals for the energy transition pushes up metals demand, while higher energy costs and other production factors are limiting supply. Futures prices have shown little change compared with the September Report and indicate that prices in the coming years will be higher than pre-pandemic levels (Table 1.A).
Overall, prices for global agricultural products and fertilisers are somewhat lower than in September, albeit still significantly higher than before the pandemic. More droughts and floods, geopolitical uncertainty and higher intermediate goods prices are also contributing to high futures prices for agricultural products, but these have declined somewhat since the September Report.
2 Financial conditions
Financial conditions in Norway are slightly tighter now than at the time of the September 2022 Monetary Policy Report. A higher policy rate has contributed to a further rise in interest rates on residential mortgage loans and corporate financing. Higher money market premiums have led to a further rise in corporate lending rates. The exchange rate has fluctuated considerably but is now close to the levels in September.
2.1 Monetary policy since September
At the monetary policy meeting on 21 September, the decision was made to raise the policy rate from 1.75% to 2.25%. The projections in the September Report were based on a rise in the policy rate to around 3% in the course of winter. At the monetary policy meeting on 2 November, the policy rate was raised further to 2.50%.
The market had priced in some probability of a larger rate hike in November. Market-based policy rate expectations have fallen since the publication of the September Report and are lower than the policy rate forecast in this Report.
Norges Bank has constructed a financial conditions index (FCI) that looks at financial conditions beyond the policy rate (see "A financial conditions index (FCI) for Norway"). The FCI shows that these financial conditions tightened through autumn but are now close to the levels prevailing in September.
2.2 Household and corporate lending rates
Higher residential mortgage rates ahead
Household interest payments have risen in pace with the rise in the policy rate. At the end of October, the average interest rate on outstanding mortgages was 3.3%, nearly 1 percentage point higher than at the beginning of July, broadly in line with that projected.
Around 85% of the policy rate increase since autumn 2021 has so far passed through to residential mortgage rates. The pass-through from the policy rate to deposit rates has been substantially lower than to lending rates but has recently risen a little. The average household deposit rate was 1.1% at the end of October. The lower pass-through to deposit rates has enabled banks to maintain underlying profitability without raising residential mortgage rates by as much as the policy rate.
In the projections, residential mortgage rates continue to increase in response to further increases in the policy rate, but still somewhat less than the rise in the policy rate. The forecast implies a rise in the average residential mortgage rate to around 4.3% in the course of 2023 (Chart 2.1).
Chart 2.1 Residential mortgage rates have risen1 Interest rates. Percent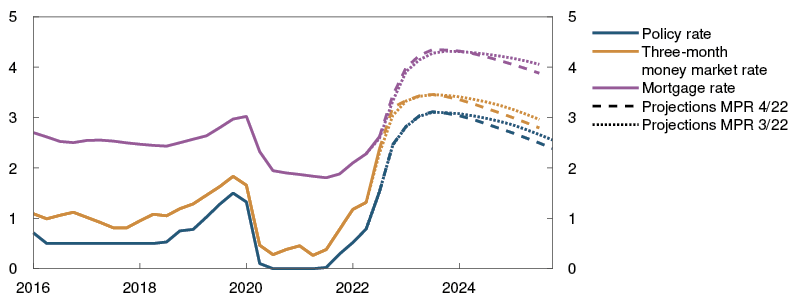
Higher interest costs for new corporate funding
Mainland firms’ interest-bearing NOK-denominated debt primarily comprises bank loans and debt securities. Over the past year, new corporate bank and bond funding has become gradually more expensive.
Floating-rate corporate funding, both bank and market funding, is closely linked to three-month Nibor. The increase in interest rates over the past year primarily reflects a higher policy rate and expectations of further policy rate increases (Chart 2.2). Since September, the Nibor premium has been higher than anticipated in the September Report, mainly owing to higher prices for US money market funding and low structural liquidity in the Norwegian banking system. So far in 2022 Q4, the premium has stood at just below 0.6 percentage point (Chart 2.3). The premium is expected to drift down towards 0.35 percentage point through winter. The projections are close to the market’s pricing of the forward Nibor premium.
Chart 2.2 Higher corporate lending rates2 Interest rates on new floating-rate NOK funding for mainland non-financial enterprises. Percent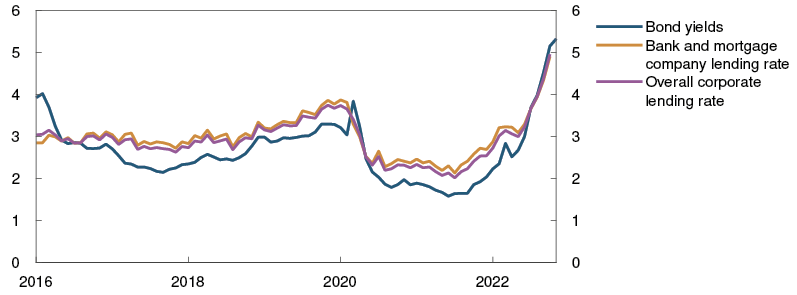
Chart 2.3 Money market premium has been higher than projected3 Money market premium. Percentage points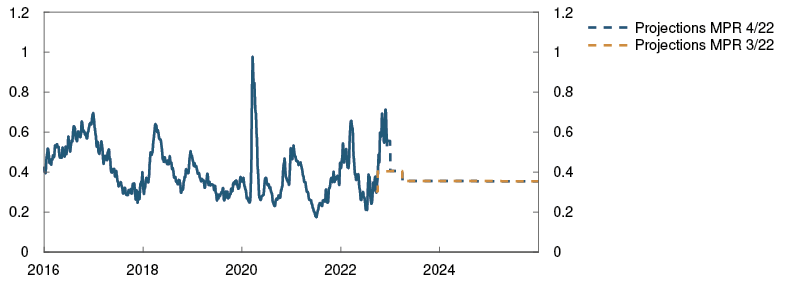
In addition to the money market rate, firms pay a premium on new funding in the form of a margin on bank funding and a risk premium in the bond market. Because total bank debt outstanding is around three times larger than bond debt, firms will be particularly affected by changes in bank lending spreads. Historically, the risk premium in the securities market has been quite volatile, while bank lending spreads on new loans have been relatively stable over a longer period.
Recently, bank lending spreads, as reflected in Statistics Norway’s interest rate statistics, have declined a little. However, a number of surveys, such as Norges Bank’s lending survey for Q3, may indicate that the lending spread will edge up from the current level. The risk premiums on new bond market financing have risen markedly over the past year and continued to rise into Q4. In recent weeks, risk premiums overall fell back to the levels in September. For commercial real estate companies, risk premiums have continued to rise.
A number of firms pay fixed rates on portions of their debt. For these loans, the level of long-term interest rates will have a particular bearing on the cost of new financing. Long rates have increased over the past year but have fallen somewhat since the September Report.
The Oslo Børs Benchmark Index is a little higher than in September but has shown some volatility in the period, with substantial differences in performance across sub-indexes. Aquaculture equities fell sharply after the Government announced a resource rent tax on the aquaculture sector, while manufacturing, technology and materials equities have posted strong advances.
1 Period: 2016 Q1 – 2025 Q4. Projections from 2022 Q3 for MPR 3/22 and from 2022 Q4 for MPR 4/22. The mortgage rate is the average rate on outstanding mortgage loans to households from the sample of banks and mortgage companies included in Statistics Norway’s monthly interest rate statistics.
2 Period: December 2013 – October 2022.
3 Period: 1 January 2016 – 31 December 2025. Five-day moving average. Latest observation on 9 December 2022. Projections from 2022 Q3 for MPR 3/22 and 2022 Q4 for MPR 4/22. The premium in the Norwegian money market rate is the difference between the three-month money market rate and the expected policy rate.
2.3 Krone exchange rate
Prospects for a stronger krone
The krone exchange rate, as measured by the import-weighted exchange rate index I-44, has weakened since the turn of the year, and the period has been marked by considerable volatility. Movements in the krone reflect a more pronounced rise in interest rates among trading partners than in Norway. In addition, high inflation in many countries and Russia’s invasion of Ukraine have given rise to substantial financial market uncertainty. The uncertainty has contributed to a higher NOK risk premium.
On the other hand, high petroleum prices through 2022 have led to a considerable improvement in Norway’s terms of trade. Over time, there has been a relatively close correlation between the terms of trade and the real exchange rate (Chart 2.4). The krone has not appreciated in 2022, as historical correlations with the terms of trade might suggest. This may reflect substantial uncertainty about the persistence of the rise in petroleum prices and developments in other drivers of the krone exchange rate.
Chart 2.4 Weaker krone than implied by terms-of-trade gains4 Relative hourly wage costs in manufacturing and terms of trade. Index. 2000 = 100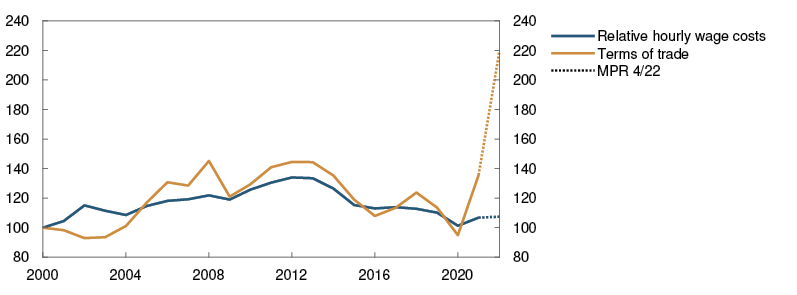
Since the September Report, the krone exchange rate has shown considerable volatility, but the krone is now close to the levels seen in September. Movements in the krone overall are in line with the projections in the September Report, despite the decline in petroleum prices and the larger increase in foreign interest rates than in domestic rates. The krone is expected to remain close to its current level in the near term.
Further out, uncertainty in global financial markets is expected to diminish and the krone to appreciate (Chart 2.5). The projections are little changed from the September Report, but there is considerable uncertainty about future movements in the exchange rate. The projections imply that interest rates in Norway will be lower than among trading partners through 2023, for the first time since before the financial crisis. This may suggest a weaker krone than envisaged. On the other hand, global inflation may abate faster than anticipated, which may reduce the turbulence in global financial markets further and lead to a stronger krone. Episodes of low NOK market liquidity may contribute to amplifying krone exchange rate volatility.
Chart 2.5 Stronger krone than implied by the interest rent differential5 Import-weighted exchange rate index (I-44). Difference between three-month money market rate in Norway and among trading partners. Percentage points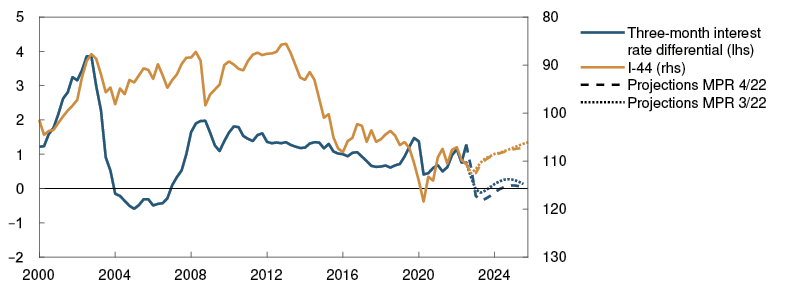
4 Period: 2000 – 2022. Projections for 2022. Relative hourly wage cost in Norwegian manufacturing compared with manufacturing among EU trading partners in a common currency. Terms of trade are defined as export prices devided by import prices.
5 Period: 2000 Q1 – 2025 Q4. Projections from 2022 Q3 for MPR 3/22 and 2022 Q4 for MPR 4/22. A rising index value for I-44 indicates a depreciating krone. The right-hand scale is inverted. Interest rate differential between Norway and its main trading partners.
A financial conditions index (FCI) for Norway
Financial conditions provide an indication of the ease with which finance can be accessed by banks, households and firms and on what terms. The policy rate is important because it determines the short-term risk-free interest rate that serves as a benchmark for other financial prices, but it is not enough to look at the policy rate alone. A number of other variables can also affect financial conditions. Norges Bank has therefore developed a financial conditions index (FCI) to obtain a more comprehensive impression of the price and availability of different types of financing beyond that indicated by the policy rate. Empirical exercises show that the index can help to explain the evolution of aggregate activity in the Norwegian economy.
An FCI may be useful for separating important signals from noise across financial markets and is therefore actively used by many central banks, institutions and major investment banks. For example, credit, liquidity and exchange rate risk premiums may vary considerably over time and contribute to greater interest rate volatility than implied by changes in the policy rate. Furthermore, changes in risk appetite and expectations regarding future earnings and interest rates may result in wide swings in asset prices, regardless of the policy rate. Financial prices can, in turn, also influence consumption and real investment.
Our aim was to construct a relatively simple index that covers the key financial variables in the Norwegian economy. The preferred index therefore contains relatively few variables and shares many features with indexes used by Sveriges Riksbank and Danmarks Nationalbank. Since the FCI is designed to capture the evolution of overall financial conditions beyond the evolution of the policy rate, interest rates in the index are adjusted for the policy rate and market policy rate expectations. We have also calculated indexes based on a larger sample of variables, but the result does not change appreciably. Since interest rates are included as risk premiums and asset prices are normalised relative to an estimated trend, variations in inflation will in principle not affect how the index is interpreted.
Household lending rates and house prices are included as indicators of household financial conditions. Since many households have floating-rate loans, a change in lending rates is likely to have a considerable impact on overall household borrowing costs. Changes in house prices will affect household balance sheets and households’ ability to borrow since housing is also commonly used as collateral. As measures of corporate financial conditions and borrowing costs, the index includes bond yields and bank lending rates. We also include measures of banks’ borrowing costs to quickly capture changes in borrowing costs before any pass-through to changes in household and corporate lending rates. Premiums in the covered bond and senior bank bond markets are therefore included in the index. In addition, we have included equity prices based on the Oslo Børs Benchmark Index, both the level measured as a deviation from a moving average and volatility. Equity prices can provide information on costs associated with equity financing. We have also included the volatility in the import-weighted exchange rate index as an indicator of the cost of hedging against foreign exchange rate movements.
In order to represent the typical variation in the variables in a single index, we perform a principal component analysis of standardised variables.1 A simple average of the variables could have been used or weights could have been estimated using different methods, but our estimates indicate that the index would not have been materially different.
Chart 2.A shows the evolution of the FCI since January 2003 at a monthly frequency. The last value is the average of daily observations in the period to 9 December 2022. The index is decomposed into submarket contributions. Since the index is standardised, it will vary around zero. It can therefore not be interpreted directly but provides an indication of the tightness or accommodativeness of financial conditions compared with a historical average. The credit market is especially important for explaining the evolution of the index over time. This reflects the bank-based nature of the financial system in Norway and the impact of changes in the money market premium on many interest rates. The decomposition suggests that all submarkets contributed to more accommodative financial conditions in the period leading up to the financial crisis and thus to dampening the tightening from a higher policy rate. In 2008, financial conditions became considerably tighter before normalising through 2009. The second substantial tightening of the index was in March 2020, but compared with the financial crisis, this tightening was brief. Through this autumn, the FCI has risen, which may have amplified the contribution from monetary tightening in the period. So far in December, the index has fallen back somewhat.
Chart 2.A Tighter financial conditions in autumn2 Financial conditions index. Standard deviation from mean
Chart 2.B shows Norges Bank’s FCI for Norway along with similar indexes developed by the IMF at a quarterly frequency. The chart shows that even if the indexes include somewhat different variables, financial conditions in Norway appear to have tracked developments abroad. The exception is the oil price decline in 2015, where financial conditions tightened more in Norway. In 2022, overall financial conditions have tightened somewhat, both in Norway and globally.
Chart 2.B Financial conditions are tightening in Norway and abroad-1 Financial conditions index. Standard deviation from mean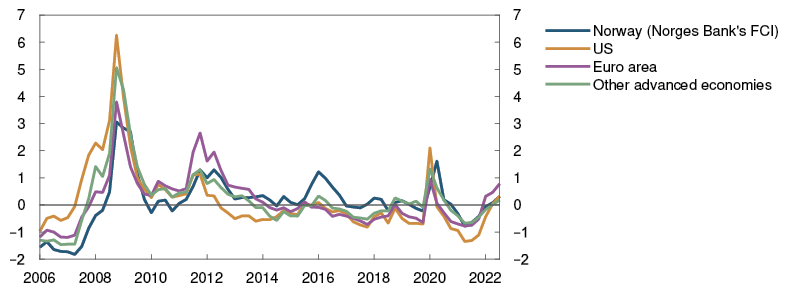
In order to evaluate the properties of the new index, we have investigated the degree to which it helps to explain aggregate activity in the Norwegian economy as measured by mainland GDP. In a forthcoming article-1, Bowe et al (2022) conduct an exercise where what can be characterised as unexpected variation in the FCI, ie shocks, is separated from what can be explained by other macroeconomic variables using a SVAR (structural vector auto-regressive) model. The model also includes the policy rate and mainland GDP. In the exercise, we show that shocks to the FCI affect economic growth. The negative impulse to economic activity from a contractionary financial shock is greater than the boost to activity following a corresponding expansionary financial shock (asymmetric response). Furthermore, in instances of contractionary financial shocks, the proportional decline in GDP growth will be greater the more pronounced the tightening (non-linear response). Based on this model, an unexpected 1 point rise in the index implies that GDP will fall by 0.8% after one year. The effect of an unexpected 1 percentage point increase in the policy rate is stronger and somewhat more persistent. After one year, GDP falls by 1.3%. These effects are highly uncertain.
The index can supplement analyses of financial conditions already included in our modelling system. The Bank’s main model NEMO includes the household lending rate and a weighted corporate rate based on lending rates and bond yields. This means that changes in risk and money market premiums that affect these interest rates will be covered by the monetary policy analysis. The same applies to changes in bank funding costs, which can also affect lending rates. NEMO also includes house prices. But the index can help us to provide a somewhat broader indication of financial conditions and provide early signals of risk and tightness of financial conditions. In the event of more pronounced changes in the index, eg associated with changes in market volatility and larger shifts in equity markets, it can also provide new signals. As mentioned, large increases in the index in particular can signal downside risks to the real economy.
1 This means that an average is subtracted from all variables, and the variables are divided by their standard deviation, which puts all variables on the same scale.
2 Period: January 2003 – December 2022. Monthly average. December is the average of observations up to and including 9 December 2022.
-1 Period: 2006 Q1 – 2022 Q3. Quarter-average.
-1 In a forthcoming Norges Bank Staff Memo (Bowe, Gerdrup, Maffei-Faccioli and Olsen, 2022) the index and SVAR analysis are documented in more detail.
3 The Norwegian economy
Consumer prices have risen rapidly, and inflation is markedly above the target of 2%. At the same time, unemployment is low, and the employment rate is high. Wage growth has increased and is projected to increase further next year.
High consumer price inflation and higher interest rates are curbing demand, and the Norwegian economy is assessed to have reached its cyclical peak. House prices have declined in recent months, and household consumption is expected to drift down ahead. Mainland investment is expected to decline from a high level.
From next year, inflation is expected to fall and approach the inflation target further out, on the back of lower capacity utilisation, an easing of international price pressures and a fall in energy prices. Unemployment is projected to rise somewhat, albeit from a low level.
3.1 Output and demand
Slowdown in the mainland economy
Activity in the Norwegian economy has recovered from the pandemic. Revised national accounts figures indicate that activity has been higher through 2022 than assumed in the September 2022 Monetary Policy Report. In 2022 Q3, the mainland economy grew by 0.8%.
At the same time, Norges Bank’s Regional Network contacts report that growth has slowed and they expect activity to decline markedly over the next half year (Chart 3.1). Enterprises in retail trade and other household services expect lower demand owing to weaker household purchasing power. Contacts in the construction industry report lower order volumes due to weak new home sales and lower public demand. Manufacturing is facing dampened prospects due to weaker developments in Norway and abroad, but strong demand from the energy sector softens the decline and contributes to strong growth in oil services.
Chart 3.1 Prospects for a slowdown in activity1 Reported and expected growth according to the Regional Network. Annualised. Percent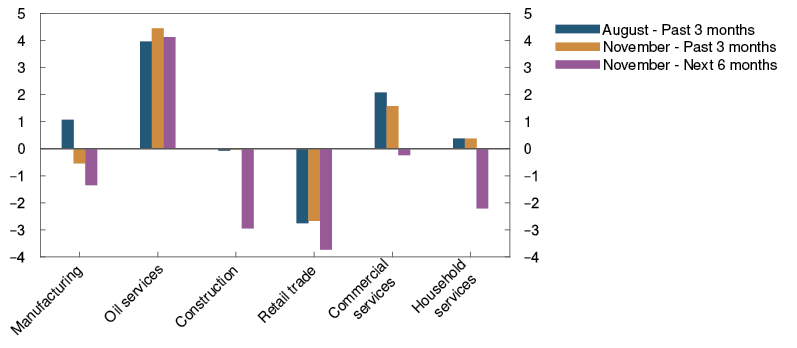
The Norwegian economy is assessed to have reached its cyclical peak, with activity declining through winter. House prices have fallen since the September Report, and expectations surveys indicate that that the economy is cooling down. Combined with higher inflation, activity is likely to fall to a further extent in the first half of 2023 than projected in the September Report. This is consistent with the forecasts from our modelling system for short-term forecasting, where a broad set of empirical models are weighted based on their historical forecasting performance (Chart 3.2).
Chart 3.2 Mainland GDP expected to decline2 GDP for mainland Norway. Quarterly change. Seasonally adjusted. Percent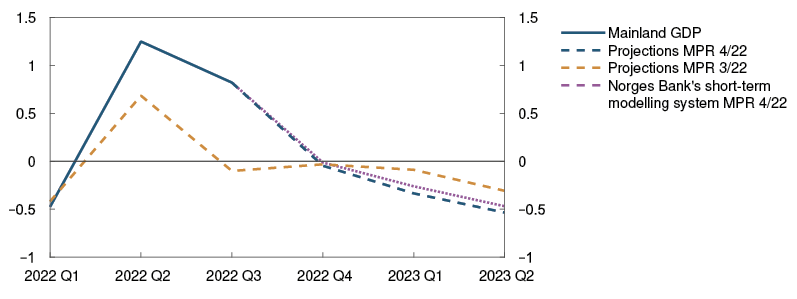
Mainland Norway GDP is projected to increase by 3.6% this year, primarily reflecting an increase in household consumption and business investment (Chart 3.3). Next year, lower consumption results in a 0.2% decline in mainland economic activity. In 2024 and 2025, economic activity is projected to pick up gradually. Increased investment in the petroleum industry and activities related to climate transition lift growth in the years ahead.
Chart 3.3 Lower household consumption reduces growth ahead3 GDP for mainland Norway. Annual change. Percent. Contribution to annual change. Percentage points
High inflation and higher interest rates curb consumption
Household consumption has increased considerably over the past year and continued to grow in 2022 Q3. This primarily reflects an increase in services consumption and spending abroad, while goods consumption has decreased so far this year.
Consumption has been higher than projected despite the fact that high inflation and an increase in interest expenses are reducing household purchasing power. The saving ratio has fallen and was negative in Q3. This may indicate that households have maintained consumption by drawing on accumulated savings. Card transaction data suggest that consumption growth has edged down through autumn, and household confidence indicators are at very low levels.
In the projections, consumption falls by about 1.5% in 2023, after growing by 6.5% in 2022 (Chart 3.4). Real disposable income declines markedly in 2023. A decline in house prices reduces household wealth and dampens consumption as a large share of wealth and debt is related to housing. The projections for consumption assume that households will continue to draw on accumulated savings, especially in 2022 and 2023. The saving ratio turns negative in 2023 and the ratio stays lower in the years ahead than in the years before the pandemic (Chart 3.5). Higher income and lower inflation are then expected to contribute to growth in consumption up to 2025.
Chart 3.4 Lower consumption growth next year4 Household consumption. Constant 2019 prices. Seasonally adjusted. Seasonally adjusted. In billions of NOK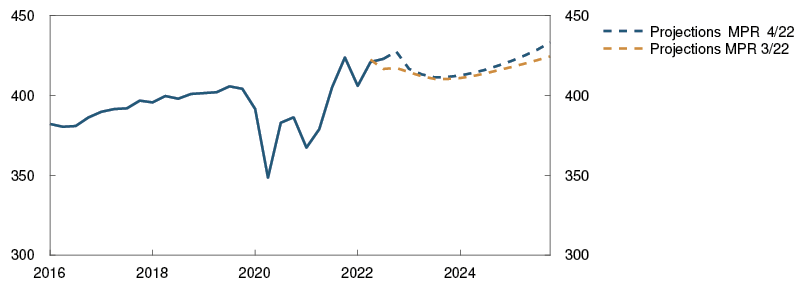
Chart 3.5 Sharp fall in household saving5 Household saving ratio excluding dividends. Percent
Weaker housing market
House prices have fallen by 2.6% since August, and the number of unsold homes has increased markedly. Higher interest rates are expected to continue to pull down house prices in the period to autumn 2023, but house prices will still be 12% higher than pre-pandemic levels. House prices rise gradually thereafter. The projections for house prices are lower than in the September Report (Chart 3.6). See Section 5 for a more detailed discussion of the housing market.
Chart 3.6 Steeper fall in housing investment6 Housing investment and real house prices. Annual change. Percent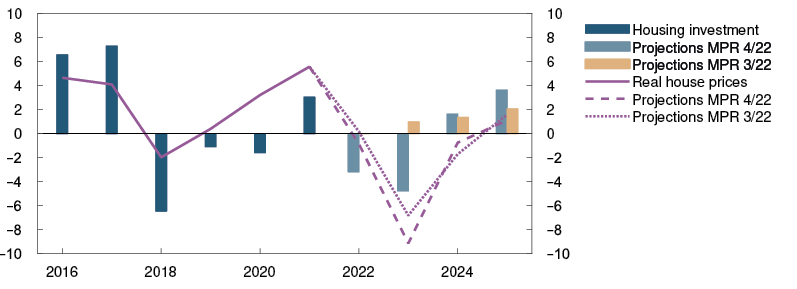
Housing investment has fallen more through 2022 than previously assumed. Falling house prices, labour shortages and high material costs have probably contributed to curbing investment recently. Housing investment is set to continue to fall into 2023 on the back of recent lower house prices and very low new home sales. Housing investment is projected to recover somewhat further out.
Business investment slows from high levels
Business investment is at a high level, boosted by a substantial and far stronger-than-expected increase in investment in the services sector in Q1. Regional Network enterprises expect slightly lower investment in retail trade and the services sector ahead.
Strong cost inflation, higher costs for new funding and weaker profitability for many firms are expected to weigh on investment. Business investment edges down in 2023, after rising by almost 17% in 2022 (Chart 3.7). Investment in activities related to climate transition in Norway and abroad are pulling up investment. A marked increase in manufacturing is projected in the years ahead, primarily reflecting large investments in batteries, hydrogen and carbon management (see box in Monetary Policy Report 2/21). Prospects for high electricity demand will likely boost electricity investment from 2023.
Chart 3.7 Investment in sectors other than power and manufacturing will edge lower in 20237 Business investment in mainland Norway. Annual change. Percent. Contribution to annual change. Percentage points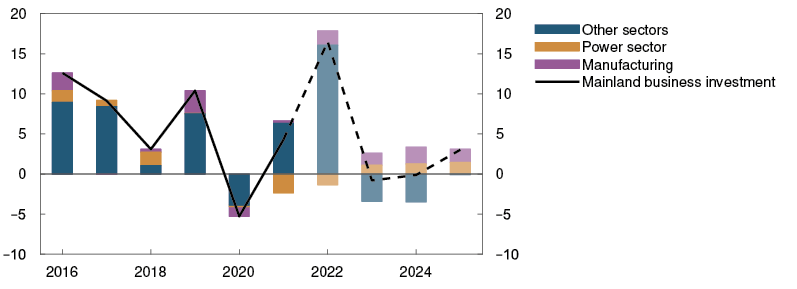
Petroleum investment has declined in recent years as several large projects on the Norwegian continental shelf have been completed. In order for new development projects to benefit from the temporary tax changes introduced in 2020, development plans must be submitted by end-year. As a result, given the many new projects now in the pipeline, petroleum investment is expected to show solid growth in the coming years (Chart 3.8), but the growth projections are lower than in the September Report as some planned development projects have been postponed or cancelled.
Chart 3.8 New development projects increase petroleum investment8 Petroleum investment. Constant 2022 prices. In billions of NOK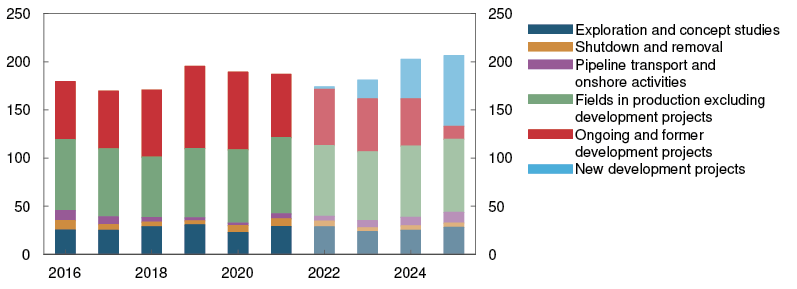
Normalisation of external trade
Oil services exports have increased considerably in 2022 on the back of a strong recovery in the global petroleum industry. Normalisation of activity among our trading partners and higher travel activity than during the pandemic have boosted exports from other mainland enterprises. Demand from the petroleum and renewables sectors abroad underpins export growth in 2023, while weaker growth prospects for our trading partners dampen growth for other mainland exports in the coming years. In 2025, export growth picks up, partly reflecting exports from new battery factories. An appreciation of the krone through the projection period dampens export growth slightly.
Cross border shopping and Norwegians’ travel habits are normalising following the pandemic, providing a strong boost to import growth between 2021 and 2022. In the period ahead, imports are projected to grow moderately owing to sluggish growth in the Norwegian economy. Import growth is underpinned by a high level of investment in mainland enterprises and petroleum activities.
Weaker growth in public demand
Growth in public demand has been weak so far in 2022 and is projected to remain weak in 2023 (Chart 3.9). High inflation pushes up public sector costs and will likely dampen public demand in 2023. Against the background of weaker cyclical developments, public demand growth is expected to increase in 2024.
Chart 3.9 Weak growth in public demand9 Public demand. Annual change. Percent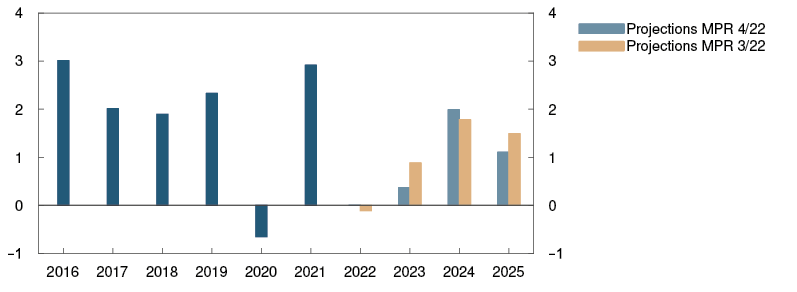
The Government’s budget agreement with the Norwegian Socialist Left Party entails somewhat higher public spending than set out in the Government’s fiscal budget proposal for 2023, but still entails a reduction in public spending next year. Government support for household electricity bills will continue, dampening the effect of high electricity prices on consumer prices. The other proposed changes in household taxes and transfers are not expected to have a material impact on income and consumption prospects, while changes in direct and indirect company taxation may to some extent dampen investment activity in the private sector. Overall, the fiscal stance appears to be broadly in line with the assumptions in the September Report.
The projections are uncertain
The Norwegian economy is slowing down, but the extent of the slowdown is uncertain. More enterprises than normal in the Regional Network, particularly in the business services sector, are uncertain about the evolution of demand ahead. Lower business sector demand may lead to a sharper fall in investment than projected in this Report. There is also uncertainty associated with households’ response to higher inflation, increased interest rates and lower house prices. It is uncertain to what extent households will draw on savings to maintain consumption when their purchasing power declines. Consumption may prove higher than projected if households save a smaller share of their income than assumed.
1 Period: May 2022 – May 2023. Growth past three months and expected growth next six months.
2 Period: 2022 Q1 – 2023 Q2. Projections from 2022 Q3 for MPR 3/22 and from 2022 Q4 for MPR 4/22 and for Norges Bank’s modelling system for short term projections. Our modelling system is based on historical relationships. It weights together empirical models based on previous forecasting properties.
3 Period: 2016 – 2025. Projections from 2022. Petroleum investment includes investment in international shipping.
4 Period: 2016 Q1 – 2025 Q4. Projections from 2022 Q4 for MPR 4/22. Projections from 2022 Q3 for MPR 3/22.
5 Period: 1993 – 2025. Projections from 2022.
6 Period: 2016 – 2025. Projections from 2022. Real house price is nominal house price deflated with CPI.
7 Period: 2016 – 2025. Projections from 2022.
8 Period: 2016 – 2025. Projections from 2022. Data for 2016–2021 from Statistics Norway’s investment survey and deflated by the price index for petroleum investment in the national accounts. The price index is projected to increase by 5,2% from 2021 to 2022 and by 2% in 2023.
9 Period: 2016 – 2025. Projections from 2022.
3.2 Labour market
A tight labour market
Unemployment is low, and the employment rate is high (Chart 3.10). Since the reopening in summer 2021, employment has increased substantially, with 98 000 more employed now than before the pandemic. In 2022 Q3, employment rose more than projected in the September Report, and preliminary figures suggest that employment continued to rise somewhat in October.
Chart 3.10 High employment rate10 Employed as a share of the population aged 15–74. Percent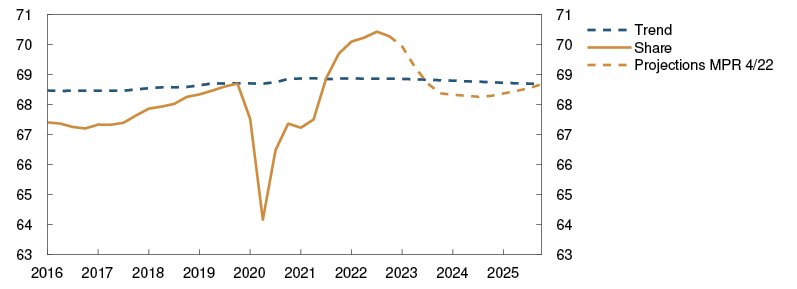
The sharp rise in employment reflects the further decline in unemployment as well as a large number of labour force entrants. Residents that were previously outside the labour force have become employed, and the number of temporary foreign workers has increased. In 2022 Q3, the number of temporary foreign workers increased further, but the rise was slightly less pronounced than projected in September.
In November, 45 700 persons were registered as fully unemployed with the Norwegian Labour and Welfare Administration (NAV). Adjusted for normal seasonal variations, the unemployment rate remained at 1.6%. This is the lowest unemployment rate since before the financial crisis in 2008 and slightly lower than projected in September. While overall unemployment has remained low, the inflow of new fully unemployed job seekers has recently increased, which may be a sign that the labour market is loosening.
Labour demand is declining from a high level
Labour shortages have eased in recent months, and in November, 39% of Regional Network contacts reported that activity was being constrained by labour shortages. This share is smaller than before summer, when over half of contacts reported labour constraints. Nevertheless, the share is still high.
Moreover, the number of job vacancies is declining from a high level (Chart 3.11). According to Statistics Norway’s sample job vacancy survey, the number of job vacancies fell in 2022 Q3. However, the number remains close to the highest level since the survey was first conducted in 2010. NAV statistics show that although the number of newly advertised vacancies is still high, the number has declined in recent months.
Chart 3.11 Labour demand has declined11 Number of job vacancies in thousands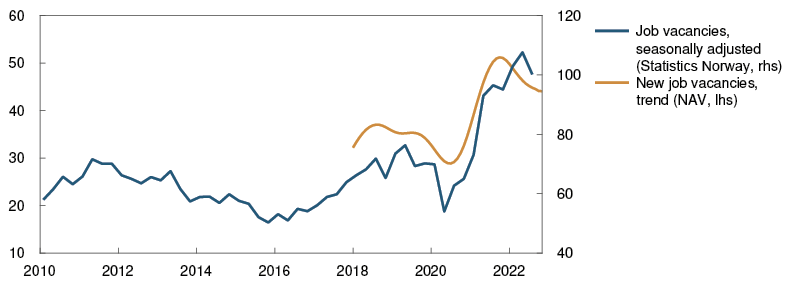
Prospects for somewhat higher unemployment
In the coming months, employment growth is projected to weaken and the number of employed to begin to decline further out. In November, Regional Network contacts reported that employment had edged up in recent months but expect broadly stable employment over the next three months. The employment outlook was weaker in November than in August in all private sectors except for oil services. Norges Bank’s Expectations Survey also points to weaker employment growth ahead and indicates that the number of employed will begin to decline further out.
The Norwegian economy is assessed to have reached its cyclical peak, which implies weaker employment developments ahead and some decline in the number of employed in the coming years (Chart 3.12). More employees are expected to return to work thereafter as economic activity picks up. In the projections, the employment rate declines somewhat in the coming years and then stays close to its pre-pandemic level (Chart 3.10).
Chart 3.12 Decline in employment ahead12 Employed. In thousands. Seasonally adjusted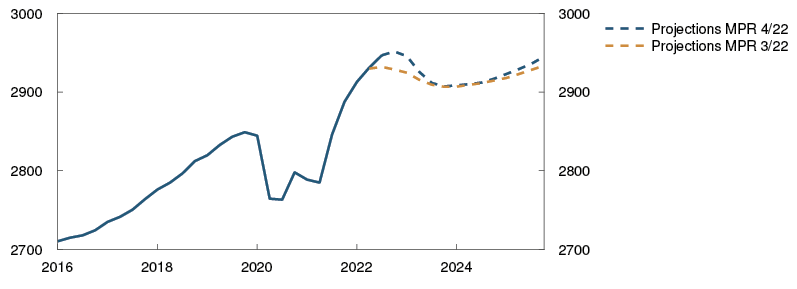
The war in Ukraine has led to a rise in the number of refugee arrivals to Norway. There are prospects that the number will increase more in both 2022 and 2023 than projected in September. Some of these refugees are expected to find a job in the coming years. The number of temporary foreign workers in Norway is also projected to edge up further.
In the projections, the unemployment rate increases gradually in the coming years, and then remains around 2.4% (Chart 3.13). This is close to the level of unemployment during the last few years prior to the pandemic.
Chart 3.13 Prospects for somewhat higher unemployment13 Registered unemployed as share of the labour force. Seasonally adjusted. Percent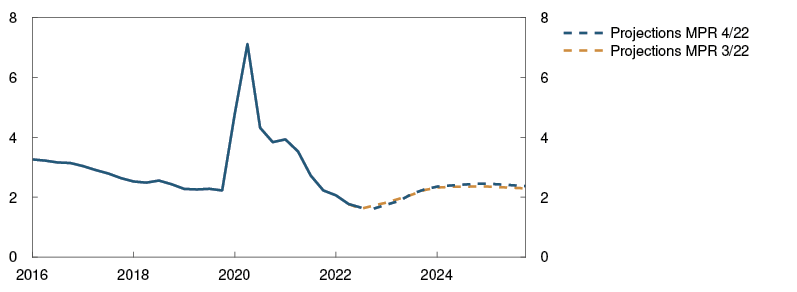
10 Period: 2016 Q1 – 2025 Q4. Projection from 2022 Q4 – 2025 Q4.
11 Period: January 2010 – November 2022. Data from January 2018 for NAV. Owing to a break in NAV’s statistics at the beginning of 2018, only data since January 2018 are included. Statistics Norway’s statistics are presented as quarterly figures, while NAV’s statistics are monthly.
12 Period: 2016 Q1 – 2025 Q4. Projections for employment from 2022 Q3 for MPR 3/22 and from 2022 Q4 for MPR 4/22.
13 Period: 2016 Q1 – 2025 Q4. Projections from 2022 Q3 for MPR 3/22 and 2022 Q4 for MPR 4/22.
Lower capacity utilisation ahead
Output is assessed to be above potential, but the output gap is now declining. The slowdown in the economy appears to occur somewhat later than expected in the September Report. Output is projected to fall below potential in the course of the latter half of 2023 and remain below potential in the following years.
The output gap is a measure of the difference between actual output (GDP) and potential output. Potential output is determined by trend productivity and trend employment. Potential output and the output gap cannot be observed and must therefore be estimated. The Bank’s output gap estimates are based on an overall assessment of various indicators and models. Particular weight is given to labour market developments.
Output is assessed to have reached potential in autumn 2021 and continued rising into 2022. Output in 2022 Q3 is assessed as broadly unchanged from Q2. In this period, unemployment fell, and employment and GDP growth were stronger than expected. At the same time, capacity problems among some Regional Network contacts also eased. Our overall assessment is that the output gap in Q3 was just above 2%, a little higher than projected in the September Report.
So far in Q4, there are signs that the output gap is declining from a high level (Chart 3.A). In November, Regional Network contacts reported a marked decline in capacity utilisation in most sectors. At the same time, labour shortages among Regional Network contacts have eased.
Chart 3.A Regional Network reports that capacity utilisation has slowed1 Percent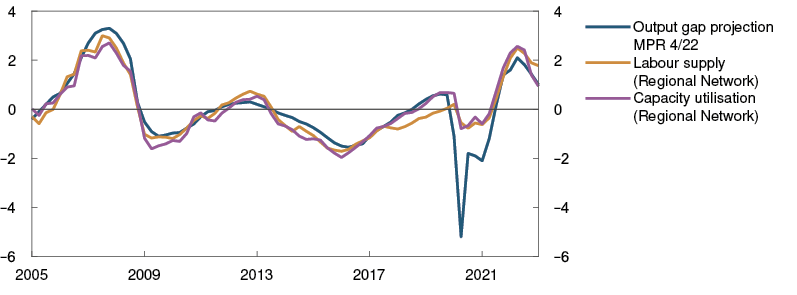
There has also been a decline in the number of job vacancies and an increase in the number of short-term unemployed, resulting in a fall in the ratio of vacancies to short-term unemployed (Chart 3.B). This may indicate an increase in unemployment ahead.
Chart 3.B Lower ratio of vacancies to short-term unemployed2 Unemployment as a percentage of the labour force. Seasonally adjusted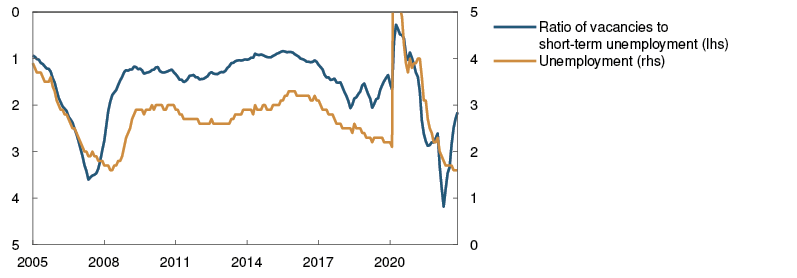
Overall, the output gap is projected to decline quickly over the coming quarters and bottom out at negative 0.8% during the latter half of 2024. Capacity utilisation in the coming years will be a little lower than envisaged in September (Chart F in "Monetary policy assessment").
An expected decline in household consumption is the main reason why demand and output are expected to be lower in the coming year. Even though capacity utilisation stops falling further out and then moves up a little, output is expected to still be below potential at the end of 2025.
Since the September Report, potential output in 2022 has been revised up. Information from the national accounts and Regional Network indicates that productivity growth will be 0.5 percentage point higher in 2022 than envisaged in September. Even though potential output in 2022 has been revised up, there are still signs that productivity growth will be weak ahead. The historical relationship between productivity in the Regional Network and the national accounts indicates that productivity growth will be weak into 2023 (Chart 3.C). In the coming years, trend productivity growth is expected to be around 0.6%.
Chart 3.C Weak productivity growth-1 Four-quarter change. Moving average. Percent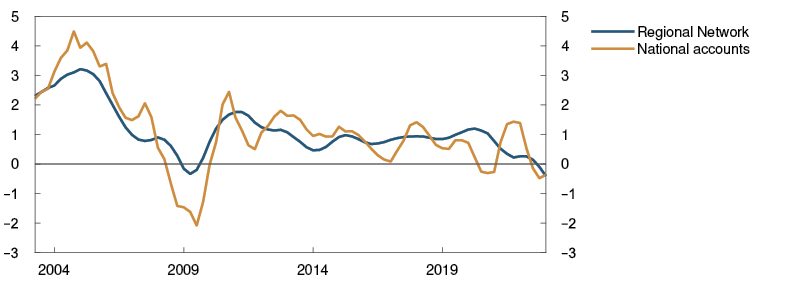
The authorities have revised up their projection for the inflow of Ukrainian refugees. In this Report it is assumed that a large number will eventually enter the labour market, so that potential output has been revised up towards the end of the projection period. Prospects for slightly fewer temporary foreign workers than projected earlier pull in the opposite direction.
1 Period: 2005 Q1 – 2023 Q1. Regional Network capacity utilisation indicators have been converted to output gaps using a simple model estimation.
2 Period: January 2005 – November 2022. Short-term unemployed are job seekers that have been unemployed for less than 26 weeks. Job vacancies comprise a NAV series trend for new job vacancies estimated by Norges Bank, Statistics Norway’s job vacancy survey and historical job vacancy statistics. See further description in Chart 3.B in MPR 2/22.
-1 Period: 2003 Q2 – 2023 Q1. Productivity growth is the difference between four-quarter change in production and four-quarter change in employment.
3.3 Prices and wages
High inflation
Consumer price inflation is now rising rapidly and has been appreciably higher than projected in the September Report. In November, the consumer price index (CPI) was 6.5% higher than one year earlier. The twelve-month change was still somewhat lower than in October. The rapid rise in prices reflects high energy and non-energy commodity prices, strong demand and elevated international price pressures. Inflation is broad-based, and both goods and services inflation have accelerated (Chart 3.14).
Chart 3.14 Broad rise in consumer prices1 CPI. Twelve-month change. Pecent. Contribution to twelve-month change. Percentage points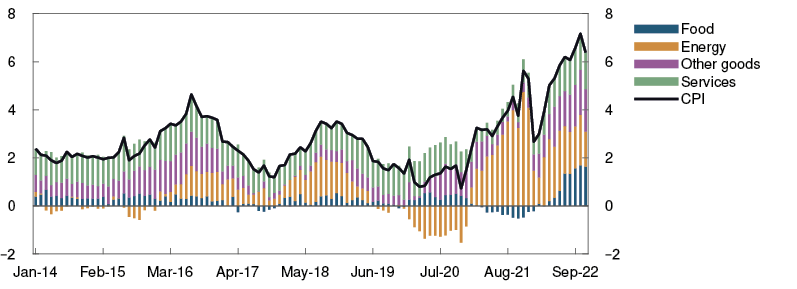
The 12-month rise in the CPI adjusted for tax changes and excluding energy products (CPI-ATE) also edged lower in November after a marked rise through the year. In November, the 12-month rise in CPI-ATE inflation was 5.7%. Other underlying inflation indicators have risen in line with CPI-ATE inflation (Chart 3.15).
Chart 3.15 Underlying inflation has moved up2 CPI and underlying inflation indicators. Twelve-month change. Percent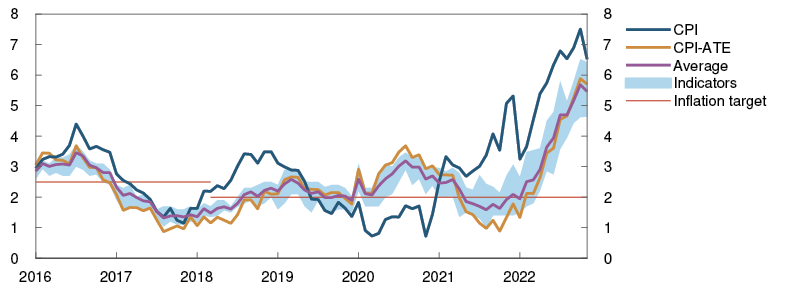
The rise in prices for both imported and domestically produced goods and services is high and faster than expected. Prices for food and non-alcoholic beverages in particular rose sharply over the past year. Prices for transport services, furniture and hotel and restaurant services have also risen rapidly. As these price components are normally not affected by the same factors, the current rapid rise in all of these prices indicates that there is a range of different factors, including prices for various intermediate goods, driving up prices right now.
Inflation expectations for the next years have increased (Chart 3.D). Inflation expectations two and five years ahead are now above the 2% target according to Norges Bank’s Expectations Survey for Q4.
Inflation is difficult to forecast
Inflation has been higher than projected for some time. This may be partly because there is little experience with the extent to which high electricity prices and freight rates affect consumer price inflation (see boxes in Monetary Policy Report 4/21 and Monetary Policy Report 3/22). At the same time, it has been a long time since prices have risen as rapidly as is currently the case. Experience from the 1980s has shown that price changes in one sector can spread more quickly to other sectors in periods of high inflation (see "Uncertainty about price dynamics when inflation is high"). If such second-round effects are now in play, various price pressures may have a more pronounced and prolonged effect on inflation today too, than has been the case in recent decades.
In the projections, inflation rises a little further and four-quarter CPI-ATE inflation picks up to 5.9% in 2023 Q1 (Chart 3.16). This is a little higher than indicated by Norges Bank’s empirically based forecasting model.
Chart 3.16 Historical relationships suggest a slower rise in inflation3 CPI-ATE. Four-quarter change. Percent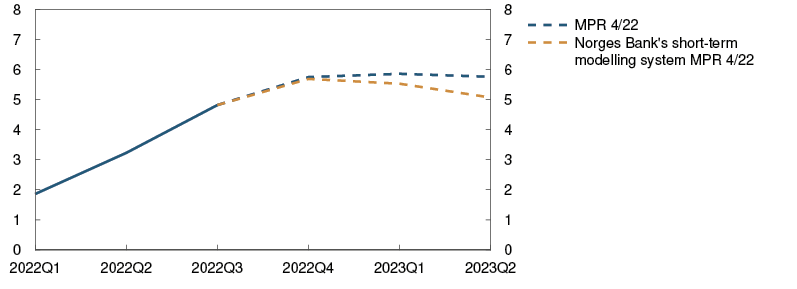
Freight rates have fallen markedly in recent months, and imported inflation is expected to moderate over the entire projection horizon in response to weaker international price pressures (Chart 3.17). Further out, lower capacity utilisation and a fall in energy prices will have a dampening effect on domestic inflation. On the other hand, higher wage growth and weak productivity growth are expected to contribute to keeping domestic inflation elevated. Overall, four-quarter CPI-ATE inflation is expected to decline gradually to 2.5% at the end of 2025. For most of next year, the projections are higher than in the September Report but are little changed for the remainder of the projection period.
Chart 3.17 Prospects for lower imported inflation4 Domestically produced goods and services and imported goods in the CPI-ATE. Four-quarter change. Percent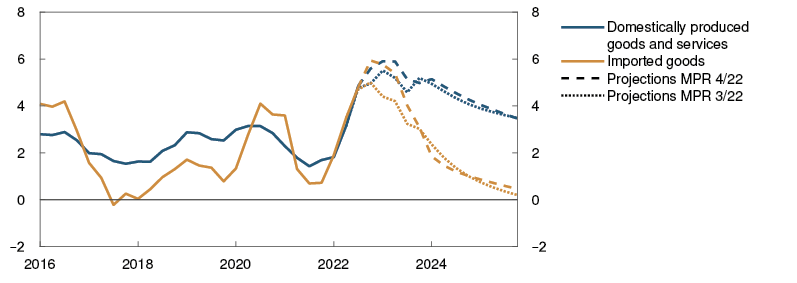
Futures prices indicate that electricity and fuel prices pull up CPI inflation through winter. Electricity prices in the CPI are also affected by a number of other factors, such as government support for electricity bills, regional price differences and choice of electricity contract. Owing to unusually large electricity price movements, the uncertainty relating to the overall effect of these prices on CPI inflation in the coming period is higher than normal.
Further out, energy prices are expected to fall markedly. Government support for household electricity bills is dampening CPI inflation. In the projections, government support for electricity bills is reduced somewhat in the summer months next year, in line with the fiscal budget proposal. Four-quarter CPI inflation is expected to remain elevated until 2023 Q1, declining gradually thereafter to 2.4% at the end of 2025.
Higher wage growth in 2023
Wage growth appears to be higher in 2022 than in 2021, partly owing to a very tight labour market. This year’s wage norm rose considerably from 2021 (Chart 3.18). This reflects, among other things, an increase in manufacturing’s ability to pay wages thanks to higher export prices and improved productivity through 2021. Register-based wage statistics indicate that wage growth in the first three quarters of 2022 may have been slightly lower than projected in the September Report, although they still suggest that annual wage growth is on the rise. Many new labour market entrants earn lower-than-average wages. It is assumed that this will in isolation pull down the average wage level somewhat in 2022. Wage growth is projected at 3.9% in 2022.
Chart 3.18 Higher wage growth expected5 Annual wage growth. Percent
According to Norges Bank’s Regional Network and Expectations Survey, wage growth expectations are higher in 2023 than in 2022 (Chart 3.18). The social partners’ wage growth expectations for 2023 have increased since September.
High inflation and continued tight labour market conditions will likely lead to a further rise in wage growth in 2023. Weak productivity growth and prospects for weaker profitability (Chart 3.19) are likely to dampen the rise. Wage growth is projected to rise to 4.7% in 2023, which is close to the social partners’ wage expectations.
Chart 3.19 Weakened business profitability6 Change in operating margins according to the Regional Network and the Expectations Survey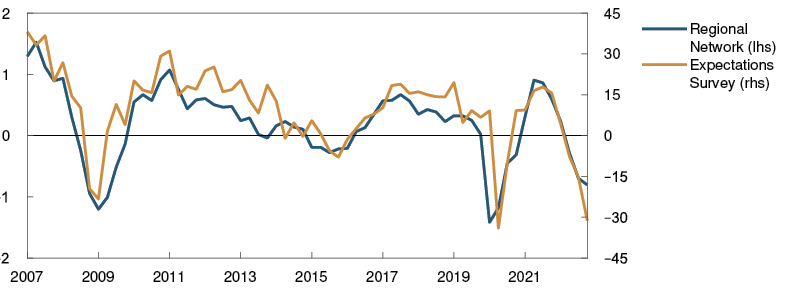
Norway’s terms of trade have improved considerably in 2022, primarily reflecting high gas prices. A little further out in the projection period, increased petroleum revenues are expected to boost activity and lift profitability for mainland firms. In isolation, this points to higher wage growth. Wage growth is still expected to decline from 2024 owing to lower inflation and somewhat higher unemployment. The projection for 2023 has been revised up a little, while projections for the following years are somewhat lower than in the September Report.
There are prospects for a sharp fall in real wages in 2022, after remaining unchanged in 2021 (Chart 3.20). Real wages are expected to remain broadly unchanged in 2023. In 2024 and 2025, real wages are expected to rise again. Overall, the real wage projections for the years 2022 to 2025 are lower than in the September Report.
Chart 3.20 Weak developments in real wages7 Annual change. Percent
Unusually high uncertainty
Developments in price and wage inflation ahead are more uncertain than normal. It is still uncertain how different forces affecting inflation will evolve and impact prices. Inflationary pressures over the past year have been unusually volatile, and the absence of experience with comparable historical episodes makes it difficult to estimate their effect on consumer prices.
At the same time, there is substantial uncertainty about the effects of high inflation on wage and price formation. Inflation expectations for the coming years have increased lately. There is a risk that households and firms will come to expect high inflation and adjust their price and wage setting behaviour accordingly. Inflation dynamics may change more than currently assumed, in which case inflation could stay high for longer, making it difficult to bring it down again.
Inflation may also fall faster and prove lower than currently projected. Energy prices and freight rates, for example, have declined and may also fall faster ahead than currently envisaged. This may lead to weaker external price pressures and a faster decline in inflation than expected.
The effects of higher costs on firms’ prices and wage formation are also uncertain. In the projections for price and wage inflation, higher costs are shared between employers and employees, lowering both business profitability and real wage growth. How those costs are distributed may differ from that envisaged, which could result in a different path for price and wage inflation than expected.
1 Period: January 2014 – November 2022.
2 Period: January 2016 – November 2022. CPI-ATE: CPI adjusted for tax changes and excluding energy products. Average: Average value of 12 -month change for other underlying inflation indicators (CPIM, CPIXE, 20 percent trimmed mean, weighted median, CPI-XV and CPI-common) and CPI-ATE. Indicators: Highest and lowest 12-month change for other underlying inflation indicators.
3 Period: 2022 Q1 – 2023 Q2. CPI-ATE: CPI adjusted for tax changes and excluding energy products. Projections from 2022 Q4. Our modelling system for short term projections is based on historical relationships. It weights together empirical models based on previous forecasting properties.
4 Period: 2016 Q1 – 2025 Q4. CPI-ATE: CPI adjusted for tax changes and excluding energy products. Projections from 2022 Q3 in MPR 3/22 and 2022 Q4 in MPR 4/22.
5 Period: 2016 – 2023. Annual wages: Actual wage growth from Statistics Norway. Norges Bank’s projections from 2022. Norges Bank’s Expectations Survey: Social partners’ wage growth expectations for the current year as measured by Norges Bank’s Expectations Survey in Q4 each year. Regional Network survey: Expected annual wage growth for 2022 as reported in Q4 each year.
6 Period: 2007 Q1 – 2022 Q4. Regional Network: Change in operating margins over the past three months compared with same period a year earlier. Index from –5 (large fall) to +5 (large rise). Expectations Survey: Profitability next 12 months. Share of enterprises that report prospects for improved profitability minus the share that report prospects for lower profitability.
7 Period: 2016 – 2025. Projections from 2022. Real wages: Nominal annual wage growth adjusted for CPI inflation.
Uncertainty about price dynamics when inflation is high
Inflation has risen sharply over the past year and has been higher than expected. At the same time, inflation expectations have also risen considerably since mid-2021 (Chart 3.D).
Chart 3.D Inflation expectations have risen1 Inflation expectations. Percent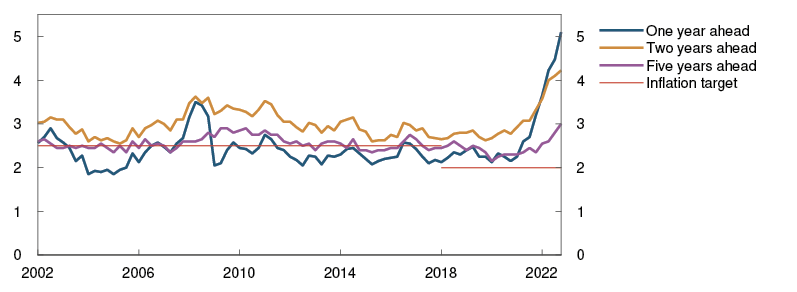
We have little recent experience with how inflation dynamics may change when inflation is high and inflation expectations are rising. In periods of low and stable inflation, changes in inflation expectations are not found to have a substantial impact on inflation. We therefore have little information for projecting how changes in inflation expectations affect inflation in the current context. The interaction between expectations and actual inflation is one of several uncertainty factors associated with inflation dynamics when inflation is high.
There is also uncertainty related to the direct and indirect effects of higher electricity prices and stronger international price pressures. When price disturbances are small and transient, firms can largely choose to let increased costs temporarily reduce margins. When cost shocks are large and assumed to be more persistent, firms may instead find it necessary to increase prices to avoid negative margins. This leads to a type of non-linearity that our modelling system is able to capture only to a small degree.
In addition, other changes in inflation dynamics may have contributed to higher-than-expected inflation. For example, it is possible that substantial price increases for individual products that cannot be traced to general conditions can spread more easily to other goods and services when inflation is high than when it is low. In an analysis of US data, the Bank for International Settlements (BIS) finds that second-round effects have featured more prominently in periods of high inflation.2 This may be because price increases are less likely to be viewed as transient when inflation is high than when it is low.
The last time Norway experienced high inflation was in the 1980s. By comparing the pass-through of sizeable, unexpected changes in some price components to inflation in the 1980s and in the following low-inflation period, we can assess whether there are similar traces of this type of spillover across prices in the Norwegian data.
To do this, we look at sizeable price changes in specific price components by estimating the portion of the monthly increase in CPI subcomponents that are not correlated with common factors for consumer prices. The common factors are meant to sum up fundamental factors that normally affect all prices. We look at the price changes in each subcomponent that are positive and large compared with earlier movements in the same component. We are then able to estimate the correlation between a large price increase in one CPI subcomponent and movements in core inflation one year ahead.-1 This relationship is seen as a measure of spillover effects. We apply this method to two time periods, 1980–1992 and 1993–2019, to assess the difference in price spillover effects in both high-inflation and low-inflation periods.
We find that substantial price increases in individual components were largely transient during the low-inflation period. In the 1980s, the pass-through to core inflation of these types of price increases was stronger and more persistent. This suggests that when inflation is already high, a sharp rise in prices in some areas is more likely to spread to other consumer prices.
Chart 3.E shows developments in relative price increases estimated for the period to November 2022. Since the end of 2021, there has been a marked rise in the share of CPI subcomponents showing substantial increases. Inflation is now high, and if overall inflation is now more sensitive to relative price changes than in recent decades, inflation may be more persistent than our empirical models indicate. Some price spillover effects are thought to be contributing to pulling up inflation, but it is uncertain how strong these effects are.
Chart 3.E Rise in the share of CPI subcomponents showing substantial increases-1 Share of CPI subcomponents. Twelve-month moving average. Percent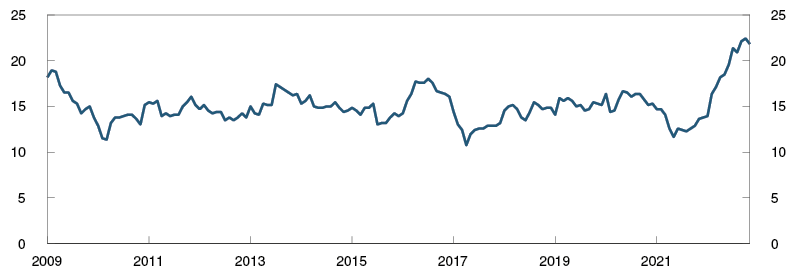
1 Period: 2002 Q1 – 2022 Q4. Inflation expectations two years ahead is the average of expectations among households, business leaders, economists and social partners. Inflation expectations five years ahead is the average of expectations among economists and social partners.
2 See Borio, Disyatat, Xia and Zakrajsek (2021): “Second-round effects feature less prominently in inflation dynamics”, BIS Quarterly Review, September 2021, pp 23–24.
-1 Statistics Norway publishes CPI-ATE statistics from December 2002. Prior to this, an estimated CPI-ATE series is used.
-1 Period: January 2009 – November 2022. Large, relative price increases estimated over 55 CPI price components.
4 Monetary policy analysis
Norges Bank’s Monetary Policy and Financial Stability Committee decided to raise the policy rate from 2.5% to 2.75% at its meeting on 14 December. Based on the Committee’s current assessment of the outlook and balance of risks, the policy rate will most likely be raised further in 2023 Q1. The projections are highly uncertain. If the outlook or the Committee’s assessment of economic relationships changes, the policy rate path will also be adjusted.
Inflation is markedly above the target. The policy rate has been raised to bring inflation down, but it will take time before inflation approaches the 2% target. After having passed its cyclical peak, the Norwegian economy is expected to slow ahead.
4.1 Objectives and recent developments
The primary objective of monetary policy is low and stable inflation. The operational target is annual consumer price inflation of close to 2% over time. From the introduction of the inflation target in 2001 to March 2018, the inflation target was 2.5%. A moving average of the annual rise in consumer prices has been close to 2% over the past 30 years. Inflation has surged recently, and CPI inflation has been at its highest since the end of the 1980s (Chart 4.1).
Chart 4.1 Inflation far above the target1 CPI. Four-quarter change. Percent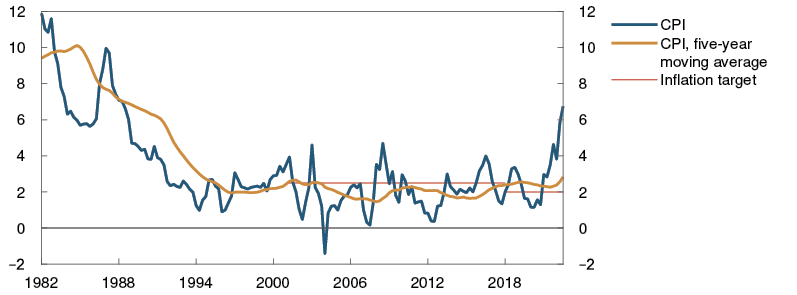
Inflation targeting shall be forward-looking and flexible so that it can contribute to high and stable output and employment and to countering the build-up of financial imbalances. The monetary policy strategy is discussed further in "Norges Bank’s monetary policy strategy".
The policy rate has been raised in several steps over the past year to contribute to stabilising inflation around the target. The policy rate was increased to 2.5% in November in line with the projections in the September 2022 Monetary Policy Report.
1 Period: 1982 Q1 – 2022 Q3.
4.2 New information and new assessments
Model-based interpretation of new information
To shed light on how the effects of new information influence the economic outlook, new information and assessments of the economic situation are incorporated into the modelling system, while conditioning on the policy rate path in the September Report. In this exercise, the main focus is on the outlook for the output gap and inflation, two important considerations to which the Committee gives weight in the conduct of monetary policy.
Underlying inflation has been higher than envisaged in September and inflation is also expected to be higher in the coming period. Further out, weaker prospects for the real economy and lower wage growth in 2024 and 2025 will pull down inflation. In the exercise with an unchanged rate path, inflation becomes higher than projected in September at the start of the projection period but shows little change further out (Chart 4.2).
Chart 4.2 Higher inflation in the near term2 CPI-ATE. Projections conditioned on new information concerning economic developments and the policy rate forecast in MPR 3/22. Four-quarter change. Percent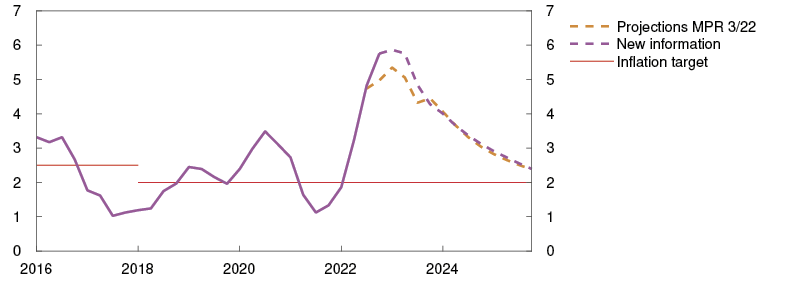
Capacity utilisation in Q4 is expected to be higher than projected in the September Report but is expected to fall faster ahead. Household real disposable income is lower than projected and the slowdown in the housing market somewhat more pronounced. This suggests a stronger decline in consumption than projected in September. Lower projections for petroleum investment also push down capacity utilisation. Overall, capacity utilisation in this exercise is lower than projected in the September Report in 2023 and over the remainder of the projection period (Chart 4.3).
Chart 4.3 Prospects for lower capacity utilisation3 Estimated output gap. Conditioned on new information concerning economic developments and the policy rate forecast in MPR 3/22. Percent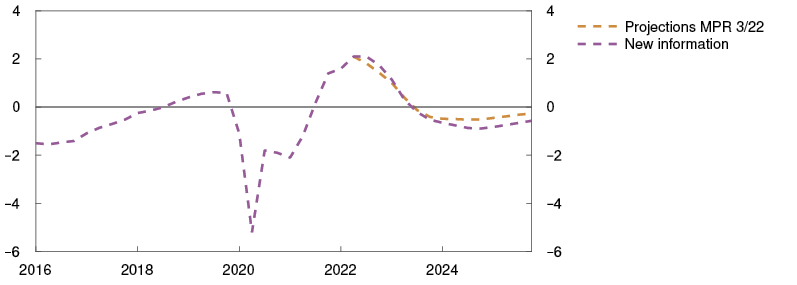
The model-based interpretation of new information shows the trade-offs facing the Committee when determining the appropriate monetary stance. The inflation outlook indicates a need for a tighter monetary policy than envisaged in September. A higher estimate of capacity utilisation in Q4 pulls in the same direction. On the other hand, lower capacity utilisation ahead implies in isolation a lower policy rate.
A simple rule indicates a higher policy rate
An estimated simple rule based on Norges Bank’s previous policy rate setting summarises the historical pattern of monetary policy reactions (see Monetary Policy Report 2/22).
Given the upward adjustment of the inflation projection, the simple rule now indicates a higher policy rate in the coming quarters than implied by the rule in the September Report (Chart 4.4).
Chart 4.4 A simple rule implies a higher policy rate4 Money market rate. Percent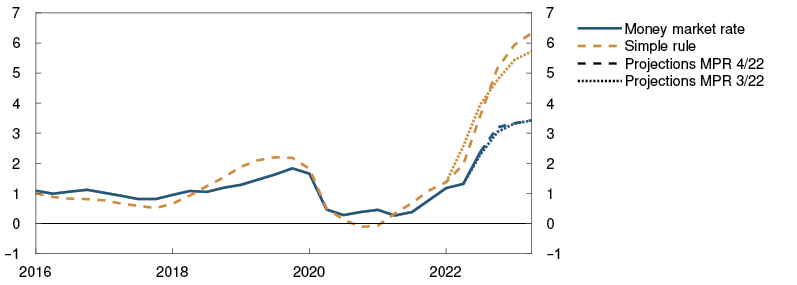
Forward rates indicate a lower policy rate path
Market policy rate expectations further out can be estimated on the basis of market rates. These policy rate expectations can provide an indication of how market participants have interpreted new information and how they believe Norges Bank will respond.
Since the September Report, market policy rate expectations have fallen for the entire projection period, and policy rate expectations for the coming years are lower than the rate forecast in the current and previous Report (Chart 4.5).
2 Period: 2016 Q1 – 2025 Q4. Projections from 2022 Q3 for MPR 3/22 and from 2022 Q4 for MPR 4/22. CPI-ATE: CPI adjusted for tax changes and excluding energy products.
3 Period: 2016 Q1 – 2025 Q4. The output gap measures the percentage deviation between mainland GDP and projected potential mainland GDP.
4 Period: 2016 Q1 – 2023 Q2. Projections from 2022 Q3 for MPR 3/22 and 2022 Q4 for MPR 4/22.
4.3 Monetary policy stance and drivers behind the changes in the policy rate path
As in the September Report, the policy rate forecast indicates a policy rate of around 3% in 2023 (Chart 4.5). From the latter half of 2024, the policy rate is projected to fall gradually. Towards the end of the projection period, the policy rate is projected to be around 2.4%, a little lower than the September projection.
Chart 4.5 Market policy rate expectations have fallen5 Policy rate. Percent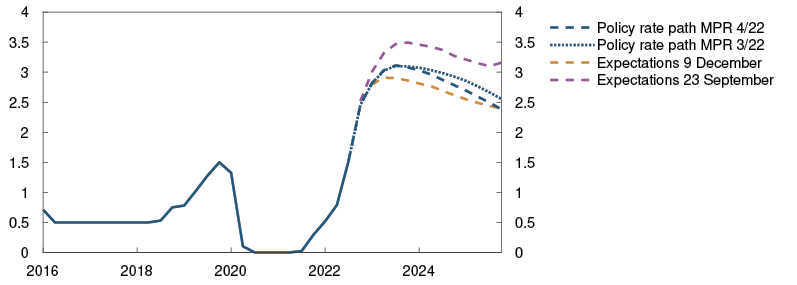
Monetary policy influences the economy through both nominal and real interest rates. A tighter monetary stance is expected to have dampening effect on the economy throughout the projection period.
The rapid increase in the nominal interest rate level restrains economic activity by reducing household real disposable income. Many households will have to cover higher interest payments by lowering consumption. This applies in particular to those unable to draw on savings or increase borrowing.
The projection for the real money market interest rate also indicates that the monetary stance has a contractionary effect in the coming years since the real interest rate is generally higher than what is estimated to be its neutral level of close to zero. The estimate of the real money market rate is a little higher than projected in September for the coming six months (Chart 4.6) and is lower thereafter, in line with a slightly lower policy rate path further out in the projection period.
Chart 4.6 Slightly lower expected real interest rate6 Expected real interest rates four-quarters ahead. Percent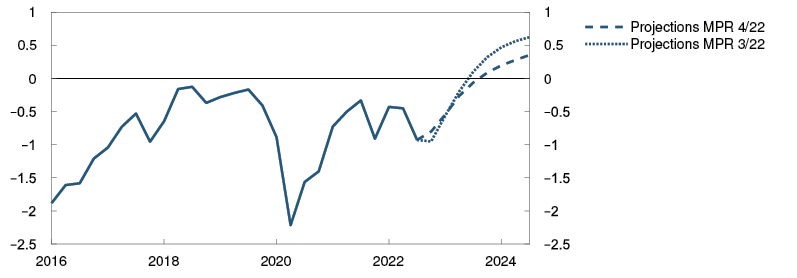
If the economic outlook, the balance of risks or the assessment of the functioning of the economy changes, the policy rate may prove to be different from the one now indicated by the policy rate path. It is particularly challenging to project inflation and capacity utilisation in the present environment, and the Bank’s forecasts have been revised substantially over the past year.
Estimation of the expected real interest rate
The real interest rate is important for understanding the monetary policy stance. The expected real interest rate, defined as the expected interest rate level over a period less expected inflation over the same period expresses the real cost of a loan. Real interest rates can vary based on the nominal rate that is used, the relevant rate of inflation and the length of the observation period.
Chart 4.6 shows the expected real interest rate four quarters ahead, based on our projections for the money market rate and CPI-ATE inflation.1 This does not provide an indisputable answer to what the expected real interest rate for various agents is, but constitutes a useful starting point as it coincides with the expected real interest rate in our macroeconomic model NEMO.
In previous reports, we have shown a different real interest rate estimation, where the real interest rate was defined as the money market rate less a moving average of four-quarter CPI-ATE inflation. However, this definition resulted in large movements in real interest rates owing to changes in inflation that have already occurred and did not necessarily provide a reliable indication of inflation expectations. In future, we will use the expected real interest rate, as presented in Chart 4.6.
1 For the current quarter and in the projection period, the expected real interest rate is estimated on the basis of the projections in this Report. For all earlier periods, we show the expected real interest rate in “real time”, ie estimated with the aid of the most up-to-date projections at each point in time.
Decomposition of changes in the policy rate path
The Committee’s reasoning for the policy rate decision and forward guidance on the policy rate are presented in the monetary policy assessment. The decomposition shown in Chart 4.7 illustrates some of the main drivers behind the change in the policy rate path from our main model NEMO since the September Report. The bars show contributions to changes in the rate path from our model, and the broken line shows the sum of the bars. The solid line shows the actual change in the rate path.
Chart 4.7 The decomposition indicates small changes in the policy rate path7 Cumulative contributions. Percentage points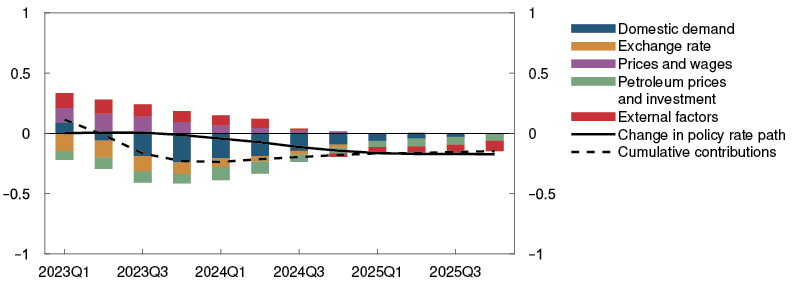
Inflation has been higher than projected in the September Report, which pulls up inflation in the near term. Factors relating to prices and wages pull up the model-based path in the first part of the projection period (purple bars).
In the near term, capacity utilisation is assessed to be somewhat higher than expected earlier, but weaker real household income pushes down consumption growth ahead, At the same time, house prices are projected to fall more sharply ahead, leading to lower housing market activity. Overall, domestic demand pulls up the model-based path in the near term and then pulls it down (dark blue bars).
Oil and gas futures prices have fallen since the September Report, especially for the coming year. Further out, petroleum prices are little changed. The projections for petroleum investment are lower than in September, owing to the postponement or cancellation of some planned development projects. Petroleum prices and investment therefore pull down the model-based path (green bars).
Policy rates among trading partners have risen since the September Report in pace with increased inflation. The market’s policy rate expectations for the coming period have risen slightly since the September Report. Economic growth among trading partners has been revised down for the years ahead. Overall, external factors pull up the model-based path in the near term but pull it down towards the end of the forecast horizon (red bars).
The krone has moved broadly as projected in September. According to our modelling system, developments in the interest rate differential against other countries and the fall in petroleum prices should have pulled the krone in a weaker direction. A stronger exchange rate than implied by the model drivers pull the model-based path down somewhat (orange bars).
Overall, the model analysis implies a slightly higher policy rate in the next quarter than projected in the September Report and a slightly lower policy rate from mid-2023.
5 Period: 2016 Q1 – 2025 Q4. Projections from 9 December 2022 for MPR 4/22 and from 16 September 2022 for MPR 3/22.
Expectations 9 December 2022 for MPR 4/22 and 23 September 2022 for MPR 3/22.
6 Period: 2016 Q1 – 2024 Q3. Projections from 2022 Q3. Expected real interest rate is projected money market rate the next four quarters minus expected growth in CPI-ATE over the same period. For Q4 and in the projection period, expected real interest rate is desimated based on the projections in this report. For all earlier periods, the expected real interest rate is estimated with the aid of the most up-to-date Monetary Policy Report at each point in time.
7 Period: 2023 Q1 – 2025 Q4. Projections. The contributions are based on model estimates from the NEMO model, but there is no mechanistic link between news and changes in the bars. The effects of news feed through with a lag and the interaction between economic variables may result in a reversal of the effects over time. In addition, projections for the near term may entail different signs at different times. The effect on the rate path is therefore shown most clearly by the cumulative contributions.
Norges Bank’s monetary policy strategy
The Bank’s monetary policy strategy describes the Committee’s interpretation of the monetary policy mandate and provides a framework for the Committee’s assessment of how monetary policy will respond to different shocks. The strategy is summarised below, and the full text is published on Norges Bank’s website.
The operational target of monetary policy is annual consumer price inflation of close to 2% over time. Inflation targeting shall be forward-looking and flexible so that it can contribute to high and stable output and employment and to countering the build-up of financial imbalances.
Low and stable inflation
When setting the policy rate, Norges Bank aims to stabilise inflation, as measured by the annual rise in the consumer price index (CPI), around the 2% target. Provided there is confidence in low and stable inflation, variations in inflation around the target are not likely to engender any significant economic costs. How quickly the Bank seeks to return inflation to target will depend on the shocks that have occurred and whether there are conflicts between achieving the target and other monetary policy considerations. In interest rate setting, the Bank gives weight to avoiding large and persistent deviations from the inflation target, whether above or below the target.
High and stable output and employment
Monetary policy can contribute to stabilising output and employment around the highest level that is consistent with price stability over time.
The economic costs of cyclical fluctuations are asymmetrical. High unemployment involves direct costs for both society and those unable to find employment. Very low unemployment, on the other hand, does not involve any direct costs, but only indirect costs potentially in the form of excessively high wage and price inflation. The Bank will therefore not aim to quickly close a positive output gap as long as there are prospects that inflation will remain within a range close to 2% and there are no signs of financial imbalances accumulating.
By preventing downturns from becoming deep and protracted, monetary policy can contribute to keeping unemployment from becoming entrenched at a high level so that the average level of employment over time is as high as possible.
Mitigating the build-up of financial imbalances
If there are signs that financial imbalances are building up, the consideration of maintaining high and stable output and employment may, in some situations, suggest keeping the policy rate somewhat higher than otherwise. This can to some extent mitigate the risk of a severe downturn further out. Nevertheless, the regulation and supervision of financial institutions are the most important tools for cushioning shocks to the financial system.
Response pattern
The policy rate influences inflation and the real economy with a lag, and the effects are uncertain. To reduce the risk of monetary policy contributing to economic instability, Norges Bank will normally respond less forcefully to shocks than if there had not been uncertainty about the transmission of monetary policy. Furthermore, the policy rate is normally changed gradually to make monetary policy more predictable and to reduce the risk of undesirable financial market volatility and unexpected reactions of households and firms. In situations where the risk of particularly adverse outcomes is pronounced, or if there is no longer confidence that inflation will remain low and stable, it may be appropriate to react more forcefully than normal in interest rate setting.
5 Decision basis for the countercyclical capital buffer
Commercial property prices have risen substantially in recent years, and many households are highly indebted. Household credit growth has slowed in autumn, while corporate credit growth has remained elevated. At the same time, residential and commercial property prices have fallen. Further ahead, property prices are expected to continue to fall and credit growth to slow. Creditworthy households and firms appear to have ample access to credit, even though there are some signs of tighter bank credit standards.
Norwegian banks satisfy the capital requirements and are highly profitable. The countercyclical capital buffer rate of 2.5% helps to ensure that banks remain resilient so that they can perform their tasks effectively, also in the event of economic downturns. Norges Bank’s Monetary Policy and Financial Stability Committee has decided to keep the countercyclical capital buffer rate at 2.5%.
Change of timing of decisions on the countercyclical capital buffer
From 2023, Norges Bank will publish Financial Stability Report twice a year (in May and November). At the same time, decisions on the countercyclical capital buffer will be made at the monetary policy meetings in January, May, August and November. This means that from 2023, the assessment of, and the decision basis for, the countercyclical capital buffer will not be a part of Monetary Policy Report. The next decision on the countercyclical capital buffer will be published on 19 January, together with the policy rate decision.
Framework for decisions on the countercyclical capital buffer
Decisions on the level of the countercyclical capital buffer are based on assessments of four main areas: (i) cyclical vulnerabilities, (ii) access to credit, (iii) banks’ capacity to absorb losses, and (iv) effects of a change in the rate on banks and the economy. See Norges Bank Papers 4/2022 for more information about Norges Bank’s framework. An updated set of charts with all the indicators included in the framework is published on Norges Bank’s website.
5.1 Access to credit
Creditworthy households appear to have ample access to credit. However, there are some signs of tighter bank credit standards. The banks in Norges Bank’s October Survey of Bank Lending reported that they expected to tighten credit standards for households slightly in 2022 Q4.
The framework for banks’ credit standards for households are regulated in the Lending Regulation. The Ministry of Finance has recently decided to retain the Lending Regulation but is changing, among other things, the requirement relating to the maximum rise in interest rates borrowers must be able to tolerate.1 This may increase the number of people granted a mortgage without breaching the regulatory requirements.
Creditworthy firms also appear to have ample access to credit. In the lending survey, banks as a whole expected no change in corporate credit standards. Some banks, however, reported stricter equity and debt servicing requirements for new commercial real estate (CRE) loans. Most banks also reported increased margins on new CRE loans.
Risk premiums on new corporate bond issues have risen markedly over the past year, particularly for CRE firms. The rise in risk premiums has reduced bond issuance.
1 See Ministry of Finance press release of 9 December 2022 (in Norwegian only).
5.2 Cyclical vulnerabilities and risks in the financial system
Experience shows that economic downturns are usually amplified if they follow a period of sharp rises in credit and asset prices. Partly owing to low interest rates, property prices rose sharply during the pandemic, and growth in household debt accelerated. In autumn, property prices fell, and growth in household debt slowed. On the whole, the assessment of cyclical vulnerabilities in the financial system is approximately the same as before the pandemic. Property prices are expected to decline ahead, and credit growth to slow further, which may mitigate financial system vulnerabilities further out.
Spillovers in both Europe and globally from the ongoing war in Ukraine and the after-effects of the Covid-19 pandemic are considerable. High inflation, higher interest rates and weaker growth prospects have resulted in considerable financial market volatility and increased the risk of an economic downturn. This entails a greater risk of financial vulnerabilities materialising, which could amplify a downturn and increase bank losses. For a further discussion of the financial stability outlook, see Financial Stability Report 2022.
Rising household interest burdens
Household credit growth has moved down gradually over the past year and a half, reflecting more moderate house price developments and lower housing market turnover, and growth has been a little lower in recent months than projected in the September Report. Household credit growth is expected to decline gradually ahead on the back of higher lending rates and lower house prices (Chart 5.1 and Annex Table 3).
Chart 5.1 Lower credit growth ahead2
Four-quarter change. Percent
Household debt-to-income (DTI) ratios have risen substantially over a long period (Chart 5.2). High income growth, especially in the form of increased dividend income, contributed to the decline in DTI ratios towards the end of 2021. In the projections, DTI ratios increase slightly towards the end of 2023 before moving lower. Furthermore, households will have to spend a larger share of income on interest payments ahead owing to higher lending rates. The interest burden is projected to increase from about 5% in 2022 Q3 to about 8% at 2023 Q3, edging down thereafter. Household debt service ratios, which include both interest and estimated principal payments, are expected to rise to a historically high level. For households with amortising mortgages, principal payments will be reduced when interest rates rise, resulting in a somewhat smaller increase in household debt service ratios than the increase in the interest burden. In addition, many households have the option of deferring principal repayments. In autumn, some banks have reported that use of interest-only periods increased somewhat.
Chart 5.2 Rising household interest burden3
Percent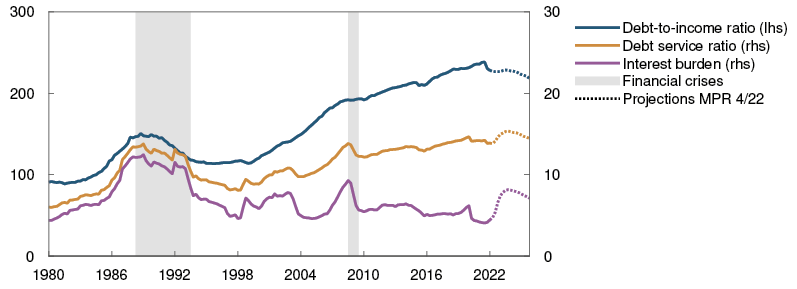
Norwegian households are now facing increased expenses for interest payments, food and electricity, for example. An analysis in Financial Stability Report 2022 shows that most households are nevertheless able to service their debt. Only between 2% and 3% of homeowner debt is held by households that may have difficulties covering normal expenses and expected higher interest payments with available income and assets. However, many more households will have to tighten consumption. Next year, lower household consumption is expected to weigh down on mainland economic activity (see further discussion in Section 3). The analysis also shows that in a scenario with, for example, high interest rates and a sharp fall in house prices, bank losses may rise owing to household debt defaults. In such a situation, many households may have to cut consumption substantially. This may weaken firms’ earnings and thus their debt-servicing capacity, leading in turn to a further increase in bank losses. This may pose a threat to financial stability.
Household sector vulnerabilities
Many households are highly indebted, and house prices have risen substantially in recent years. These are key household sector vulnerabilities (see discussion in Financial Stability Report 2022). Household debt is dominated by residential mortgage loans, and debt developments are closely associated with house price developments. A sharp and abrupt fall in house prices will therefore reduce housing wealth for many households.
Periods of persistently high house price inflation and credit growth increase household sector vulnerabilities. If house prices and household debt rise faster than incomes, households become more vulnerable to income loss and higher interest rates.
High corporate credit growth
Growth in corporate credit from domestic sources has increased in 2022 and has been higher than expected (Chart 5.1). The increase is primarily attributable to an increase in bank lending, particularly to manufacturing, services and the CRE sector, which likely reflects higher investment. In line with the investment projections, corporate credit growth is expected to decline next year and stabilise at a lower level. See Section 3 for a further discussion of business investment.
The housing market has turned
House prices rose markedly in many countries during the pandemic. House prices have recently fallen, and central banks in many countries expect a further fall.
House prices in Norway have also risen substantially in recent years (Chart 5.3). High demand and a low stock of unsold homes underpinned house price inflation at the beginning of 2022. In the course of summer, house price inflation slowed and house prices fell in autumn. The fall in prices has been more pronounced than expected in the September Report. In recent months, many homes have been listed for sale, and housing market turnover has been slightly lower than normal (Chart 5.4). This has resulted in a marked rise in the number of unsold existing homes, which may have been amplified by changes in households’ house price expectations. Surveys through autumn show that a growing number of households expect falling house prices ahead. This may have brought forward home sales and postponed home purchases, which may amplify the fall in house prices in the near term.
Chart 5.3 House prices have begun to fall4
Percent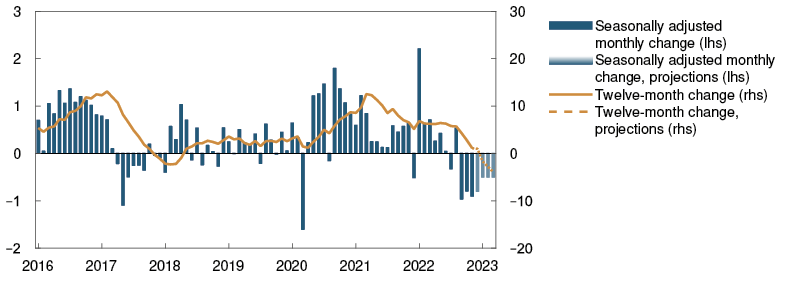
Chart 5.4 Increase in the stock of unsold existing homes5
Number of existing homes. In thousands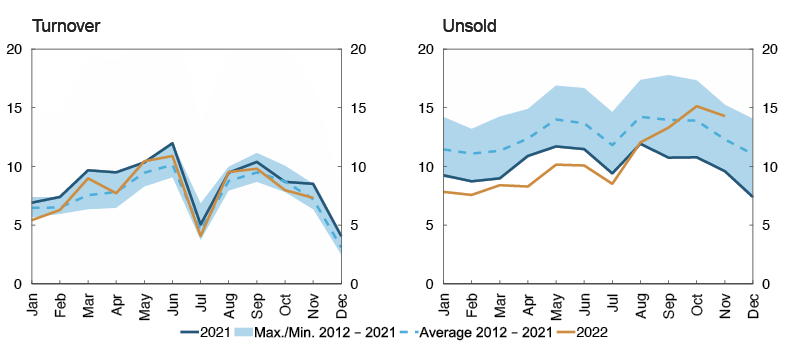
New home sales have been low in summer and autumn, reflecting the cooling of the market for existing homes and higher construction costs. Lower prices for existing homes and the low level of new home sales will likely dampen residential construction activity ahead (see also Section 3). Residential construction activity over the past three years has been lower than household formation and is expected to stay lower in the coming years.
The housing market correction has been somewhat more pronounced than envisaged in September. House prices are expected to fall by about 6% between the peak in August 2022 and autumn 2023 (Chart 5.5). In the projections, house prices in autumn 2023 are still about 12% higher than before the pandemic. The fall in house prices primarily reflects higher lending rates. A somewhat sharper fall in house prices is projected in the period ahead than in the September Report, partly owing to the large stock of unsold existing homes and signs of changes in households’ house price expectations. On the other hand, less stringent debt servicing requirements in the Lending Regulation in isolation pull up the projections a little. House price inflation is expected to pick up further out in the projection period.
Chart 5.5 Further fall in house prices expected6
Four-quarter change. Percent
The forecast for house prices is more uncertain than normal owing to uncertainty about macroeconomic developments and households’ response to higher interest rates. For example, housing demand may be more sensitive to interest rate increases than assumed in this Report. Changes in house price expectations may also result in a sharper fall in house prices than projected. A fairly low level of residential construction, however, is helping to mitigate the risk of a sharper fall in house prices.
Decline in commercial property prices
Commercial property prices in Norway and in many other countries have risen substantially in recent years. Selling prices are calculated as rents divided by yield. The rise in selling prices in Norway reflects both higher rents and a lower yield. Over the past year, selling prices have been driven up by a substantial rise in rents.
In 2022 Q3, rents rose markedly, and the yield rose sharply according to the price statistics for prime office space in Oslo. Overall, selling prices edged down (Chart 5.6). A more moderate rise in rents is expected over the next year, reflecting slower growth in the Norwegian economy. The yield depends on developments in long-term interest rates and risk premiums. Despite the recent rise in the yield in Oslo and other European cities, the spread between the yield and long-term interest rates is still narrow. A gradual rise in the yield is expected ahead. Overall, the projections for rents and yields indicate that CRE selling prices will decline ahead, and selling prices are projected to return to pre-pandemic levels over the next year. Projections for selling prices have been revised down a little since the September Report.
Chart 5.6 Commercial property prices are expected to decline7
Estimated selling prices. In thousands of NOK per square metre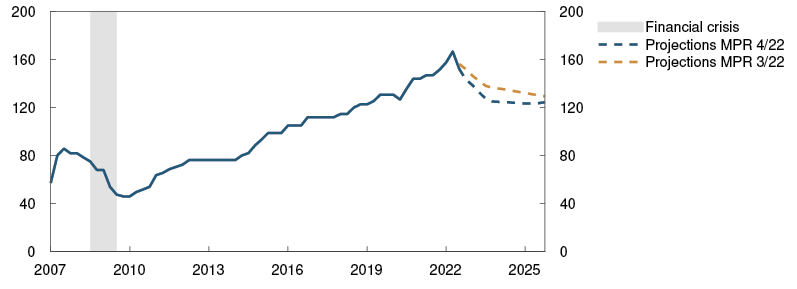
Low yields increase the risk of a sharp fall in commercial property prices. If the properties’ mortgage value falls below the value of the loans because of the decline in commercial property prices, banks may incur losses if the loans default. However, the rise in commercial property prices since the financial crisis has not been matched by corresponding borrowing. This has boosted CRE firms’ equity ratios, strengthening their resilience to price falls.
Bank debt accounts for the largest share of CRE firms’ debt, but bond debt is an increasingly important financing source. Bond market and bank risk premiums have increased substantially. A large amount of bond debt issued by CRE firms will mature in the years ahead. Some CRE firms may find it a challenge to issue new bond debt, at the same time as obtaining a bank loan may be more difficult. These challenges may be amplified by a marked fall in commercial property prices.
In line with the projections in this Report, bank losses on CRE exposures are expected to be fairly low ahead. If all CRE firms write down their property values by 30%, simple sensitivity analyses show that many firms could end up with negative equity. 8 Banks may then face higher losses if CRE firms default on their debt. In a severe downturn scenario where commercial property prices are almost halved, banks’ credit losses on CRE exposures may be substantial (see the stress test in Financial Stability Report 2022).
CRE sector vulnerabilities
Banks’ high CRE exposures are a key structural vulnerability in the financial system, at the same time as low yields are a cyclical vulnerability that increases the risk of a sharp fall in commercial property prices (see discussion in Financial Stability Report 2022).
In the CRE sector, the office segment is especially important for financial stability, since banks’ exposures to this segment are substantial. A relatively large share of the stock of office buildings is in Oslo, and selling prices for prime office space in Oslo are an important indicator of CRE sector vulnerabilities.
2 Period: 2016 Q1 – 2025 Q4. Projections from 2022 Q3 for MPR 3/22 and 2022 Q4 for MPR 4/22. Non-financial corporations in mainland Norway.
3 Period: 1980 Q1 – 2025 Q4. Projections from 2022 Q4. Debt-to-income ratio is debt as a percentage of disposable income. Disposable income is income after taxes and interest payments. Debt service ratio is interest and estimated principal payments as a percentage of after-tax income. Interest burden is interest payments as a percentage of after-tax income.
4 Period: January 2016 – March 2023. Projections from December 2022.
5 Period: January 2012 – November 2022.
6 Period: 2016 Q1 – 2025 Q4. Projections from 2022 Q3 for MPR 3/22 and 2022 Q4 for MPR 4/22.
7 Period: 2007 Q1 – 2025 Q4. Projections from 2022 Q3 for MPR 3/22 and 2022 Q4 for MPR 4/22. Prime office space in Oslo
8 See Section 5 of Monetary Policy Report 4/21.
5.3 Banks
Current earnings are banks’ first line of defence against losses. Return on equity for the large Norwegian banks was 12% in 2022 Q3, broadly unchanged from the two preceding quarters. Over the past year, increased net interest income, which is the main source of revenue for Norwegian banks, has boosted profitability.
Banks’ credit losses have been low so far in 2022, primarily reflecting reversals of previous impairment losses. Norges Bank expects reversals to be lower ahead and losses on loans to customers with weak debt-servicing capacity to increase somewhat in response to higher interest rates and high inflation. Overall, credit losses are set to increase somewhat but remain close to the average for the past 20 years. Nevertheless, banks are expected to maintain profitability on the back of increased net interest income.
Norwegian banks are solvent and satisfy the capital requirements by a solid margin (Chart 5.7). The stress test in Financial Stability Report 2022 shows that banks are resilient and that capital buffers help to enable banks to absorb losses and maintain lending in a severe economic downturn. The economic outlook is highly uncertain, and the risk of a downturn has increased over the past year. It is therefore especially important that the financial system remains resilient so that it can perform its tasks effectively also in the event of severe economic downturns and crises. The countercyclical capital buffer requirement helps banks maintain ample loss-absorbing capacity.
Chart 5.7 Banks are well equipped to meet the approved buffer requirements9
Percent. At 2022 Q3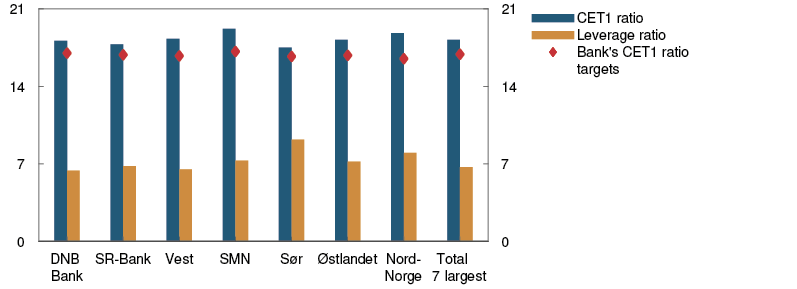
9 Largest Norwegian-owned banking groups. Total seven largest banks is a weighted average of the seven banks shown in the chart. Capital targets are defined here as regulatory requirements at 31 March 2023 with a margin above the capital requirement.
In September 2022, Finanstilsynet (Financial Supervisory Authority of Norway) changed the requirement regarding the type of capital banks can use to meet the Pillar 2 requirement. Previously, the entire Pillar 2 requirement needed to be satisfied using Common Equity Tier 1 (CET1) capital. Following the change, Finanstilsynet requires that banks use at least 56.25% CET1 capital to satisfy the requirement. However, Finanstilsynet will update the Pillar 2 requirements. Finanstilsynet has recently increased the Pillar 2 requirement for DNB Bank Group with effect from 31 December 2022.
Annex
Detailed tables of projections
Table 1 International projections
|
Change from projections inMonetary Policy Report 3/22 in brackets |
Weights1 Percent |
Percentage change from previous year |
||||
|
2021 |
2022 |
2023 |
2024 |
2025 |
||
|
GDP |
||||||
|
US |
9 |
5.9 (0.2) |
2 (0.3) |
1.2 (0) |
1.5 (-0.2) |
1.7 (-0.2) |
|
Euro area |
35 |
5.3 (0.1) |
3.3 (0.1) |
-0.1 (-0.3) |
1.2 (-0.3) |
2 (-0.1) |
|
UK |
11 |
7.5 (0.1) |
4.4 (1) |
-1 (-1.4) |
0.7 (-0.4) |
2 (0.3) |
|
Sweden |
13 |
4.8 (0) |
2.9 (0.1) |
-0.5 (-1) |
1 (-0.8) |
2.1 (0.3) |
|
China |
7 |
8.1 (0) |
3 (0.4) |
4.3 (-0.7) |
4.5 (-0.3) |
4 (-0.5) |
|
13 trading partners1 |
100 |
5.9 (0.1) |
3.4 (0.3) |
0.5 (-0.6) |
1.7 (-0.3) |
2.3 (0) |
|
5 trading partners2 |
5.9 (0) |
3.2 (0.3) |
0.4 (-0.6) |
1.5 (-0.4) |
2.2 (-0.1) |
|
|
Prices |
||||||
|
Underlying inflation3 |
2 (0) |
4.8 (0.2) |
4.2 (0.6) |
2.5 (0.3) |
2.1 (0) |
|
|
Wage growth4 |
3.9 (-0.1) |
4.4 (0.1) |
4.5 (0.3) |
3.5 (0) |
2.9 (0.1) |
|
|
Prices for consumer goods imported to Norway5 |
2 (0) |
7.5 (-0.7) |
0.4 (-1.5) |
1.1 (2.5) |
0.8 (0.2) |
|
1 The aggregate includes: Euro area, China, UK, Sweden, US, Brazil, Denmark, India, Poland, South Korea, Singapore, Thailand and Turkey. Export weights.
2 The aggregate includes: Euro area, China, Sweden, UK and US. Export weights.
3 The aggregate for underlying inflation includes: Euro area, Sweden, UK and US. Import weights.
4 Projections for compensation per employee in the total economy. The aggregate includes: Euro area, Sweden, UK and US. Import weights.
5 In foreign currency terms. Including composition effects and freight rates.
Sources: Refinitiv Datastream and Norges Bank
Table 2a Consumer prices. Twelve-month change. Percent
|
2022 |
2023 |
||||||
|
Sep |
Oct |
Nov |
Dec |
Jan |
Feb |
Mar |
|
|
Consumer price index (CPI) |
|||||||
|
Actual |
6.9 |
7.5 |
6.5 |
||||
|
Projections MPR 3/22 |
6.0 |
5.8 |
5.4 |
5.1 |
|||
|
Projections MPR 4/22 |
6.0 |
6.9 |
6.8 |
6.2 |
|||
|
CPI-ATE |
|||||||
|
Actual |
5.3 |
5.9 |
5.7 |
||||
|
Projections MPR 3/22 |
5.0 |
5.0 |
5.0 |
4.9 |
|||
|
Projections MPR 4/22 |
5.7 |
5.9 |
5.9 |
5.8 |
|||
|
Imported consumer goods in the CPI-ATE |
|||||||
|
Actual |
5.2 |
6.1 |
5.9 |
||||
|
Projections MPR 3/22 |
4.9 |
4.9 |
5.3 |
4.8 |
|||
|
Projections MPR 4/22 |
5.8 |
5.8 |
5.6 |
6.0 |
|||
|
Domestically produced goods and services in the CPI-ATE |
|||||||
|
Actual |
5.2 |
5.7 |
5.5 |
||||
|
Projections MPR 3/22 |
5.0 |
5.0 |
4.9 |
4.9 |
|||
|
Projections MPR 4/22 |
5.6 |
6.0 |
6.0 |
5.7 |
|||
Sources: Statistics Norway and Norges Bank
Table 2b House prices. Monthly change. Seasonally adjusted. Percent
|
2022 |
2023 |
||||||
|
Sep |
Oct |
Nov |
Dec |
Jan |
Feb |
Mar |
|
|
Actual |
-1.0 |
-0.8 |
-0.9 |
||||
|
Projections MPR 3/22 |
-0.3 |
-0.5 |
-0.5 |
-0.5 |
|||
|
Projections MPR 4/22 |
-0.8 |
-0.5 |
-0.5 |
-0.5 |
|||
Sources: Eiendomsverdi, Finn.no, Real Estate Norway and Norges Bank
Table 2d GDP for mainland Norway. Monthly change. Seasonally adjusted. Percent
|
2022 |
2023 |
||||||
|
Sep |
Oct |
Nov |
Dec |
Jan |
Feb |
Mar |
|
|
Actual |
0.6 |
||||||
|
Projections MPR 3/22 |
-0.5 |
0.1 |
0.1 |
0.1 |
|||
|
Projections MPR 4/22 |
-0.2 |
-0.2 |
-0.4 |
0.0 |
0.0 |
0.0 |
|
Sources: Statistics Norway and Norges Bank
Table 2c Registered unemployment (rate). Percent of labour force. Seasonally adjusted
|
2022 |
2023 |
||||||
|
Sep |
Oct |
Nov |
Dec |
Jan |
Feb |
Mar |
|
|
Actual |
1.6 |
1.6 |
1.6 |
||||
|
Projections MPR 3/22 |
1.7 |
1.7 |
1.7 |
1.8 |
|||
|
Projections MPR 4/22 |
1.7 |
1.7 |
1.8 |
1.8 |
|||
Sources: Norwegian Labour and Welfare Administration (NAV) and Norges Bank
Table 2e GDP for mainland Norway. Quarterly change. Seasonally adjusted. Percent
|
2022 |
2023 |
||||||
|
Q2 |
Q3 |
Q4 |
Q1 |
||||
|
Actual |
1.2 |
0.8 |
|||||
|
Projections MPR 3/22 |
0.7 |
-0.1 |
0.0 |
-0.1 |
|||
|
Projections MPR 4/22 |
0.0 |
-0.3 |
|||||
Sources: Statistics Norway and Norges Bank
Table 3 Projections for main economic aggregates
|
Change from projections inMonetary Policy Report 3/22 in brackets |
Percentage change from previous year (unless otherwise stated) |
|||||
|
In billionsof NOK2021 |
Projections |
|||||
|
2021 |
2022 |
2023 |
2024 |
2025 |
||
|
Prices and wages |
||||||
|
CPI |
3.5 |
5.8 (0.4) |
4.8 (0.3) |
2.8 (-0.3) |
2.6 (0.1) |
|
|
CPI-ATE |
1.7 |
3.9 (0.2) |
5.2 (0.4) |
3.6 (0.1) |
2.7 (0.1) |
|
|
Annual wages |
3.5 |
3.9 (-0.1) |
4.7 (0.1) |
4.3 (-0.2) |
4.0 (-0.2) |
|
|
Real economy1 |
||||||
|
Gross domestic product (GDP) |
4 190 |
4 |
3.2 (1.0) |
0.6 (-0.2) |
0.6 (-0.2) |
0.3 (0.0) |
|
GDP, mainland Norway |
3 281 |
4.2 |
3.6 (0.8) |
-0.2 (0.1) |
0.2 (-0.2) |
1.4 (0.3) |
|
Output gap, mainland Norway (level) |
-0.4 |
1.9 (0.2) |
0.2 (0.0) |
-0.8 (-0.3) |
-0.6 (-0.2) |
|
|
Employment, persons, QNA |
1.2 |
3.9 (0.4) |
-0.4 (0.0) |
-0.4 (-0.3) |
0.7 (0.2) |
|
|
Registered unemployment (rate, level) |
3.1 |
1.8 (0.0) |
2.0 (0.0) |
2.4 (0.1) |
2.4 (0.1) |
|
|
Demand1 |
||||||
|
Mainland demand |
3 388 |
3.8 |
4.7 (1.4) |
-1.0 (-1.2) |
1.0 (-0.3) |
2.3 (0.3) |
|
– Household consumption |
1 621 |
4.4 |
6.5 (0.7) |
-1.5 (-0.4) |
0.5 (0.2) |
2.8 (0.9) |
|
– Business investment |
362 |
4.3 |
16.5 (11.1) |
-0.9 (-4.4) |
-0.2 (-4.1) |
3.0 (-0.8) |
|
– Housing investment |
219 |
3 |
-3.2 (-3.2) |
-4.8 (-5.8) |
1.6 (0.2) |
3.6 (1.5) |
|
– Public demand |
1 187 |
2.9 |
0.0 (0.1) |
0.4 (-0.5) |
2.0 (0.2) |
1.1 (-0.4) |
|
Petroleum investment |
177 |
-2.1 |
-7.0 (-1.0) |
4.0 (0.0) |
12.0 (-3.0) |
2.0 (0.0) |
|
Mainland exports |
724 |
4.9 |
5.2 (1.8) |
4.5 (-0.5) |
2.1 (-0.1) |
3.0 (0.0) |
|
Imports |
1 212 |
1.2 |
12.3 (1.6) |
1.2 (-2.1) |
3.0 (-0.6) |
1.0 (-0.1) |
|
House prices and debt |
||||||
|
House prices |
9.1 |
4.9 (-0.6) |
-4.3 (-1.9) |
2.1 (0.8) |
3.7 (-0.4) |
|
|
Household credit (C2) |
5 |
4.0 (-0.3) |
3.4 (-0.6) |
3.0 (-0.4) |
2.9 (-0.4) |
|
|
Interest rate, exchange rate and oil price |
||||||
|
Policy rate (level) |
0.1 |
1.3 (0.0) |
3.0 (0.0) |
2.9 (-0.1) |
2.5 (-0.2) |
|
|
Import-weighted exchange rate (I-44) (level) |
108.7 |
110.0 (0.0) |
110.5 (0.4) |
108.3 (0.2) |
107.4 (0.8) |
|
|
Money market rates, trading partners (level) |
-0.2 |
1.2 (0.0) |
3.7 (0.2) |
3.2 (0.1) |
2.8 (-0.1) |
|
|
Oil price, Brent Blend. USD per barrel |
70.7 |
101.6 (-0.4) |
76.5 (-7.1) |
74.6 (-3.2) |
72.7 (-1.3) |
|
|
Household income and saving1 |
||||||
|
Real disposable income excl. dividend income |
-0.2 |
1.2 (0.7) |
-2.3 (-0.3) |
2.0 (0.6) |
3.1 (-0.1) |
|
|
Saving ratio excl. dividend income (rate, level) |
5.2 |
0.3 (-1.5) |
-0.7 (-1.6) |
0.6 (-1.3) |
0.8 (-2.2) |
|
|
Fiscal policy |
||||||
|
Structural non-oil deficit as a percentage of GPFG2 |
3.2 |
2.7 (-0.4) |
2.6 (0.0) |
2.5 (0.1) |
2.5 (0.0) |
|
|
Structural non-oil deficit as a percentage of trend GDP |
10.5 |
9.7 (-1.4) |
8.9 (-0.5) |
9.2 (0.2) |
9.3 (-0.1) |
|
1 All figures are working-day adjusted.
2 Government Pension Fund Global measured at the beginning of the year.
Sources: Eiendomsverdi, Finn.no, Ministry of Finance, Norwegian Labour and Welfare Administration (NAV), Real Estate Norway, Refinitiv Datastream, Statistics Norway and Norges Bank