Monetary policy assessment
Activity in the Norwegian economy has continued to rise after Covid-19 containment measures were removed in winter. Since the December 2021 Monetary Policy Report, unemployment has fallen to a low level, and price and wage inflation has been higher than expected. The war in Ukraine has created heightened uncertainty about the economic outlook, but there are prospects of a continued upturn in the Norwegian economy. Rising wage growth and imported goods inflation are expected to push up inflation ahead. The objective of stabilising inflation around the target somewhat further out suggests a higher policy rate.
Norges Bank’s Monetary Policy and Financial Stability Committee decided to raise the policy rate from 0.5% to 0.75% at its meeting on 23 March. Based on the Committee’s current assessment of the outlook and balance of risks, the policy rate will most likely be raised further in June.
The war in Ukraine creates heightened uncertainty about the outlook for global growth and inflation
Economic activity among Norway’s trading partners has continued to rise. In 2021 Q4, trading-partner GDP growth was a little higher than projected in the December Report. Labour markets have improved, and wage growth is on the rise. The Omicron wave this winter proved to be more short-lived in advanced countries than assumed in the December Report, and most containment measures have been lifted in many countries.
High energy prices, a surge in freight rates and long delivery times have driven up headline consumer price inflation in many countries. Underlying inflation among trading partners has also moved up, and inflation expectations have increased.
Russia’s invasion of Ukraine has led to heightened uncertainty about global economic developments ahead. Prices for many commodities, including oil and gas, have risen since December, and supply chain disruptions may last longer. High inflation, export market disruptions and greater uncertainty among households and firms are expected to weigh on economic growth ahead, especially in Europe. The economic upturn among trading partners is expected to continue, but growth prospects appear to be weaker than projected in the December Report. The projections for global price and wage inflation are higher than in December.
Chart A Sharp rise in oil and gas prices1
USD/barrel

Sources: Refinitiv datastream and Norges Bank
Uncertainty associated with the war in Ukraine has resulted in financial market volatility. Global equity indexes have fallen, and corporate bond risk premiums have risen. Norwegian money market premiums have also moved up. The krone has appreciated more than projected in the December Report, likely reflecting the rise in oil prices.
Global policy rate expectations have increased on the back of higher inflation and higher inflation expectations. Long-term sovereign bond yields have largely tracked policy rate expectations. Norwegian market rates have also increased and indicate expectations of a further rise in the policy rate. Residential mortgage rates have moved up broadly as expected in response to the policy rate hikes in 2021.
Chart B Expectations of a faster policy rate rise among trading partners2 Policy rates and estimated forward rates in selected countries. Percent
High employment and little spare capacity in the Norwegian economy
Higher infection rates and containment measures led to a dip in activity around the turn of the year, and mainland GDP was lower than projected in the December Report. However, the impact of the most recent infection wave was less pronounced than assumed in December. In mid-February, the Government removed all domestic containment measures, and uncertainty about the further evolution of the pandemic receded.
Chart C Higher infection rates resulted in lower activity around the turn of the year3 GDP for mainland Norway. Seasonally adjusted. Index. February 2020 = 100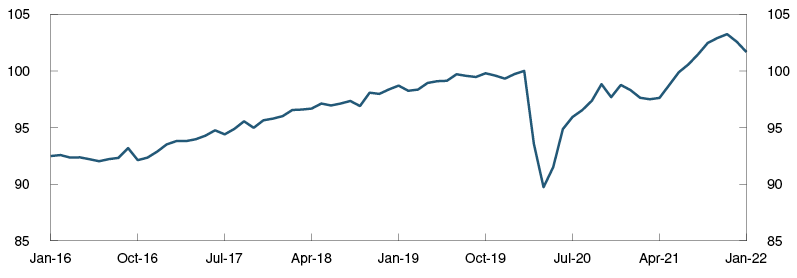
Information from Norges Bank’s Regional Network and card transaction data both point to a rapid recovery of activity in sectors most affected by containment measures. Recently, employment has also risen substantially. Moreover, a large share of Regional Network contacts reported capacity and production constraints due to labour shortages in February. The strong demand for labour is evidenced in the large number of job vacancies. Seasonally adjusted registered unemployment fell to 2.1% in February, which is lower than projected in the December Report. Capacity constraints are likely to pull down on growth in the Norwegian economy ahead.
Chart D Regional Network enterprises report high capacity utilisation4 Capacity utilisation and labour shortages according to the Regional Network. Percentage shares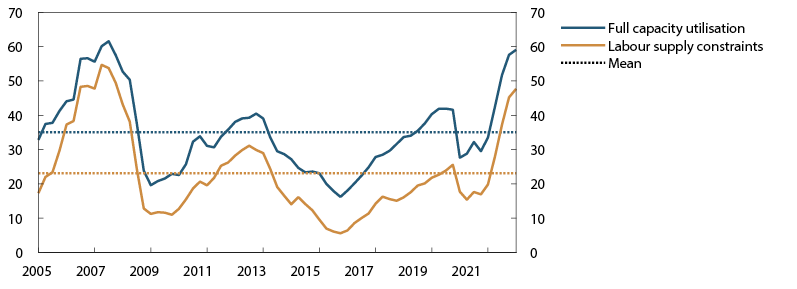
The war in Ukraine has led to heightened uncertainty about the economic outlook for Norway. High energy prices are generating substantial government revenue and may drive up petroleum investment and energy exports but will also increase expenses facing households and firms. Some firms may also face supply problems and faltering foreign demand. While lower growth in real household disposable income is likely to curb growth in private consumption, there are still prospects for a continued upswing in the Norwegian economy.
Petroleum revenue spending in 2022 is likely to be higher than assumed in the December Report. The increase in spending relates among other things to measures to strengthen military readiness, refugee intake from Ukraine and prolonged government support for households’ electricity bills. The government’s overall budget plans still imply a tighter fiscal policy than in 2021.
House prices rose markedly at the beginning of 2022 and have been higher than projected. The rise is likely related to the new regulation on the sale of real property, effective from the beginning of this year, in addition to strong housing demand and the low supply of homes for sale. The impact of the new regulation is likely to be transitory, and house price inflation is expected to move down ahead.
Expectations of higher price and wage inflation
High energy prices have driven up the level of overall CPI. Following a rise towards the end of 2022, 12-month CPI inflation has slowed again and was 3.7% in February. Government support to compensate for the surge in electricity prices has pulled down energy price inflation more than expected, but CPI inflation has still been higher than projected in the December Report.
The rise in the consumer price index adjusted for tax changes and excluding energy products (CPI-ATE) has picked up from the low levels in autumn. The rise in prices for both imported goods and domestically produced goods and services has increased. In February, 12-month CPI-ATE inflation was 2.1%, which was higher than projected in December. Other indicators of underlying inflation have also risen and are overall higher than the rate of increase in the CPI-ATE. Inflation expectations have risen, especially at the one- to two-year horizon. Longer-term inflation expectations are somewhat above 2%.
Wage growth in 2021 turned out to be higher than projected in the December Report. At the same time, wage expectations for 2022 have risen, probably reflecting increased labour demand and high consumer price inflation. Annual wage growth in 2022 is now projected at 3.7%, which is higher than in the December Report.
Chart E Rapid rise in underlying inflation5 CPI and CPI-ATE. Twelve-month change. Percent
Need for higher interest rates in Norway
The operational target of monetary policy is annual consumer price inflation of close to 2% over time. Inflation targeting shall be forward-looking and flexible so that it can contribute to high and stable output and employment and to countering the build-up of financial imbalances.
Activity in the Norwegian economy has continued to rise after containment measures were lifted in winter. Employment has increased further, and capacity utilisation appears to be above a normal level. The war in Ukraine has led to heightened uncertainty about the economic outlook, but there are still prospects for a continued upswing in the Norwegian economy. Price and wage inflation has been higher than projected, and wage expectations have risen. Rising wage growth and imported goods inflation are expected to push up underlying inflation ahead.
Monetary policy is expansionary. In the Committee’s assessment, the objective of stabilising inflation around the target somewhat further out suggests a higher policy rate. Higher interest rates will ease the pressures in the Norwegian economy, but employment will likely remain elevated. Uncertainties relating to the economic outlook and households’ response to higher interest rates warrant a gradual rise in the policy rate.
The policy rate forecast has been revised up from the December Report and indicates a rise in the policy rate to around 2.5% at the end of 2023. This is above what is estimated to be a neutral policy rate. With such a path for the policy rate, there are prospects that inflation will move close to target somewhat further out. Capacity utilisation remains above a normal level in the projection period, and unemployment remains low. House price inflation and credit growth are expected to moderate.
Chart F A higher policy rate helps to achieve the objectives of monetary policy6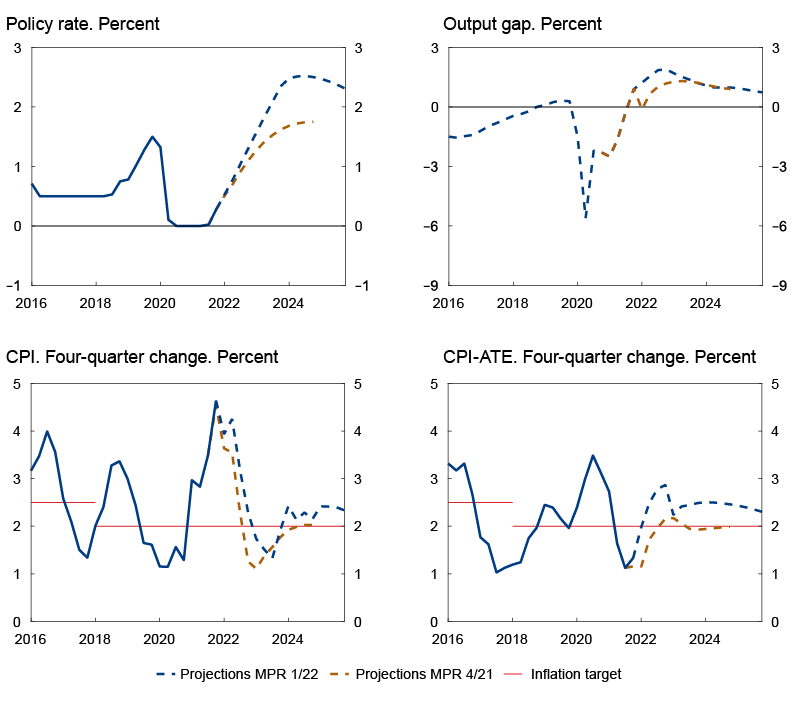
In its discussion of the balance of risks, the Committee was concerned with the prospect that the war in Ukraine could result in weaker-than-expected global growth amid rising inflation. The Committee was also concerned with the risk of accelerating price and wage inflation as a result of capacity constraints in the economy and persistent global price pressures. If there are prospects of persistently high inflation, the policy rate may be raised more quickly.
The Committee decided unanimously to raise the policy rate to 0.75%. Based on the Committee’s current assessment of the outlook and balance of risks, the policy rate will most likely be raised further in June.
Ida Wolden Bache
Øystein Børsum
Ingvild Almås
Jeanette Fjære-Lindkjenn
23 March 2022
1 Period: 1 January 2016 – 31 December 2025. Futures prices from 10 December 2021 for MPR 4/21 and 22 March 2022 for MPR 1/22. Oil price is Brent Blend. Gas price is the weighted average of Dutch and UK gas prices.
2 Period: 1 January 2016 – 31 December 2025. Daily data through 18 March 2022. Quarterly data from 2021 Q1 for MPR 4/21 and 2021 Q2 for MPR 1/22. Forward rates at 10 December 2021 for MPR 4/21 and 18 March 2022 for MPR 1/22. ECB’s deposit facility rate for the euro area.
3 Period: January 2016 – January 2022.
4 Period: 2005 Q1 – 2022 Q1. Share of contacts that will face some or considerable difficulty meeting increased demand and share of contacts citing shortage of labour as a constraint on production. The question about labour is asked only of the enterprises reporting full capacity utilisation, but the series shows the share of all contacts included in the interview period. The local government and hospital sector is omitted from the capacity utilisation series, but is, however, included in the labour force series.
5 Period: January 2018 – February 2022. CPI-ATE: CPI adjusted for tax changes and excluding energy products.
6 Period: 2016 Q1 – 2025 Q4. Projections from 2021 Q4 for MPR 4/21 and 2022 Q1 for MPR 1/22 for the policy rate, CPI and CPI-ATE. The output gap measures the percentage deviation between mainland GDP and estimated potential mainland GDP. CPI-ATE: CPI adjusted for tax changes and excluding energy products.
Assessment of the countercyclical capital buffer requirement
At its meeting on 23 March, Norges Bank’s Monetary Policy and Financial Stability Committee decided to increase the countercyclical capital buffer rate to 2.5%, effective from 31 March 2023.
Norges Bank sets the countercyclical capital buffer rate four times a year. The decision and assessment are presented in this Report. In its work on setting the buffer rate, Norges Bank exchanges relevant information and assessments with Finanstilsynet (Financial Supervisory Authority of Norway). Norges Bank’s framework for the countercyclical capital buffer is described in Norges Bank Papers 4/2019.
The objective of the countercyclical capital buffer is to bolster banks’ resilience and mitigate the amplifying effects of bank lending during downturns. Banks should build and hold a countercyclical buffer when financial imbalances are building up or have built up. In the event of an economic downturn that causes or could cause higher credit losses and a marked reduction in access to credit, the buffer rate should be lowered with a view to increasing banks’ lending capacity.
The countercyclical capital buffer rate was reduced from 2.5% to 1.0% in March 2020. The buffer rate was raised to 1.5% in June 2021 and to 2.0% in December 2021, effective from 30 June 2022 and 31 December 2022, respectively.
Prior to the reduction in March 2020, the countercyclical capital buffer rate had been set at 2.5%. Financial imbalances had then built up over a long period. During the pandemic, residential and commercial property prices have increased substantially, and household credit growth has accelerated. Since mid-2021, property price inflation has been more moderate, partly owing to higher lending rates. In 2022, house price inflation has been higher than anticipated, but is expected to slow ahead. It is the Committee’s assessment that financial imbalances suggest that the buffer rate should be returned to 2.5%.
Activity in the Norwegian economy has continued to rise after containment measures were removed in winter. The war in Ukraine has led to heightened uncertainty about the economic outlook, but there are prospects for a continued upturn in the Norwegian economy.
Creditworthy firms and households appear to have ample access to credit. Norwegian banks are profitable and their credit losses are low. There appears to be little direct risk of credit losses owing to the war. High oil and gas prices reduce banks’ risk of losses on oil-related exposures. Looking ahead, credit losses are expected to be low. Banks are well equipped to meet a higher countercyclical capital buffer rate while maintaining credit supply.
At its meeting on 23 March, Norges Bank’s Monetary Policy and Financial Stability Committee unanimously decided to raise the countercyclical capital buffer rate to 2.5%, effective from 31 March 2023.
Ida Wolden Bache
Øystein Børsum
Ingvild Almås
Jeanette Fjære-Lindkjenn
23 March 2022
1 The global economy
The rise in economic activity among Norway’s trading partners was slightly stronger than expected in 2021 Q4. Russia’s invasion of Ukraine led to a rise in oil and gas prices and volatility in global financial markets. The projection for trading-partner GDP growth in 2022 has been revised down from the December 2021 Monetary Policy Report. Headline inflation has continued to rise in many countries, and the projections for underlying inflation have been revised up.
The war in Ukraine is weighing on growth
It was assumed in the December Report that higher infection rates owing to the rapid transmission of the Omicron variant would weigh on GDP growth in Q4. Activity rose by over 1.5% in the US and China between Q3 and Q4. Euro area growth was only 0.3% in the same period, and activity has only now regained its pre-pandemic level. Overall, the winter Omicron wave in advanced economies was of shorter duration than envisaged in the December Report, but infection rates have risen to high levels in several Asian countries. In China, very strict containment measures have been introduced in several large cities.
Russia’s invasion of Ukraine has created heightened uncertainty about the economic outlook. Many countries have imposed extensive economic sanctions on Russia, which will likely lead to a severe economic downturn in Russia and reduce its foreign trade. Russia is a major exporter of oil and gas to Europe. Oil and gas prices rose markedly after the invasion, and the rise in prices for a number of commodities has accelerated (Chart 1.1 and in "Sharp rise in commodity prices". The Bank’s projections for growth and inflation among Norway’s trading partners are based on energy and commodity futures prices.
Chart 1.1 Sharp rise in commodity prices1 Commodity prices. Index. Week 1 2021 = 100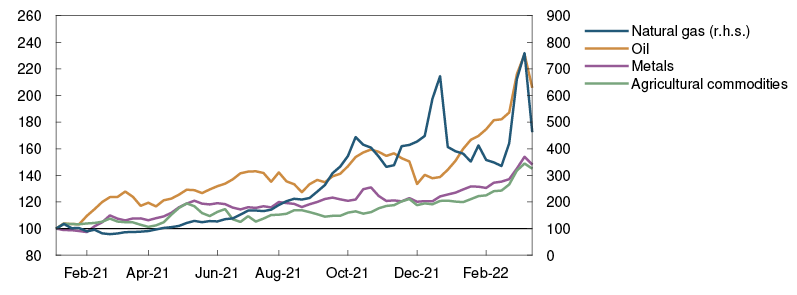
Higher goods prices will reduce household purchasing power, increase firms’ input costs and weigh on economic activity. In addition, tighter financial conditions and greater uncertainty faced by households and firms are likely to dampen both consumption and investment. The projection for GDP growth in 2022 has been revised down since the December Report, particularly for European countries (Chart 1.2).
Chart 1.2 The war in Ukraine is weighing on GDP growth in 20222 GDP for trading partners. Quarterly change. Percent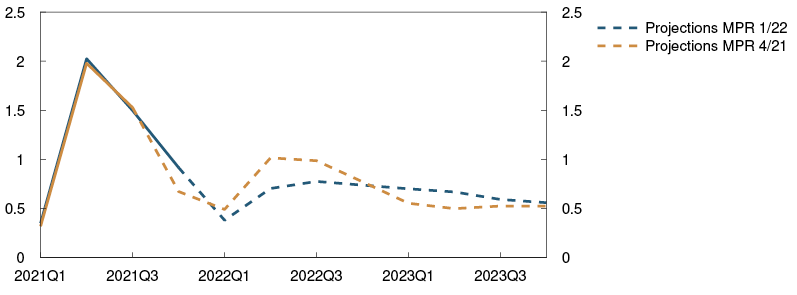
Recent years’ expansionary monetary and fiscal policies are still making a positive contribution to activity in most countries, but it is assumed that monetary tightening will start in 2022. Higher defence spending and energy investment in Europe will likely boost activity further out in the projection period. In China, the reorientation of policy towards more balanced growth is expected to continue, and growth is expected to be lower than in the pre-pandemic years. Trading-partner GDP growth is projected to decline gradually from 3.4% in 2022 to about 2% in 2024 (Annex Table 1). Capacity utilisation among trading partners as a whole is expected to be slightly higher than normal from 2023 and to the end of the projection period. Trading-partner imports are expected to increase by 6% in 2022 and close to 5% in 2023.
High consumer price inflation
Over the past year, pandemic-related supply and demand conditions have contributed to a marked rise in inflation among Norway’s main trading partners. The 12-month rise in the headline consumer price index (CPI) moved up to close to 8% in the US and close to 6% in the euro area in winter (Chart 1.3). The rise in energy prices made up about half of the 12-month rise in the euro area. Underlying consumer price inflation is at 2.7% in the euro area and 6.4% in the US. In recent months, underlying inflation among all Norway’s main trading partners has been higher than projected in December.
Chart 1.3 High consumer price inflation3 Consumer prices. Twelve-month change. Percent
It is assumed that the rise in business costs related to the increases in energy and other commodity prices will to some extent be passed on to consumer prices for goods and services and thereby push up underlying consumer price inflation. In addition, higher infection rates in Asia and the consequences of the war in Ukraine will likely prolong global supply chain disruptions. Global goods price inflation is expected to remain high for longer than assumed in the December Report.
Wage growth among trading partners has been higher than expected in the December Report. Financial support schemes contributed to a rapid rebound in labour demand in many countries after a marked fall at the beginning of the pandemic. At the same time, there have been labour supply constraints, particularly in the US, and job vacancies are very high in many countries. In addition, minimum wages in the EU will likely increase in 2022, and higher consumer price inflation may result in higher wage demands in many countries. Wage growth among Norway’s trading partners is expected to remain above the levels for the pre-pandemic years throughout the projection period. The projections have been revised up since the December Report.
Market-based inflation expectations have continued to rise since December and indicate expectations of high inflation in the coming years. The rise has been particularly pronounced in the euro area. Long-term inflation expectations have also increased and are now slightly above the target levels both for the US and the euro area (Chart 1.4). Underlying consumer price inflation in the US is expected to rise to over 5% in 2022 before gradually falling towards 2.5%. Inflation is also projected to increase markedly in the euro area, Sweden and the UK between 2021 and 2022. The projection for trading partners overall in 2022 has been revised up considerably since the December Report.
Chart 1.4 Higher inflation expectations4 Long-term market-based inflation expectations. Five-year five years ahead. Percent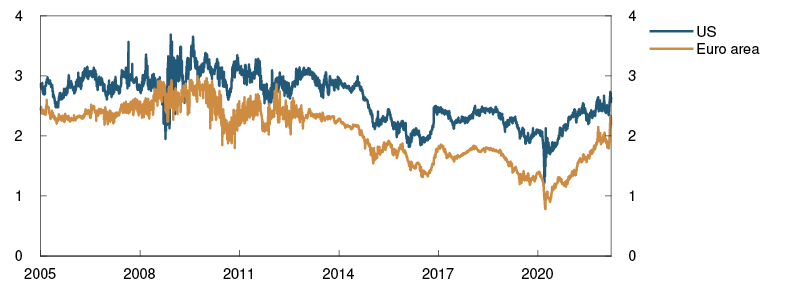
Producer price inflation for consumer goods imported to Norway (IPK index), in foreign currency terms, has been higher than expected. Food prices in particular have risen sharply in recent months. The war in Ukraine will likely contribute to a sustained rise in food prices. The projections for 2022 and 2023 have been revised up considerably since the December Report (Annex Table 1). With low price inflation for clothing and footwear and for audio-visual equipment in China, inflation measured by the IPK is far lower than overall producer price inflation in major advanced economies.
Higher policy rate expectations abroad
Russia’s invasion of Ukraine has led to heightened uncertainty and volatility in global financial markets. European and US equity indexes have fallen since December (Chart 1.5), and corporate bond risk premiums have edged up. Money market risk premiums have also moved up in recent weeks. The invasion has had a more pronounced impact on markets in Europe than in the US, partly reflecting European companies’ greater direct exposure to Russia and Ukraine.
Chart 1.5 Equity indexes have fallen5 Equity indexes in selected countries. 2 January 2019 = 100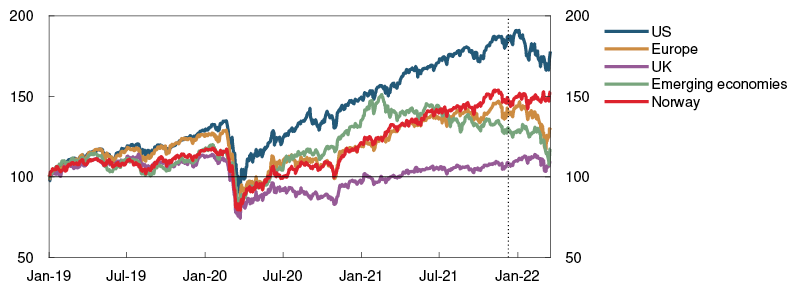
Policy rate expectations among Norway’s main trading partners are appreciably higher than at the time of the December Report. Owing to prospects for continued high inflation, more frequent policy rate increases are expected ahead than previously assumed. The Bank of England and the US Federal Reserve have raised their policy rates by 0.65 and 0.25 percentage point, respectively, since December. The ECB’s policy rates have remained unchanged. Long-term government bond yields have risen since December, driven by higher policy rate expectations.
Uncertainty about the economic implications of the war in Ukraine
Uncertainty about the global economic outlook has increased considerably with Russia’s invasion of Ukraine. It is uncertain both to what extent and for how long the war in Ukraine will affect growth and inflation among Norway’s trading partners. In addition to the humanitarian catastrophe for Ukraine and the neighbouring region, the war may result in persistent disruptions in energy and commodity markets. There is also a risk of a more substantial effect on financial markets and on household consumption and business investment than currently envisaged. Economic growth may turn out lower than projected amid higher-than-expected inflation. In addition, uncertainty remains about the scale and duration of the pandemic-related supply and demand conditions and the implications for global growth and inflation.
1 Period: Week 1 2021 – week 11 2022. Price on oil is Brent Blend. Price on gas is the weighted average of Dutch and UK gas prices.
2 Period: 2021 Q1 – 2023 Q4. Projections from 2021 Q4 for MPR 4/21 and from 2022 Q1 for MPR 1/22. Export weights. 13 trading partners.
3 Period: January 2016 – February 2022. Core CPI is consumer prices without energy and food for the US and without energy, food, tobacco and alcohol for the euro area.
4 Period: 1 January 2005 – 18 March 2022. Inflation swaps.
5 Period: 1 January 2019 – 18 March 2022. Standard and Poor’s 500 Index (USA). Euro Stoxx 50 Index (Europe). Financial Times Stock Exchange 100 Index (UK). MSCI Emerging Markets Index (Emerging economies). Oslo Børs Benchmark Index (Norway). MPR 4/21 was based on information until 10 December 2021, indicated by vertical line.
Sharp rise in commodity prices
Prices for energy, metals and agricultural products have risen substantially since the December 2021 Report (Chart 1.A) and had already risen before Russia’s invasion of Ukraine. Demand had picked up on the back of the global economic recovery. In addition, a faster-paced climate transition led to higher demand for many metals. Supply was hampered by pandemic-related disruptions, but was also held back by extreme weather events and insufficient investment to expand freight and production capacity in recent years. Low energy and commodity stocks indicated that growth in consumption was outpacing growth in production.
Chart 1.A Higher commodity and energy prices1 Index. January 2005 = 100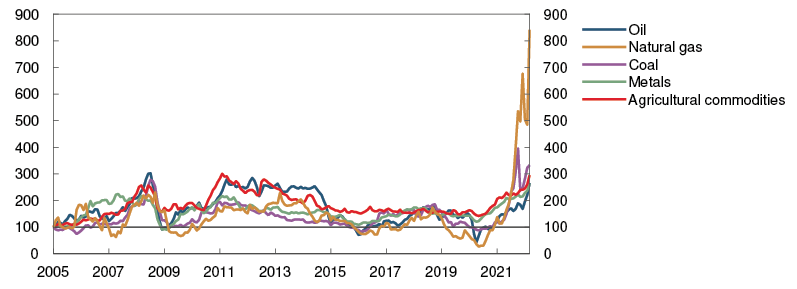
Russia’s invasion of Ukraine led to a further increase in energy and other commodity prices as Russia is a major exporter of various raw materials. Russia is the world’s largest oil exporter. Russian gas exports account for around 45% of EU gas imports and coal exports close to 50% of EU coal imports. Russia is also a leading exporter of industrial metals such as aluminium, nickel and steel. Russian and Ukraine together account for about 30% of global wheat exports and are also major exporters of maize and inputs to fertiliser production.
The rise in commodity prices partly reflects the risk that Russian exports will be further reduced or come to a halt. This may occur for example if sanctions on Russia are expanded to include commodity exports, Russia reduces its exports in response to sanctions, or if commodity infrastructure and production capacity are destroyed or damaged by the war.
The US and some other countries have decided to stop importing oil from Russia. Such sanctions have not been imposed so far by the EU. Russia has decided to restrict exports of some goods, including some agricultural products, but not energy products. Demand for Russian commodities may also be lower, and thereby higher for commodities from other producers, because of the risk that sanctions may be imposed later or because firms avoid buying Russian commodities for other reasons.
The rise in commodity prices also reflects substitution between different energy types and other commodities. For example, oil and coal demand increases when gas prices rise. Electricity prices in Europe rise when gas prices go up, which in turn affects electricity prices in Norway. Higher energy prices also have a significant impact on agricultural production costs. The same applies to energy-intensive production of industrial metals.
The Bank’s projections for growth and inflation in Norway and globally are based on futures prices for energy and other commodities. These prices are now materially higher than at the time of the December Report, indicating that the effects of the war in Ukraine may persist (Table 1.A). In addition, futures prices suggest that many energy and other commodity prices may rise to a higher level than the average for previous years.
There is considerable uncertainty about further developments in energy and commodity prices. The war in Ukraine, the risk of production shortfalls and the implementation of countermeasures will affect prices most in the near term, depending on the scale and duration of the conflict. When hostilities come to a halt, the high level of uncertainty will be reduced and the impact on prices dampened, but many countries will seek to reduce their dependence on Russian energy and commodity imports. This could accelerate the transition from fossil to renewable energy. In the transitional phase, energy prices may remain higher than the level we have been accustomed to in recent years.
Table 1.A Energy and commodity prices
|
Change from Monetary Policy Report 4/21 in brackets (pct.) |
Average price (2010–2019) |
Actual prices and futures prices1 |
||||
|
2022 |
2023 |
2024 |
2025 |
|||
|
Oil, USD/barrel |
80 |
71 |
101 (37) |
89 (27) |
82 (21) |
78 (17) |
|
Gas, USD/barrel |
40 |
87 |
180 (29) |
114 (48) |
78 (53) |
59 (36) |
|
Coal, Euro/tonne |
66 |
102 |
208 (99) |
154 (63) |
102 (15) |
99 (12) |
|
German electricity, Øre/kWh |
36 |
105 |
220 (12) |
155 (15) |
109 (17) |
90 (2) |
|
Norwegian electricity, Øre/kWh |
32 |
64 |
82 (13) |
46 (22) |
36 (3) |
34 (-5) |
|
Aluminium, in thousands of USD/tonne |
1.9 |
2.5 |
3.3 (28) |
3.3 (28) |
3.1 (27) |
3.0 (23) |
|
Copper, in thousands of USD/tonne |
6.7 |
9.3 |
10.2 (8) |
10.2 (10) |
10 (9) |
9.8 (8) |
|
Wheat, USD/tonne |
210 |
258 |
356 (23) |
318 (14) |
285 (7) |
- |
|
Maize, USD/tonne |
183 |
227 |
268 (18) |
245 (15) |
220 (13) |
- |
1 Futures prices 18 March 2022
Sources: Refinitiv Datastream and Norges Bank
1 Period: January 2005 – March 2022. Between January 2005 and June 2006, the series for European coal prices was chained with the series for South-African coal prices. The price for March 2022 is the average until 18 March. Price on oil is Brent Blend. Price on gas is the weighted average of Dutch and UK gas prices.
2 Financial conditions
Banks have raised their interest rates on residential mortgage loans since the policy rate was raised in the second half of 2021. At the same time, corporate funding costs have increased. In the years ahead, a higher policy rate is expected to lead to a further rise in lending rates.
The surge in oil prices as a result of Russia’s invasion of Ukraine has contributed to an appreciation of the krone since the December 2021 Monetary Policy Report, but lower risk appetite in financial markets is likely to have curbed the appreciation of the currency. Looking ahead, the krone is projected to show little change through the projection period.
2.1 Interest rates
Higher residential mortgage rates
Household borrowing costs have risen since the policy rate was raised in 2021. After the December monetary policy meeting, the largest banks announced their intention to increase residential mortgage rates by up to 0.25 percentage point, but quoted rates have increased slightly less on average.
The rate increases were announced six weeks ahead and thereby took effect in the course of January and February. In January, the average residential mortgage rate was about 2.1% (Chart 2.1), ie 0.3 percentage point higher than before the policy rate hikes in 2021. Developments are broadly in line with the projections in the December Report.
Chart 2.1 Prospects for a steeper rise in lending rates1 Percent
Quoted interest rates on 10-year fixed-rate loans have increased by around 0.4 percentage point to 3.3% since the December Report.
Residential mortgage rates are expected to increase in the years ahead, albeit somewhat less than the policy rate. The average residential mortgage rate is projected to rise to around 4.0% towards the end of the projection period. Deposit rates are expected to rise somewhat less than residential mortgage rates, gradually pushing up margins on deposit-funded lending towards the pre-pandemic level.
Higher interest rate expectations
In the first quarter of 2022, around 80% of households expected deposit and lending rates to increase over the next year, according to Norges Bank’s Expectations Survey. At the same time last year, about a third of households expected higher interest rates.
Market participants also expect a higher interest rate level ahead, and policy rate expectations have risen markedly since the publication of the December Report. Market participants now expect a larger increase in the policy rate than implied by the policy rate path in the December Report, and expectations suggest a policy rate of just below 2.5% at the end of the projection period.
Higher policy rate expectations have also led to a rise in Norwegian long-term interest rates since the December Report (Chart 2.2). Developments in Norwegian interest rates have generally been consistent with developments in international interest rates. The increase in long-term interest rates will result in higher costs for businesses and households seeking fixed interest rates on new financing.
Chart 2.2 Long-term interest rates have increased2 Yields on 10-year government bonds in selected countries. Percent
Higher money market and risk premiums
The three-month money market rate, Nibor, reflects market policy rate expectations over the next three months and a risk premium, often referred to as the money market premium. Since the December Report, the money market rate has moved up as policy rate expectations have increased and the money market premium has risen.
So far in 2022 Q1, the money market premium has averaged 0.5 percentage point (Chart 2.3). The premium is about 0.15 percentage point higher than in the previous quarter and will likely remain higher than projected in the December Report. The increase reflects expectations of low structural liquidity, and USD funding rates have increased as a result of the war in Ukraine.3 The money market premium is projected to drift down towards 0.35 percentage point in the period ahead.
Chart 2.3 Higher money market premium4 Percentage points
The interest rate on floating-rate bonds is determined by the money market rate plus a risk premium. Since December, risk premiums on new corporate bond issues have edged up, partly reflecting heightened uncertainty as a result of the war in Ukraine. A higher money market rate will have less effect in the near term on firms’ total bond funding costs as around half of the bonds issued in NOK are fixed-rate bonds. The interest rate on banks’ loans to the corporate sector is usually linked to the money market rate. The rise in the money market rate has therefore also led to higher corporate lending rates.
While global equity indexes have fallen, the Oslo Børs Benchmark Index has edged up since the December Report, mainly on account of higher oil and gas prices.
1 Period: 2016 Q1 – 2025 Q4. Projections from 2021 Q4 for MPR 4/21 and from 2022 Q1 for MPR 1/22 residental mortgage rate is the average rate on outstanding mortgage loans to households for the sample of banks and mortgage companies included in Statistics Norway’s monthly interest rate statistics.
2 Period: 1 January 2020 – 18 March 2022.
3 Read more in the box “Structural liquidity” on page 20 of Monetary Policy Report 2/21.
4 Period: 1 January 2016 – 31 December 2025. Five-day moving average. Latest observation is 18 March 2022. Projections from 2021 Q4 for MPR 4/21 and from 2022 Q1 for MPR 1/22. Premium in the Norwegian money market rate is the difference between the three-month money market rate and expected policy rate.
2.2 Krone exchange rate
Stronger krone exchange rate
The krone exchange rate, as measured by the import-weighted exchange rate index I-44, has fluctuated considerably since the December Report, but is now stronger than before the monetary policy meeting in December. This reflects the rise in oil prices since December, particularly after Russia’s invasion of Ukraine. Lower risk appetite in financial markets has likely pulled down on the krone.
The krone exchange rate is projected to show little change over the coming years (Chart 2.4). The future path of the krone exchange rate remains highly uncertain, partly reflecting uncertainty about the war in Ukraine and future developments in commodity and financial markets.
Chart 2.4 Krone exchange rate expected to show little change5 Import-weighted exchange rate index (I-44). Difference between three-month money market rate in Norway and among trading partners. Percentage points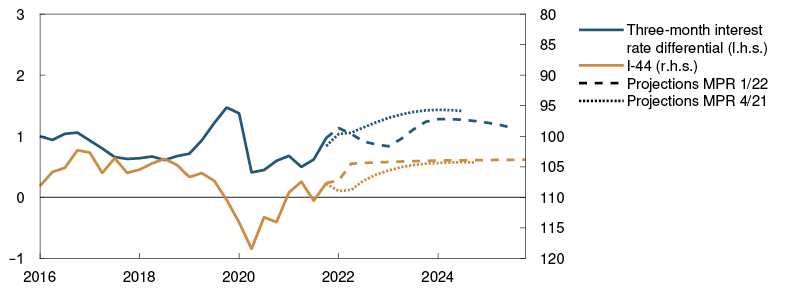
5 Period: 2016 Q1 – 2025 Q4. Projections from 2021 Q4 for MPR 4/21 and 2022 Q1 for MPR 1/22 for I-44. A rising index value for I-44 indicates a depreciating krone. The right-hand scale is inverted. Interest rate differential against main trading partners.
3 The Norwegian economy
Activity in the Norwegian economy now appears to be rising rapidly. Unemployment is low and many businesses are experiencing labour shortages. Capacity utilisation appears to be above a normal level. Underlying inflation, as measured by the consumer price index adjusted for tax changes and excluding energy products (CPI-ATE), has risen and was 2.1% in February. Wage growth and wage expectations have also increased.
Strong growth in the mainland economy is expected in 2022, even if the war in Ukraine dampens the upturn somewhat. Capacity constraints and higher interest rates push down growth in the years ahead. Underlying inflation rises further through 2022 on the back of higher wage growth and increases in global prices. Further out in the projection period, lower capacity utilisation curbs price and wage inflation. Consumer price inflation is projected to be slightly above 2% at the end of the projection period.
3.1 Output and demand
Faster upturn than expected
Since the Covid-19 outbreak in spring 2020, activity in the Norwegian economy and the number of unemployed have fluctuated in step with changes in infection rates and the scale of containment measures. Mainland GDP grew by 4.2% in 2021, after falling by 3.0% in 2020. Owing to higher infection rates and stricter containment measures, activity declined slightly in December and January (Chart 3.1).
Chart 3.1 Higher infection rates resulted in lower activity around the turn of the year1 GDP for mainland Norway. Monthly growth. Contribution to monthly growth. Seasonally adjusted. Percent
In mid-February, the Government removed all domestic containment measures, and the Regional Network enterprises hardest hit by the measures reported a rapid rise in activity after the reopening of society. Card transaction data also point to a marked pick-up in services following the unwinding of containment measures. A drop in unemployment indicates a substantial rise in activity in February.
Economic developments in December and January were slightly weaker than projected in the December Report, but the recent upturn appears to have been stronger than envisaged.
The projections in this Report assume that the pandemic will no longer place any significant constraints on economic activity.
In February, Regional Network contacts expected higher growth in the coming months, with service companies in particular anticipating a sharp upswing (Chart 3.2). The exception is retail companies, who anticipated a fall in activity as they expected households to increasingly rotate spending back to services after the pandemic and greater trade leakage through increased cross-border shopping and foreign travel. A large share of contacts reported production and capacity constraints due to labour shortages (see "Higher level of capacity utilisation" for a further discussion of capacity utilisation).
Chart 3.2 Regional Network contacts expect higher growth2 Reported and expected growth. Annualised. Seasonally adjusted. Percent
Russia’s invasion of Ukraine will likely dampen the economic upswing a little, but growth is still expected to continue. Overall, annual growth in mainland GDP is projected to reach 4.1% in 2022. Over the course of 2022, activity will then be higher than indicated by the Bank’s pre-pandemic projections (Chart 3.3). The main drivers of growth in 2022 are consumption and exports (Chart 3.4).
Chart 3.3 Marked rise in activity3 GDP for mainland Norway. Seasonally adjusted. Index. 2018 Q4 = 100
Chart 3.4 Consumption and exports push up growth in 20224 GDP for mainland Norway. Annual growth. Contribution to annual growth. Percentage points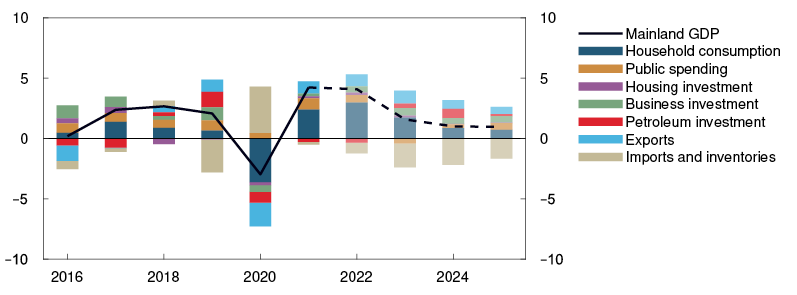
Through the pandemic, expansionary fiscal policy and accommodative monetary policy have made a substantial contribution to sustaining economic activity. In 2022, support for households’ electricity bills and measures relating to the war in Ukraine will push up government spending. The Government’s overall budget proposal nevertheless implies tighter fiscal policy in 2022 than in 2021. Further tightening is expected in 2023, as all pandemic-related support measures are likely to be removed over the course of 2022, with support for electricity bills unwound in early 2023 and the economy running above capacity.
In the projection, tighter fiscal policy, in conjunction with higher interest rates, curbs growth in the Norwegian economy in the years ahead. Capacity constraints also weigh on growth. Annual mainland GDP growth declines to 1.6% in 2023 and slows further to about 1% in 2024 and 2025. Lower consumption growth dampens the upturn, while strong investment growth underpins activity. Compared with the December Report, the projection for mainland GDP growth has been revised up for 2022 and revised down for 2023, while the projection for 2024 is unchanged.
High inflation and higher interest rates dampen consumption growth ahead
Over the past two years, the pandemic has severely limited household consumption opportunities. Infection rates and containment measures have primarily affected spending on services, such as restaurant dining, cultural events and foreign travel. As a result, households have saved more than usual. At the same time, households have spent less on services and more on goods than before the pandemic. The reopening of society through 2021 led to a rise in services consumption, while goods consumption later declined. Household consumption has been broadly in line with the December projections.
The rotation from goods to services is expected to continue in the period to summer, with services consumption reaching pre-pandemic levels in the first half of 2022. Foreign travel is still considerably lower than in the years prior to 2020, and it will likely take some time for it to return to these levels, pointing to relatively high goods consumption also in the near term. Heightened uncertainty on account of the war in Ukraine is also likely to curb foreign spending by Norwegian residents in the period ahead.
Updated figures show that household saving through the pandemic has been lower than assumed but remains substantially higher than normal. The high level of savings provides room to increase consumption more than income growth alone would imply. High inflation and a rising policy rate pull down on real household disposable income (Chart 3.5), while higher wage growth and a projected increase in the number of persons finding work will pull in the opposite direction. Overall, real household disposable income is expected to rise by an annual average of 1.5% in the coming years.
Chart 3.5 Slower growth in real household disposable income5 Real household disposable income. Annual growth. Contribution to annual growth. Percentage points
Slower growth in real household disposable income weighs on consumption growth ahead. Household consumption is projected to rise by 6% in 2022, slowing thereafter to around 1½ % towards the end of the projection period.
The projections for household consumption have been revised down compared with the December Report. This reflects lower-than-expected household saving and prospects for higher interest rates and inflation.
Solid growth in housing investment
After moderate developments through much of 2021, house price inflation was higher during the first two months of 2022. The rise is likely related to the new regulation on the sale of real property from 1 January 2022, in addition to strong housing demand and a low supply of homes for sale. House price inflation is projected to move down through 2022 and into 2023 as interest rates rise and the effects of the new regulation on house prices fade. See Section 5 for a further discussion of housing market developments.
Housing investment fell after summer 2021 but picked up towards the end of the year. Developments have been stronger than expected and may suggest that high construction costs through 2021 have had a smaller impact on housing investment than assumed. A large number of Regional Network contacts in the construction industry report labour shortages, which will likely dampen residential construction activity somewhat. Housing investment is nevertheless expected to grow at a solid pace in 2022, while slowing further out as a result of lower house price inflation and higher interest rates.
High business investment
Mainland business investment fell markedly after the Covid-19 outbreak in 2020 but has since recovered. Business investment has been higher than projected in the December Report.
Statistics Norway’s investment intentions survey for 2022 Q1 indicates that power sector investment will fall sharply in 2022, while manufacturing investment will increase substantially. In February, Regional Network contacts reported that they expected solid investment growth over the next 12 months. However, the recent rise in energy prices and other costs will weaken profitability for a large number of firms, which may lead to lower business investment in 2022 than they have anticipated. The uncertainty created by the war in Ukraine may also restrain the willingness to invest. Overall business investment is projected to increase by close to 5% in 2022.
On the back of high capacity utilisation in the Norwegian economy, business investment is projected to expand in the years ahead (Chart 3.6). Services investment rises, with a marked increase in manufacturing investment owing to the climate and energy transition abroad and in Norway. The transition also leads to a sharp pick-up in power sector investment further out. Higher electricity prices (see Table 1.A in ) and limited energy supply will in isolation dampen manufacturing investment in southern Norway, while boosting investment in power generation and transmission capacity. Higher interest rates will in isolation pull down on investment growth ahead.
Chart 3.6 Higher mainland business investment6 Business investment in mainland Norway. Annual growth. Contribution to annual growth. Percentage points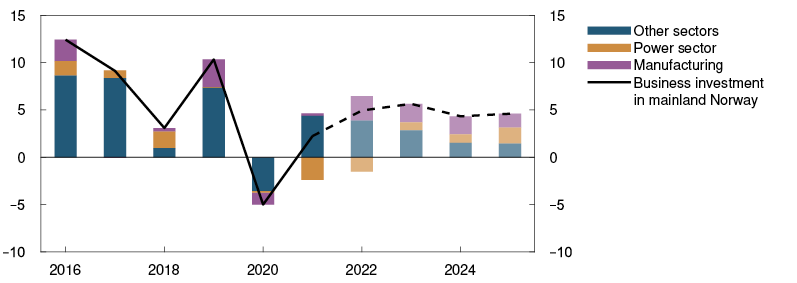
The Covid-19 outbreak, lower oil and gas prices and heightened uncertainty contributed to a fall in petroleum investment in 2020 and 2021 (Chart 3.7). The decline was cushioned by the temporary tax changes for oil companies, which were adopted in 2020. The tax changes and a substantial rise in oil and gas prices point towards higher investment in 2022. Petroleum investment is nevertheless expected to continue to fall in 2022 owing to the completion of several large projects. The temporary tax changes give oil companies strong incentives to initiate development projects before the end of 2022, and oil companies have announced that they will launch a number of development projects towards the end of the year. Petroleum investment is therefore expected to increase markedly between 2022 and 2025, reinforced by expectations of high oil and gas prices ahead and prospects for higher European demand for Norwegian gas in the years ahead as a result of the invasion of Ukraine.
Chart 3.7 Higher petroleum investment in the years ahead7 Petroleum investment. Constant 2022 prices. In billions of NOK
Increased travel will boost exports and imports
Mainland exports grew rapidly in 2021 after the sharp contraction in 2020. Exports are expected to grow at broadly the same pace in 2022, mainly driven by a recovery in foreign tourism in Norway and higher global oil and energy investment. Increased activity among Norway’s trading partners also pushes up exports, even though the war in Ukraine dampens the rise. The recent krone appreciation in isolation suggests lower exports ahead.
Import growth is projected to be strong over the coming years. In 2022, the main drivers of import growth are mainland business investment and foreign travel by Norwegian residents. Solid growth in petroleum investment also lifts imports ahead.
Uncertainty is high
Russia’s invasion of Ukraine has led to heightened uncertainty about the economic outlook. Norway’s trade with the two countries is small, but shocks caused by the war are also affecting the Norwegian economy. There is substantial uncertainty associated with electricity and commodity prices. If prices rise more than assumed, for example electricity prices, private consumption may turn out weaker. At the same time, high electricity prices provide substantial government revenue, which may result in higher government transfers than assumed.
The projections are based on the assumption that heightened uncertainty as a result of the war dampen household consumption somewhat and that a number of business investment projects are postponed, but the extent and duration of the effects are uncertain. If the war and sanctions dampen activity among Norway’s trading partners more than projected in this Report, foreign trade may weaken more than expected. On the other hand, the effects of the uncertainty may prove less pronounced and the global recovery stronger than assumed.
The pandemic remains a source of uncertainty regarding the economic outlook. High infection rates now have little constraining effect on economic activity, but if case numbers were to rise beyond health service capacity, measures could be reintroduced that constrain activity. There is also a risk that new virus variants may require containment measures.
It is also uncertain how households will respond to higher interest rates. After a period of very low interest rates and high household debt ratios, there is a risk that the impact of higher interest rates on consumption will be stronger than assumed.
1 Period: January 2020 – June 2022. Projections from February 2022.
2 Period: November 2021 – August 2022. Growth past three months and expected growth the next six months.
3 Period: 2016 Q1 – 2025 Q4. Projections from 2019 Q4 for MPR 4/19, 2021 Q4 for MPR 4/21 and 2022 Q1 for MPR 1/22.
4 Period: 2016–2025. Projections from 2022. Petroleum investment includes investment in foreign shipping.
5 Period: 2012–2025. Projections from 2022. Income and expenditures as share of household disposable income. Growth in real household disposable income equals growth in household disposable income minus inflation.
6 Period: 2016–2025. Projections from 2022.
7 Period: 2016–2025. Projections from 2022–2025. Data for 2016–2020 from Statistics Norway’s investment survey and deflated by the price index for petroleum investment in the national accounts. The price index is projected to rise by 3% between 2021 and 2022, and by 2% in 2023.
3.2 Labour market
Labour market improves
Labour market conditions have improved substantially over the past year. Employment rose rapidly through the second half of 2021, and the number of employed is now higher than before the pandemic (Chart 3.8). Unemployment has declined and is lower than in February 2020.
Chart 3.8 Higher employment than before the pandemic8 Employment. In thousands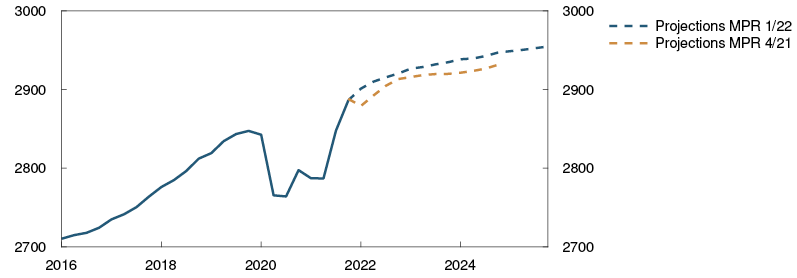
In the second half of 2021, employment rose, particularly in accommodation and food services, owing to the unwinding of a number of containment measures through autumn. In 2021 Q4, employment growth was solid in most sectors. The number of temporary foreign workers in Norway has increased gradually since summer but remains below pre-pandemic levels. In January, overall employment rose further, despite the fall in sectors affected by containment measures.
Through much of 2021, the rise in employment was faster than the decline in unemployment, as more people who had been outside the labour market found work. In 2021 Q4, the employment rate increased to the highest level in more than ten years (Chart 3.9).
Chart 3.9 Growth in labour force9 Employed as a proportion of the population (15–74 years). Seasonally adjusted. Percent
Towards the end of 2021, the spread of the Omicron variant led to heightened uncertainty about labour market developments further ahead. Owing to stricter containment measures and a large number of furlough notices, a substantial short-term rise in unemployment was projected. According to weekly data from the Norwegian Labour and Welfare Administration (NAV), furloughs increased somewhat in the second half of December, but as early as from mid-January, the number of furloughed workers started to fall again. At the end of the month, unemployment was only slightly higher than in December.
Unemployment rose considerably less than projected in the December Report, as containment measures were less extensive and of shorter duration than expected. The Government’s wage support scheme, adopted in December 2021, likely also helped limit the impact of the measures on the labour market. So far, the Norwegian Tax Administration’s data for December indicate moderate use of the wage support scheme. Nevertheless, the scheme may have influenced furlough decisions among a larger number of firms than those who used the scheme in December.
In February, unemployment continued to fall, to around 2.1% of the labour force or 58 200 unemployed adjusted for normal seasonal variations, which is lower than prior to the pandemic and the lowest level since 2008. A large number of furloughed workers returned to work in February, but the number of furloughed workers is still higher than before the pandemic.
Strong demand for labour
Following the reopening of society in autumn 2020, labour demand has risen to a high level. Half of Norges Bank’s Regional Network contacts now report that labour shortages are constraining production, which is higher than in November and the highest share since before the financial crisis. The number of vacancies increased in 2021 to the highest level measured in Statistics Norway’s job vacancy survey, which goes back to 2010 (Chart 3.10). The level held steady through 2021 Q4. According to NAV statistics, the number of new job vacancies continued to rise in January and February 2022.
Chart 3.10 High number of job vacancies10 Job vacancies as a share of all jobs. Percent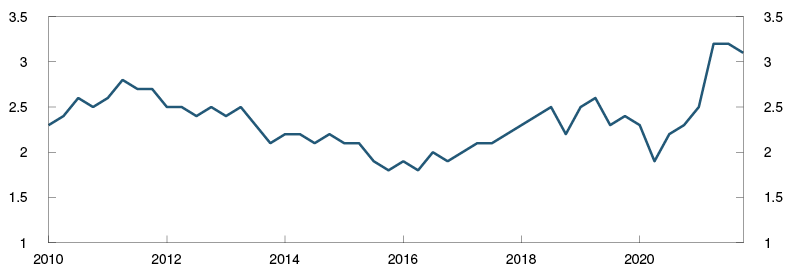
Labour shortages probably reflect a number of extraordinary pandemic-related conditions. The rise in the number of new job vacancies has largely been in services, a sector severely affected by containment measures. There are still considerably fewer temporary foreign workers in Norway than at the end of 2019. The increase in job vacancies was strongest in sectors where there are still fewer temporary foreign workers, particularly in construction, but also in hospitality and health and social services. At the same time, there also appears to be a limited supply of labour in other sectors. In February, Regional Network contacts reported labour shortages across a number of different occupational groups.
Through the first part of the pandemic, more employment contracts were terminated and there were fewer new hires than normal (Chart 3.11). Over the past year, the number of new contracts returned to a normal level, while the number of terminated contracts is substantially lower than earlier. The low level in 2021 is partly due to the termination of many employment contracts in 2020, but may also be related to the pandemic, financial support measures and lenient furlough rules. If the number of terminations remains at a low level, labour market efficiency may be reduced making it difficult for employers to recruit the necessary labour.
Chart 3.11 Fewer terminated employment contracts than before the pandemic11 New hires and terminated employment contracts. In thousands
Further improvement in the labour market
Unemployment is expected to continue to decline in the coming months owing in part to the removal of the last containment measures in February and strong labour demand. Unemployment is projected to decline to 1.8% in the course of the year, in pace with a pick-up in economic activity, before rising slightly again towards the end of the projection period.
Employment is projected to rise further in the near term. In February, Regional Network contacts reported continued brisk employment growth in recent months and expectations of a stronger rise in the coming months. In particular service sector contacts expected higher employment growth ahead, but oil service contacts also expected a solid rise in the near term. In the projection, a cyclical peak is reached in the second half of 2022. Employment growth thereby slows towards the end of the year and then remains moderate over the latter part of the projection period. The decline in unemployment to a low level pulls down on employment growth ahead. The war in Ukraine is expected to lead to a rising number of refugees in Norway, some of whom will likely join the Norwegian labour market after a period.
The increase in the number of temporary foreign workers is projected to continue. An introduction of a ban on contract labour in construction in the Oslo fjord area indicates that the number of short-term workers will not fully return to the pre-pandemic levels over the projection period.
The projections for the labour market are uncertain. The supply of foreign labour may not pick up as much as projected. There is also uncertainty about the number of refugees from Ukraine, and how many will transition to employment, and how fast. At the same time, the pandemic remains a source of uncertainty. If any new variants emerge that also require containment measures, unemployment could turn out higher than projected.
Chart 3.12 Unemployment will continue to decline12 Registered unemployed as a share of the labour force. Seasonally adjusted. Percent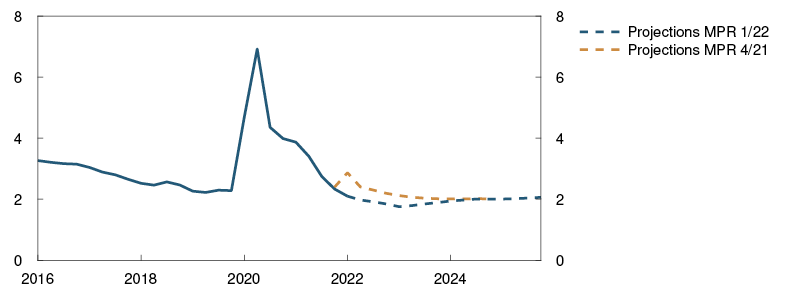
8 Period: 2016 Q1 – 2025 Q4. Projections for employment from 2021 Q4 for MPR 4/21 og fra 2022 Q1 for MPR 1/22.
9 Period: 1994 Q1 – 2021 Q4. Employed persons are defined as quarterly national accounts (QNA) less non-residents
10 Period: 2010 Q1 – 2021 Q4
11 Period: 2017 Q1 – 2021 Q4. Change from the same quarter the year before. Terminated employment contracts refers to new hires and terminations in the employment and wage statistics
12 Period: 2016 Q1 – 2025 Q4. Projections from 2021 Q4 for MPR 4/21 and 2022 Q1 for MPR 1/22.
Higher level of capacity utilisation
In the Bank’s assessment, capacity utilisation was above a normal level at the end of 2021 after rising since spring of that year. Mainland GDP growth was high through autumn, and unemployment has fallen sharply. Regional Network contacts report increasing capacity constraints, and other indicators also suggest that capacity utilisation has increased so far in 2022.
In the Bank’s assessment, the output gap is now just above 1% (Chart F in the “Monetary policy assessment”). The projection for capacity utilisation in 2022 Q1 is higher than in the December 2021 Report, as the impact of higher infection rates and containment measures on output and employment proved less severe than expected and there is otherwise high demand in the Norwegian economy. Unemployment is lower than projected in December and is now below the estimated normal level. It also appears that GDP growth in the first half of 2022 will be stronger than projected in December.
Labour demand is high. The share of Regional Network contacts reporting that labour shortages are constraining output is the highest since October 2007. At that time, the Bank considered the output gap to be very positive. Network indicators of capacity utilisation suggest that the output gap is around 2% and higher than currently estimated by the Bank (Chart 3.A). Several municipal and hospital sector contacts cite the large number of absences due to pandemic-related sickness as a constraint. Private sector contacts report this as less of a constraint, with labour shortages having increased somewhat less in that sector. According to weekly figures from the Norwegian Labour and Welfare Administration (NAV), pandemic-related sickness absences have fallen sharply since mid-March, suggesting that the labour shortages due to high sickness absence have decreased somewhat since the February survey.
Chart 3.A High capacity utilisation among businesses in the Regional Network1 Percent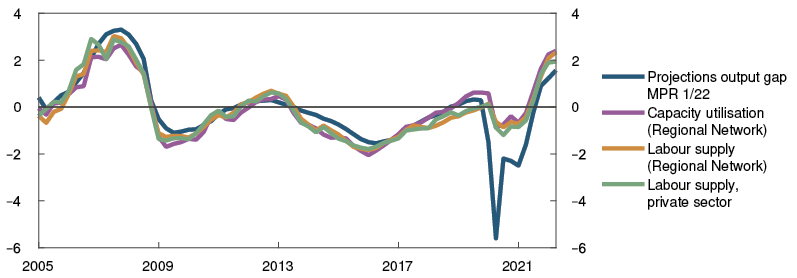
The high number of job vacancies is also an indication of a substantial shortage of labour. Earlier in the pandemic, the share of unemployed per job vacancy was higher than previously (Chart 3.B),2 which may indicate that there was a larger mismatch between labour supply and demand. This share has decreased in recent months, suggesting that the labour market is now functioning more efficiently. The rapid decline in unemployment suggests that the factors reducing labour market efficiency are becoming less prominent. This implies that the level of unemployment consistent with a normal level of capacity utilisation, ie with a neutral effect on wage growth, is falling. This is occurring slightly earlier than envisaged in December. This level is estimated to have been around 2½% in the past couple of years and is expected to decrease to about 2¼% over the coming year, which is the same as the pre-pandemic level.
Chart 3.B The labour market appears to be functioning more efficiently3 Share of the labour force. Percent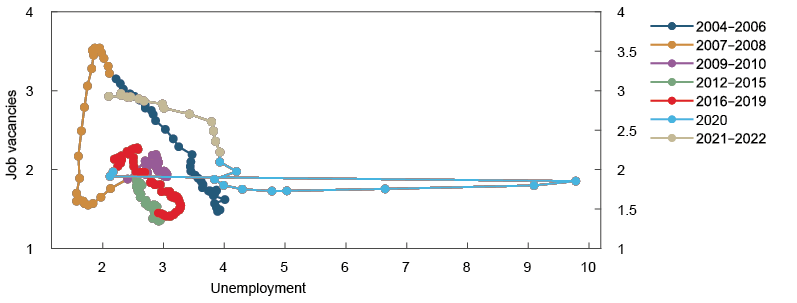
Norges Bank’s system of models for estimating the output gap takes account of developments in mainland GDP, unemployment, wage growth and domestic inflation (Chart 3.C). The calculations cover the period to 2021 Q4. The system of models shows a substantial rise in capacity utilisation in recent quarters in line with the assessments in the December Report but indicates a somewhat lower level of capacity utilisation than the Network indicators.
Chart 3.C Model estimates show a continued increase in capacity utilisation4 Percent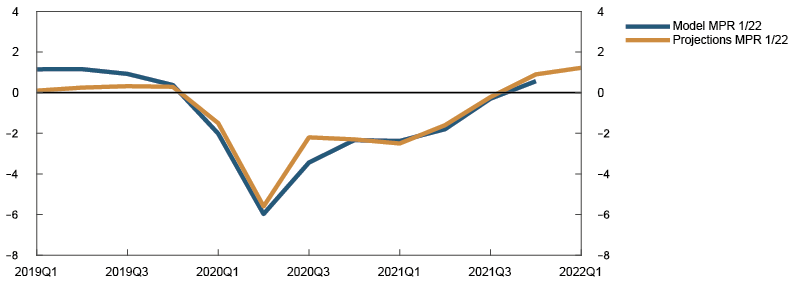
Capacity utilisation is projected to continue to rise to the end of 2022, reflecting expectations of continued strong growth in the mainland economy in 2022, coupled with a further decline in unemployment and prospects for higher wage growth. Further ahead, capacity utilisation is expected to decline gradually but remain above a normal level to the end of the projection period. The Bank expects potential output growth of around 1¼% ahead, reflecting trend employment growth of ½% and trend productivity growth of ¾%.
The Bank’s output gap estimates are uncertain. Regional Network contacts report higher capacity utilisation than currently estimated by the Bank. On the other hand, the Bank may be underestimating the potential capacity of the economy and the level of employment, and pressures in the economy may not be as strong as the projections suggest, as also seems to be indicated by Regional Network expectations of strong activity growth in the period ahead, despite extensive capacity constraints.
1 Period: 2015 Q1 – 2022 Q1. The capacity utilisation indicators in the Regional Network have been converted to a production gap form by means of a simple model calculation.
2 For more details, see box “Increased mismatch between labour supply and demand” on p. 38 of Monetary Policy Report 3/21.
3 Period: January 2004 – February 2022. The monthly time series for the stock of vacancies in Chart 3.B is taken from Kostøl (2017) [1]. Here, microdata for vacancies from FINN.no and NAV are combined to develop a monthly indicator of the stock of vacancies for the period 2004–2016. Developments in the time series are relatively similar to Statistics Norway’s business survey in the years they overlap. From 2017 to 2018, we have used information about changes in Statistics Norway’s statistics to link the series from Kostøl with NAV’s monthly statistics, as a result of a major break in NAV’s statistics before 2018. The overall series can thus only be used to interpret developments over time. The levels cannot be directly linked to published statistics. 1) Kostøl, A. (2017) ”Causes and Consequences of Labor Market Mismatch and the Rise in Disability Insurance Receipt”, doctoral dissertation at the University of Bergen.
4 Period: 2019 Q1 – 2022 Q1. Output gap measures the percentage difference between mainland GDP and projected potential mainland GDP. In the model-based calculations of the output gap, information on GDP, employment, unemployment, wage growth, inflation, house prices and credit is included. For a more detailed description of the models see Working Paper 7/2020.
3.3 Costs and prices
Higher wage growth
The tightening of the labour market through 2021 has driven up wages, with annual wage growth reaching 3.5% in 2021. This was higher than projected in the December Report and appreciably higher than the wage norm (Chart 3.13). A rise in bonuses and irregular wage payments contributed to higher-than-expected wage growth.
Chart 3.13 Higher wage growth than expected13 Annual wage growth. Percent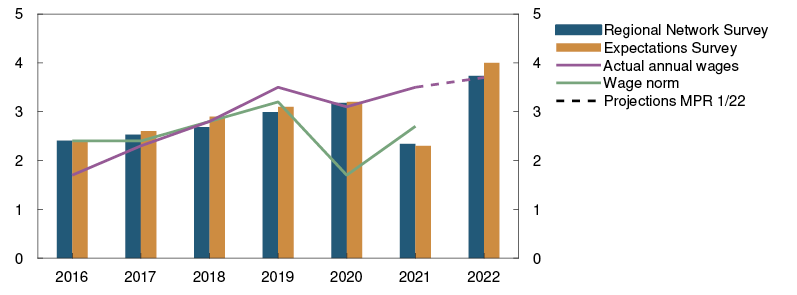
Wage expectations for 2022 have increased by about ½ percentage point since the December Report. In February, Regional Network contacts expected wage growth of 3.7% in 2022. According to Norges Bank’s Expectations Survey in February, the social partners overall expect wage growth of 4.0% in 2022. High labour demand and low unemployment will likely lead to higher wage growth.
Higher prices for electricity and imported goods are driving up consumer price inflation and point to stronger wage growth. Higher prices for intermediate goods may, however, reduce business profitability, which in isolation may restrain wage growth. The Expectations Survey indicates continued improvement in business profitability ahead, but to a lesser extent than at the time of the December Report (Chart 3.14). It is assumed that government support to compensate for the surge in electricity prices will continue in the period to March 2023. This will dampen the rise in prices faced by households and also pull down on wage growth.
Chart 3.14 Continued improvement in profitability14 Change in operating margins according to Regional Network contacts and the Expectations Survey
Many of those who are now joining the workforce are paid at below average wages, which in isolation will pull down on the average wage level somewhat in 2022 (see box below on composition effects on wage growth). Measured wage expectations likely capture to a limited degree that composition effects may pull down wage growth in 2022. Wage growth is projected at 3.7% in 2022.
High capacity utilisation suggests that wage growth will rise ahead. Experience shows that high oil and gas prices boost activity and strengthen mainland business profitability, which in turn may push up wage growth. Wage growth is projected to rise to 4.0% in 2023 (Chart 3.15), slowing a little thereafter as the output gap narrows.
Chart 3.15 Prospects for high wage growth15 Annual wage growth. Percent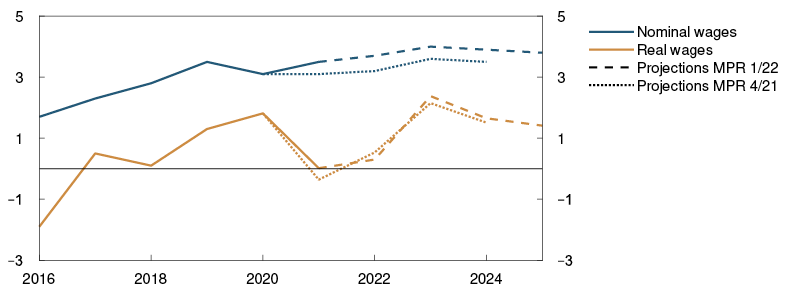
Composition effects on wage growth
Many of those who lost their jobs on account of the coronavirus outbreak in 2020 earned lower-than-average wages. The result was a higher average wage level. Owing to such composition effects, overall measured wage growth between 2019 and 2020 turned out higher than the rise in pay of individual employees who were in work all year. When a rising number of those who lost their jobs return to work, the converse occurs. In 2021, employment fell at the beginning of the year, before rising markedly towards the end of the year. For 2021 as a whole, composition effects were likely small. The rise in employment among low-wage employees in late 2021 and into 2022 will likely push down the average wage level in 2022 compared with the average in 2021. The size of the composition effects is uncertain.
Higher inflation
CPI inflation has varied widely as a result of high volatility in electricity prices in recent years. Annual CPI inflation was 1.3% in 2020 and 3.5% in 2021. CPI inflation picked up sharply towards the end of 2021 but has fallen back somewhat in 2022. In February, 12-month CPI inflation was 3.7%, which is slightly higher than projected in the December Report. Government compensation for higher electricity prices has pulled down electricity prices in the CPI from December 2021, and the scale of support turned out to be somewhat larger than assumed in the December projections.
Chart 3.16 Inflation has risen16 CPI and indicators of underlying inflation. Twelve-month change. Percent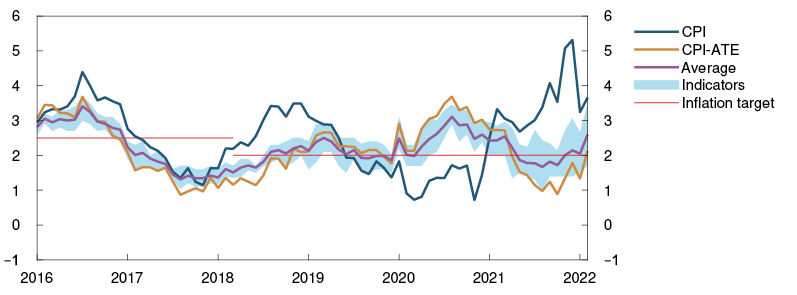
Underlying inflation has picked up in recent months. The CPI adjusted for tax changes and excluding energy products (CPI-ATE) increased by 2.1% in the year to February 2022, which was higher than projected. Other indicators suggest that underlying inflation is higher, which implies a pick-up in CPI-ATE inflation ahead. The 12-month average rise in indicators of underlying inflation was 2.5% in February (see "Indicators of underlying inflation in Norway").
Imported consumer goods inflation has picked up recently and is higher than projected. The rise partly reflects the sharp rise in international freight rates and imported consumer goods prices (Chart 3.17).
Chart 3.17 Stronger external price impulses17 Producer prices for imported consumer goods with freight rates. Annual change. Percent
Some of the rise in global prices reflects high demand and pandemic-induced disruptions to global supply chains. The invasion of Ukraine at the end of February has led to a further increase in energy, metal and food prices (see "Sharp rise in commodity prices" for a further discussion). This will also push up domestic inflation (Chart 3.18). Since the December Report, European container freight rates have fallen in line with expectations. Given the war in Ukraine and new lockdowns in China, further normalisation of freight rates may take somewhat longer than expected in December. Imported consumer goods prices have been higher than projected, and the projections have been revised up ahead. Further out, a normalisation of freight rates and commodity prices pulls down imported inflation. In isolation, the recent appreciation of the krone is expected to curb inflation.
Chart 3.18 Prospects for higher inflation18 Domestically produced goods and services and imported goods in the CPI-ATE. Four-quarter change. Percent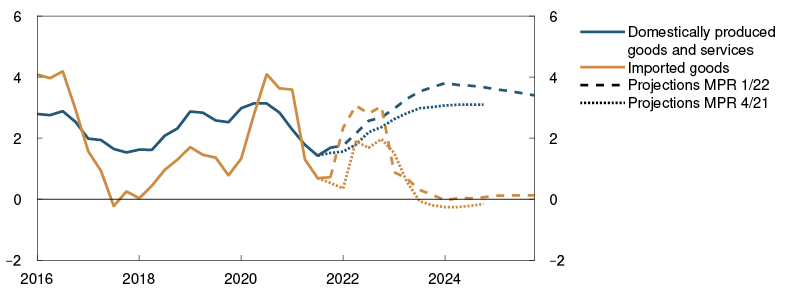
The rise in prices for domestically produced goods and services has also accelerated and been higher than projected, partly owing to higher prices for commodities and other intermediate goods, and pushes up on domestic price inflation somewhat in the near term. As a result of high capacity utilisation and higher wage growth, domestic inflation is expected to pick up over the next couple of years. Overall, CPI-ATE inflation is projected at close to 3% at the end of 2022, before slowing and running just above 2% thereafter.
Electricity prices are expected to remain at historically high levels in the near term, before falling sharply through spring. Government support to compensate for the surge in electricity prices will substantially dampen the effect on the CPI. CPI inflation is projected to rise slightly in the near term and then decline, resulting in annual CPI inflation of 3.4% in 2022. CPI inflation is projected to be lower in 2023, before moving up to just over 2%.
Inflation expectations one and two years ahead, as measured by Norges Bank’s Expectations Survey, have risen recently. In the longer term, inflation expectations are lower, but are somewhat above 2%.
Prospects for higher real wage growth ahead
Wage growth was the same as CPI inflation in 2021, with real wages remaining unchanged. Overall real wage growth is projected to be moderate in 2022, rising to about an annual average of 1¾% in 2023–2025. The relatively large range of variation in wage growth expected over the projection horizon must be seen in the context of composition effects on wage growth this year and large swings in energy prices.
Considerable uncertainty surrounding price and wage inflation
The pandemic and the invasion of Ukraine have resulted in substantial changes in electricity and commodity prices. There is high uncertainty regarding future developments in those prices. The effect on domestic price and wage inflation is also uncertain.
The impact of higher prices on wage growth ahead is also uncertain. The faster rise in inflation may have a stronger impact on wage growth than has been the case in the past 20 to 30 years, and upon which our projections are based. If wage growth were to rise higher, this could in turn lead to higher inflation. There is also a risk that labour shortages may lead to sharply higher wage growth. On the other hand, business profitability may prove weaker ahead than assumed, which could then pull down wage growth.
13 Period: 2016–2022. Annual wages: Actual wage growth from Statistics Norway. Norges Bank’s projections for 2022. Norges Bank’s Expectations Survey: Social partners’ wage growth expectations for the current year as measured by Norges Bank’s Expectations Survey in Q1 each year. Regional Network survey: Expected annual wage growth for 2022 as reported in Q1 each year.
14 Period: 2007 Q1 – 2022 Q1. Regional Network: Change in operating margins compared to the same three months the previous year. Index from -5 (large fall) to +5 (strong growth). Expectations Survey: Profitability the next 12 months. Share of enterprises that report projections of higher profitability minus the share that report projcetions of lower profitability.
15 Period: 2016–2025. Projections from 2022. Real wages: Nominal annual wage growth less CPI inflation.
16 Period: January 2016 – February 2022. CPI-ATE: CPI adjusted for tax changes and excluding energy products. Average: Average value of 12-month change for other indicators of underlying inflation (CPIM, CPIXE, 20% trimmed mean, weighted median, CPIXV and CPIF). Indicators: Highest and lowest 12-month change for other indicators of underlying inflation.
17 Period: 2020–2025. Projections from 2021 for MPR 4/21 and from 2022 for MPR 1/22.
18 Period: 2016 Q1 – 2025 Q4. Projections from 2021 Q4 in MPR 4/21 and 2022 Q1 in MPR 1/22. CPI-ATE: CPI adjusted for tax changes and excluding energy products.
Indicators of underlying inflation in Norway
The primary objective of monetary policy is to maintain monetary stability by keeping inflation low and stable. The target variable is the annual rise in the consumer price index (CPI). Inflation, as measured by the CPI, can fluctuate considerably from month to month and is often affected by large movements in individual price components. An important reason for these fluctuations is energy prices, which have recently risen sharply. The result is that CPI inflation is now well above the rise in prices for most of the other price components. Since the policy rate affects inflation with a lag, the Bank seeks to look through temporary fluctuations in CPI inflation and orient monetary policy based on measures of underlying inflation. It is therefore valuable to look at price indexes that try to filter out high-frequency variability in CPI inflation.
There is no clear definition of underlying inflation, and in practice it can be difficult to distinguish between transitory and more persistent changes in inflation. However, there are certain characteristics that define a good indicator of underlying inflation. First, a good indicator of underlying inflation should not deviate from trend CPI inflation over time. Persistent deviations from the CPI may be evidence that the indicator does not capture actual developments in the prices included in the CPI. Second, a good indicator should look through transitory variability in inflation. Furthermore, a deviation between the CPI and a good underlying indicator should provide information about where movements in the CPI can be expected in the near term. This is because differences between the indicator and CPI inflation should be due to transitory disturbances, which normalise relatively quickly.
Both internationally and in Norway, a variety of indexes are used in attempts to measure underlying inflation. The consumer price index adjusted for energy prices and excluding tax changes (CPI-ATE) is the best known and established index in Norway and is key to the Bank’s interpretation of the inflation outlook and monetary policy communication. The Bank also publishes projections for CPI-ATE inflation. A challenge posed by the CPI-ATE is that it does not capture permanent changes in energy prices relative to other goods, since energy prices are completely excluded from the index. If energy prices over time increase more than other consumer prices, eg owing to the green transition and changes in energy policy, the CPI-ATE may underestimate trend inflation.
In periods with a wide gap between CPI and CPI-ATE inflation, it may be useful to look at other measures of underlying inflation in the analyses of inflation and the inflation outlook. A broad set of indicators of underlying inflation is used in Norway (Chart 3.D).1
Chart 3.D Increased spread among indicators of underlying inflation2 Twelve-month change. Percent
Like the CPI-ATE, many of the indicators exclude a fixed set of subcomponents. CPI-sticky prices excludes the subcomponents where prices are changed most frequently, while the CPIXV excludes the eight most volatile subcomponents. In the CPIXE indicator, current energy prices are replaced by an estimated energy price trend. The CPIXE has recently moved up considerably, and the 12-month rise is now 3.5%. The advantage of the CPIXE is its ability to capture underlying energy price trends. In practice, it has proved difficult to find suitable methods for estimating the energy price trend in real time. This is why the Bank stopped using the CPIXE as its main indicator of underlying inflation almost 10 years ago. Nevertheless, the Bank is of the opinion that the CPIXE is able to capture useful information and monitors it as part of the set of indicators of underlying inflation.
For other indicators, current developments determine which subcomponents are excluded from month to month. For example, the 20% trimmed mean indicator removes the subcomponents with the highest and lowest rise in prices in the month in question, while the weighted median shows only the change in the subcomponent that at the time in question shows the median price rise. For a third group of indicators, inflation is estimated using model-based methods. In the CPI-common indicator, a factor model is used to extract a common trend across all subcomponents, while in the CPIM, a model-based method assigns new weights to all subcomponents based on the subcomponents’ ability to forecast the CPI one month ahead.
The gap between these indicators has widened in recent months, and the CPI-ATE is among the indicators showing the lowest rise. Econometric tests of the properties mentioned above show that none of the individual indicators is significantly better than the others. However, the information in the set of indicators as a whole, for example as measured by an average, can provide a slightly clearer overall picture of underlying inflation. The average of all the individual indicators has generally performed well over time. The average indicator tracks trend CPI inflation more closely over time, is less volatile and has better forecasting performance than any of the individual indicators. This indicator lies significantly below the CPI but indicates that underlying inflation is slightly higher than shown by the CPI-ATE and somewhat above the 2% target (Chart 3.E).
Chart 3.E Average of indicators lies close to the CPI-ATE3 Twelve-month change. Percent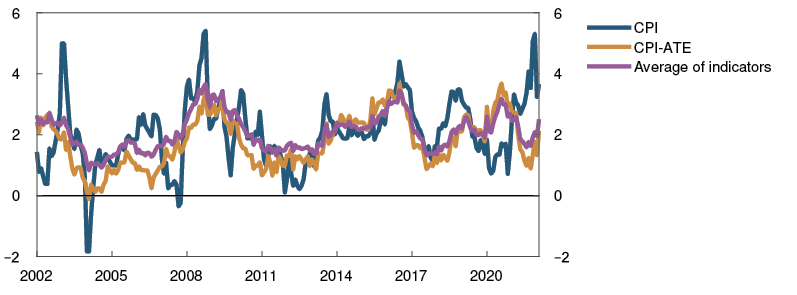
Norges Bank conducts monetary policy under a flexible inflation targeting regime with the aim of stabilising CPI inflation close to target over the medium term. To do this, we use projections for CPI-ATE inflation and energy prices, for example. A good understanding of underlying inflation provides useful insight into the Bank’s inflation projections. Developments in other indicators of underlying inflation are part of the reason why CPI-ATE inflation is now projected to pick up in 2022. CPI inflation is being affected by high energy prices and is expected to remain higher than underlying inflation in the near term.
1 See “Indicators of underlying inflation in Norway”. Staff Memo 13/2017. “Norges Bank’s Monetary Policy Handbook”. Norges Bank Papers 1/2022.
2 Period: January 2002 – February 2022.
3 Period: January 2002 – February 2022.
4 Monetary policy analysis
The policy rate was raised from 0.5% to 0.75% at the Committee meeting on 23 March. Based on the Committee’s current assessment of the outlook and balance of risks, the policy rate will most likely be raised further in June. The policy rate forecast indicates a gradual rate rise to around 2.5% at the end of 2023.
The forecast implies a tighter monetary policy stance than in the December 2021 Monetary Policy Report. Prospects for higher capacity utilisation and higher price and wage inflation ahead than envisaged earlier suggest a faster rate rise.
The forecasts are uncertain. If the outlook or the Bank’s assessment of economic relationships changes, the policy rate forecast will also be adjusted.
4.1 Objectives and recent developments
Low and stable inflation
The primary objective of monetary policy is low and stable inflation. The operational target is annual consumer price inflation of 2%. Between the introduction of the inflation target in 2001 and March 2018, the target was 2.5%. Annual consumer price inflation has over time run close to 2% since 2001 (Chart 4.1).
Chart 4.1 Average inflation close to the 2% target1 Consumer price index (CPI). Four-quarter change. Percent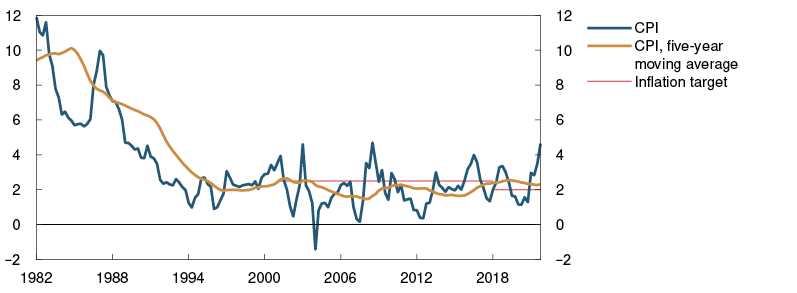
Inflation targeting shall be forward-looking and flexible so that it can contribute to high and stable output and employment and to countering the build-up of financial imbalances. The monetary policy strategy is discussed further in "Norges Bank’s monetary policy strategy".
Somewhat less expansionary monetary policy
In the latter half of 2021, the policy rate was raised to 0.5 in two steps, after having stood at 0% since spring 2020. The low policy rate has resulted in a very low money market rate, both in nominal and real terms (Chart 4.2).
Chart 4.2 Higher real interest rate2 Three-month money market rate and real interest rates. Percent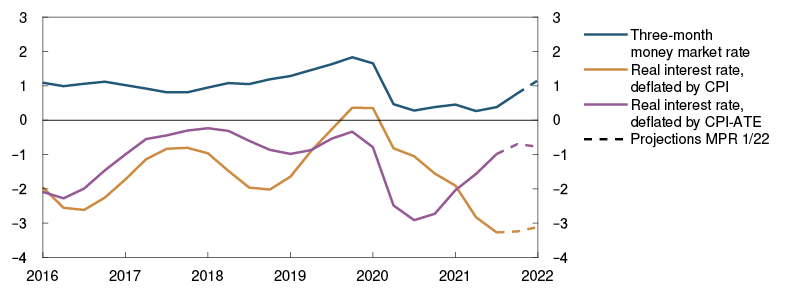
To assess the degree of monetary accommodation, the interest rate level is compared with what is estimated to be a neutral level. The neutral rate of interest is the rate that is consistent with balanced developments in the economy in the medium term, and the monetary policy stance is assumed to be expansionary as long as the rate is below its neutral level. Both nominal and real interest rates have implications for the tightness of monetary policy. With inflation expectations anchored close to the inflation target, the neutral level of the policy rate is estimated at close to 1.7% (see box in Monetary Policy Report 2/21). The neutral real money market rate, ie the money market rate adjusted for inflation, is estimated at close to 0%.
In recent months, the money market rate has moved up. This implies that monetary policy is still expansionary, but somewhat less so than previously. Developments in the real interest rate adjusted for CPI-ATE inflation suggest that monetary policy has gradually become less expansionary over the past year. CPI inflation is being affected by the rapid rise in energy prices. This means that the real interest rate adjusted for CPI inflation has recently been lower than the real interest rate adjusted for CPI-ATE inflation, but it, too, is expected to rise in the period ahead.
4.2 New information and new assessments
Model-based interpretation of new information
To shed light on how new information influences the economic outlook, new information and assessments are incorporated into the modelling system, while conditioning on the policy rate path in the December Report. In this exercise, the main focus is on the outlook for capacity utilisation and inflation, two important considerations to which the Committee gives weight in the conduct of monetary policy.
Capacity utilisation in the Norwegian economy is assessed as being higher than assumed in the December Report. This reflects, among other things, the lower-than-expected economic impact of the most recent infection wave. In the period ahead, a further increase in capacity utilisation is expected, driven in part by strong growth in household consumption and business investment. Growth is restrained by a slight downward revision of growth among trading partners. The output gap projection conditioned on an unchanged policy rate path will be higher than projected in December throughout the projection period (Chart 4.3).
Chart 4.3 Prospects for higher capacity utilisation3 Estimated output gap. Conditioned on new information concerning economic developments and the policy rate forecast in MPR 4/21. Percent
CPI-ATE inflation has edged up recently after having run below 2% through the latter half of 2021. Imported inflation has picked up and has been higher than expected, driven by higher global inflation and high freight rates. Wage growth turned out to be higher than expected in 2021, and the wage growth projections for 2022 have been revised up on the back of growing labour shortages and higher wage expectations. Conditioned on an unchanged policy rate path, the inflation projections have been revised up substantially compared with the projections in the December Report (Chart 4.4).
Chart 4.4 Prospects for higher inflation4 CPI-ATE. Projections conditioned on new information concerning economic developments and the policy rate forecast in MPR 4/21. Four-quarter change. Percent
The model exercise indicates a need for a tighter monetary policy in order to limit the rise in inflation and help bring inflation down towards target.
A simple rule implies a higher policy rate
A simple estimated rule based on Norges Bank’s previous policy rate setting summarises the historical pattern of monetary policy reaction. Using the change in the capacity utilisation and inflation projections provides an indication of how the rate path has previously reacted to similar news (see box in Monetary Policy Report 4/21).
Owing to the upward adjustment of the inflation and output gap projections, the simple rule now implies a substantially higher policy rate in the near term than implied by the rule with the projections from the December Report (Chart 4.5).
Chart 4.5 Simple rule implies a higher policy rate5 Percent
Forward rates indicate a higher policy rate path
Forward money market and bond rates can provide an indication of expectations of future policy rate changes. Changes in market rates can indicate how market participants interpret new information and how they believe Norges Bank will respond. Even though forward rates can be volatile, they can function as a cross-check of whether monetary policy is in line with Norges Bank’s previous forward guidance and response pattern.
Estimated forward rates are higher than in December for the entire projection period (Chart 4.6). Developments in forward rates since the December Report suggest that the market interprets the sum of new information as an indication of higher interest rates ahead.
Chart 4.6 Estimated forward rates have risen6 Percent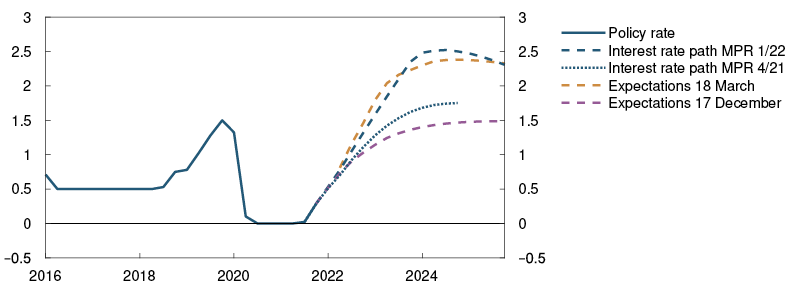
Policy rate to rise further
At the Committee meeting on 23 March, the policy rate was raised from 0.5% to 0.75%. Moreover, the Committee expects that the policy rate will most likely be raised further in June. In line with the Committee’s assessment, the policy rate path implies a further rise ahead. At the end of 2023, the policy rate is projected to be around 2.5% (Chart 4.7). This is above what is estimated to be a neutral policy rate. At the end of the projection period the policy rate is projected to decline to 2.3%. The policy rate path has been revised up since the December Report.
Chart 4.7 Towards a contractionary monetary stance7 Percent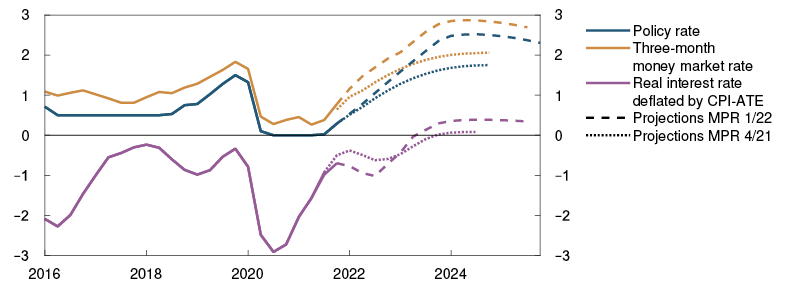
Higher capacity utilisation, rising wage growth and stronger external price impulses will push up inflation ahead. This suggests that it is now appropriate to raise the policy rate to limit the rise in inflation and help bring inflation back down towards target. Raising the policy rate is also consistent with the simple rule (Chart 4.5) and market expectations (Chart 4.6). Market-based policy rate expectations now lie close to our policy rate forecast over the entire projection horizon. With higher interest rates in the next few years, capacity utilisation will decline towards a normal level.
The policy rate path is the Bank’s forecast of the policy rate for the coming years and expresses the Committee’s trade-off between monetary policy objectives. If the economic outlook, the balance of risks or the assessment of the functioning of the economy change, the policy rate may prove to be different from the one indicated by the policy rate path.
Both nominal and real interest rates have implications for how monetary policy affects the Norwegian economy. The forecasts for the policy rate and the nominal money market rate imply that monetary policy will be less expansionary, and eventually contractionary. The projected paths of both the nominal and real interest rate suggest that monetary policy will be contractionary from 2023 to the end of the projection period.
The real money market rate is expected to be somewhat lower in the near term than projected in the December Report, since the inflation projections in the coming period have been raised more than the policy rate forecast. Further out, the policy rate path has been raised more than the inflation projections, and the real money market rate is thus projected to be higher than in the December Report through most of the projection period.
3 Period: 2016 Q1 – 2025 Q4. The output gap measures the percentage deviation between mainland GDP and projected potential mainland GDP.
4 Period: 2016 Q1 – 2025 Q4. Projections from 2021 Q4 for MPR 4/21 and from 2022 Q1 for MPR 1/22. CPI-ATE: CPI adjusted for tax changes and excluding energy products.
5 Period: 2016 Q1 – 2022 Q4. Projections from 2021 Q4 for MPR 4/21 and 2022 Q1 for MPR 1/22.
6 Period: 2016 Q1 – 2025 Q4. Projections from 2021 Q4 for MPR 4/21 and 17 December. Projections from 18 March 2022 for MPR 1/22 and 18 March. Expectations since MPR 4/21 show highest and lowest policy rate expectations in the period between 17 December and 18 March.
7 Period: 2016 Q1 – 2025 Q4. Projections from 2021 Q3 for MPR 4/21 and 2021 Q4 for MPR 1/22 for the real interest rate calculated with the CPI-ATE. Projections from 2021 Q4 for MPR 4/21 and 2022 Q1 for MPR 1/22 for the policy rate and money market rate.
4.3 Decomposition of changes in the rate path
The decomposition shown in Chart 4.8 illustrates the main drivers behind the change in the rate path from the December Report. The bars show contributions to changes in the rate path based on our main model NEMO, and the broken black line shows the sum of the bars. The solid line shows the actual change in the rate path.
Chart 4.8 A number of factors pull up the rate path8 Cumulative contribution. Percentage points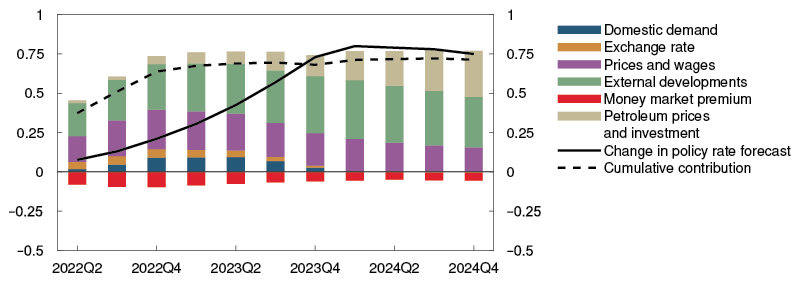
Inflation prospects among Norway’s trading partners have led to a rise in policy rate expectations. This suggests in isolation a weaker krone and pulls up the rate path. Higher trading-partner inflation reflects higher energy prices and bottlenecks, among other factors. This pushes up imported inflation, which will pass through to higher domestic inflation. This also pulls up the rate path. On the other hand, the growth projections for trading partners have been revised down a little. On balance, factors relating to external developments imply a higher rate path (green bars).
Underlying inflation has been higher than in the December Report. Wage growth in 2021 turned out to be higher than projected in December, and the wage growth projections for 2022 have been revised up. This will push up inflation ahead. Prices and wages therefore pull up the rate path throughout the projection period (purple bars).
Oil and gas spot and futures prices are sharply higher than in the December Report. This implies a higher rate path. In the current situation, the rise in petroleum prices is expected to have less impact on the Norwegian economy than observed in earlier periods, particularly because investment plans for the coming years have already been scaled up in response to temporary petroleum tax changes. Petroleum investment projections have been revised down for the next years, but later in the projection period, investment is projected to be broadly the same as in the December Report. Nevertheless, overall, petroleum prices and investment pull up the rate path (beige bars).
Higher petroleum prices have contributed to a stronger krone than projected in the December Report. However, according to the modelling system, the krone has appreciated less than developments in petroleum prices and the interest rate differential against trading partners would imply. Developments in the krone exchange rate therefore pull up the rate path slightly (orange bars).
Capacity utilisation is projected to be higher than in the December Report. This is because activity in the Norwegian economy is now higher than assumed in December and because investment demand is expected to pick up faster than anticipated earlier. Factors relating to domestic demand pull up the rate path (dark blue bars).
Margins on household and corporate loans have moved broadly in line with expectations, but the money market premium has risen and is expected to remain higher than assumed in the December Report. A persistently higher money market premium is expected to pass through fully to other market rates further out, pulling down the policy rate correspondingly (red bars).
Factors relating to domestic demand, price and wage inflation, the krone exchange rate, foreign interest rates and oil and gas prices push up the rate path, while a higher money market premium pulls it down a little. On balance, the model-based analysis implies a higher rate path throughout the projection period.
The policy rate forecast reflects the Committee’s monetary policy trade-offs, and the rate path for the coming years has been revised up less than suggested by the model analysis. In its overall assessment of the monetary policy stance, the Committee also takes into account other considerations that are not fully represented in the model analysis. Uncertainties relating to the economic outlook and households’ response to higher interest rates warrant a gradual rise in the policy rate.
8 Period: 2022 Q2 – 2024 Q4. Projections. The contributions are based on model estimates, but there is no mechanistic link between news and changes in the bars. The effects of news feed through with a lag and the interaction between economic variables may result in a reversal of the effects over time. In addition, projections for the near term may entail different signs at different times. The effect on the rate path is therefore shown most clearly by the cumulative contribution.
Norges Bank’s monetary policy strategy
The Bank’s monetary policy strategy describes the Committee’s interpretation of the monetary policy mandate and provides a framework for the Committee’s assessment of how monetary policy will respond to different shocks. The strategy is summarised below, and the full text is published on Norges Bank’s website.
The operational target of monetary policy is annual consumer price inflation of close to 2% over time. Inflation targeting shall be forward-looking and flexible so that it can contribute to high and stable output and employment and to counteracting the build-up of financial imbalances.
Low and stable inflation
When setting the policy rate, Norges Bank aims to stabilise inflation, as measured by the annual rise in the consumer price index (CPI), around the 2% target. Provided there is confidence in low and stable inflation, variations in inflation around the target are not likely to engender any significant economic costs. How quickly the Bank seeks to return inflation to target will depend on the shocks that have occurred and whether there are conflicts between achieving the target and other monetary policy considerations. In interest rate setting the Bank gives weight to avoiding large and persistent deviations from the inflation target, whether above or below the target.
High and stable output and employment
Monetary policy can contribute to stabilising output and employment around the highest level that is consistent with price stability over time.
The economic costs of cyclical fluctuations are asymmetrical. High unemployment involves direct costs for both society and those unable to find employment. Very low unemployment, on the other hand, does not involve any direct costs, but only indirect costs potentially in the form of excessively high wage and price inflation. The Bank will therefore not aim to quickly close a positive output gap as long as there are prospects that inflation will remain within a range close to 2% and there are no signs of financial imbalances accumulating.
By preventing downturns from becoming deep and protracted, monetary policy can contribute to keeping unemployment from becoming entrenched at a high level so that the average level of employment over time is as high as possible.
Mitigating the build-up of financial imbalances
If there are signs that financial imbalances are building up, the consideration of maintaining high and stable output and employment may, in some situations, suggest keeping the policy rate somewhat higher than otherwise. This can to some extent mitigate the risk of a severe downturn further out. Nevertheless, the regulation and supervision of financial institutions are the most important tools for cushioning shocks to the financial system.
Response pattern
The policy rate influences inflation and the real economy with a lag, and the effects are uncertain. To reduce the risk of monetary policy contributing to economic instability, Norges Bank will normally respond less forcefully to shocks than if there had not been uncertainty about the transmission of monetary policy. Furthermore, the policy rate is normally changed gradually to make monetary policy more predictable and to reduce the risk of undesirable financial market volatility and unexpected reactions of households and firms. In situations where the risk of particularly adverse outcomes is pronounced, or if there is no longer confidence that inflation will remain low and stable, it may be appropriate to react more forcefully than normal in interest rate setting.
5 Decision basis for the countercyclical capital buffer
At its meeting on 23 March, Norges Bank’s Monetary Policy and Financial Stability Committee decided to increase the countercyclical capital buffer rate to 2.5%, effective from 31 March 2023.
Prior to the reduction in March 2020, the countercyclical capital buffer rate had been set at 2.5%. Financial imbalances had then built up over a long period. During the pandemic, residential and commercial property prices have increased substantially, and household credit growth has accelerated. Since mid-2021, property price inflation has been more moderate. In 2022, house price inflation has been higher than anticipated, but is expected to slow ahead. Financial imbalances suggest that the buffer rate should be returned to 2.5%.
Creditworthy firms and households appear to have ample access to credit. Norwegian banks are profitable and their credit losses are low. There appears to be little direct risk of credit losses owing to the war in Ukraine. Banks are well equipped to meet a higher countercyclical capital buffer rate while maintaining credit supply.
Framework for decisions on the countercyclical capital buffer
Decisions on the level of the countercyclical capital buffer are based on an assessment of three main areas: (i) households’ and firms’ access to credit, (ii) financial imbalances and (iii) the situation for banks. Banks’ loss-absorbing capacity is assessed in particular in the annual stress test of banks published in Financial Stability Report. More about Norges Bank’s framework can be found in Norges Bank Papers 4/2019. Updated charts with all the indicators included in the framework can be found on Norges Bank’s website.
5.1 Access to credit
Creditworthy firms appear to have ample access to credit. Banks have sufficient capacity to meet credit demand. Since December, risk premiums on new corporate bond issues have edged up, partly reflecting heightened uncertainty as a result of the war in Ukraine. Recently, higher risk premiums have likely induced some firms to postpone new bond issues. However, there are no signs that creditworthy firms have lost access to the bond market.
Households also appear to have ample access to credit. The banks included in Norges Bank’s Survey of Bank Lending reported unchanged credit standards for households and firms in 2021 Q4, and no changes are expected ahead.
5.2 Financial imbalances
Temporary rise in house price inflation
House prices have risen more than income through the pandemic (Chart 5.1), which has increased housing market vulnerabilities. Since April 2021, the rise in house prices has been more moderate (Chart 5.2). The decline in house price inflation probably reflects higher lending rates and a normalisation of household consumption patterns as society reopens.
Chart 5.1 House prices have risen faster than income through the pandemic1
Index. 1998 Q4 = 100
Chart 5.2 Transitory rise in house price inflation in the beginning of 20222
Percent
In the market for existing homes, demand is still high, and the stock of unsold homes at the beginning of 2022 was low (Chart 5.3). Since the December 2021 Monetary Policy Report, house price inflation has been stronger than projected and should be viewed in the context of the new regulation on the sale of real property, which has likely caused temporary bottlenecks in the real estate market.3 The new regulation includes stricter house survey requirements. House surveys now take longer to prepare, and new surveys must also be prepared for dwellings that have been listed for sale since 2021. This has reduced the number of listings so far in 2022 compared with what is normal (Chart 5.3). In isolation, a reduced stock of homes for sale boosts house price inflation, although this effect is expected to be transitory. It may also be reasonable to assume that the larger a dwelling is, the longer it takes to prepare a house survey. In January, substantially fewer detached and small dwellings (terraced and semi-detached houses) were listed and sold than flats (Chart 5.4). This has likely led to temporary compositional effects on the price index that push up measured house price inflation in the near term because the standard of flats is often higher.
Chart 5.3 Few unsold units in the market for existing homes4 Thousands of existing homes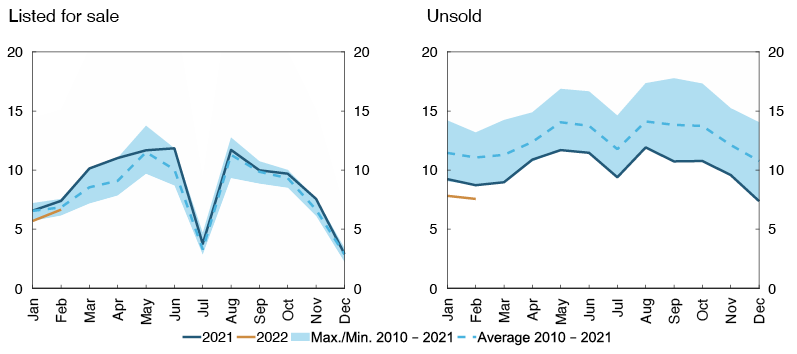
Chart 5.4 Largest decline in the markets for detached and small dwellings5
Deviation from the mean 2010–2021 by dwelling type. Percent
In the market for new homes, sales of detached and small dwellings fell to historically low levels in the latter half of 2021, while sales of flats remained steady (Chart 5.5). These developments have continued in 2022, although sales of flats have risen to an even higher level. Overall, turnover in the market for new homes has increased since the December Report. The low turnover of new detached and small dwellings reflects a substantial rise through 2021 in timber prices, which are an important factor input in the construction of such dwellings. However, the sharp rise in construction costs has affected housing investment and housing starts to a lesser extent than expected in the December Report. Increased residential construction is expected ahead (see discussion in Section 3).
Chart 5.5 High level of new home sales6
Turnover. Hundreds of new homes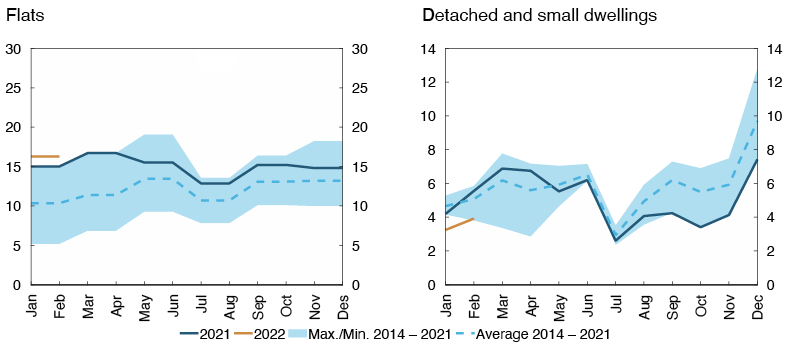
House price inflation is projected to fall through 2022 and into 2023 owing to higher lending rates and because more homes will be listed for sale as the effects of the new regulation dissipate (Charts 5.2 and 5.6). In the somewhat longer term, house price inflation is also expected to decline owing to increased residential construction. Strong labour market developments and real wage growth have the opposite effect.
Chart 5.6 Lower house price inflation ahead7
House prices. Four-quarter change. Percent
Household sector vulnerabilities
High household debt and high house price inflation through the pandemic are key household sector vulnerabilities (see discussion in Financial Stability Report 2021). Household debt is dominated by residential mortgage loans, and debt developments are closely associated with house price developments. A sharp and abrupt fall in house prices can therefore reduce housing wealth for many households.
Periods of persistently high house price inflation and credit growth increase household sector vulnerabilities. If house prices rise faster than incomes, households become more vulnerable to income loss and higher interest rates. Without financial buffers in such a situation, households may need to tighten consumption. Such a tightening may contribute to amplifying a downturn in the Norwegian economy. This may reduce firms’ earnings and debt servicing capacity and in turn result in higher losses on banks’ corporate exposures.
Rise in household interest burdens ahead
Over the past six months, household credit growth has moved down a little, in line with more moderate housing market developments, but has been slightly higher than projected in the December Report. Household credit growth is expected to decline gradually ahead owing to higher lending rates and slower house price inflation (Chart 5.7 and Annex Table 3).
Chart 5.7 Lower credit growth ahead8
Credit. Four-quarter change. Percent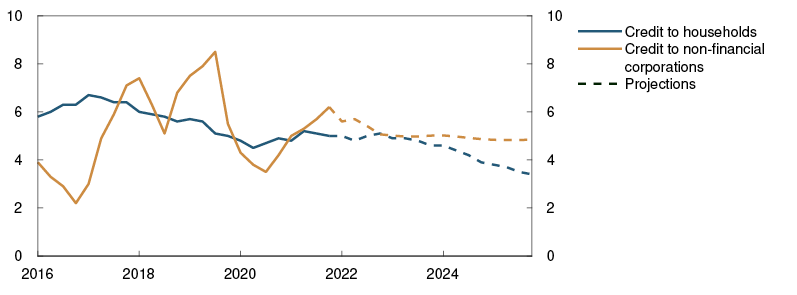
Household debt-to-income (DTI) ratios have risen substantially over a long period and are now at a high level (Chart 5.8). Overall, DTI ratios have been relatively stable in 2021. The Bank’s projections for credit and income growth indicate that DTI ratios will rise gradually in the coming years before levelling off towards the end of the projection period.
Chart 5.8 Household interest burden expected to rise9
Percent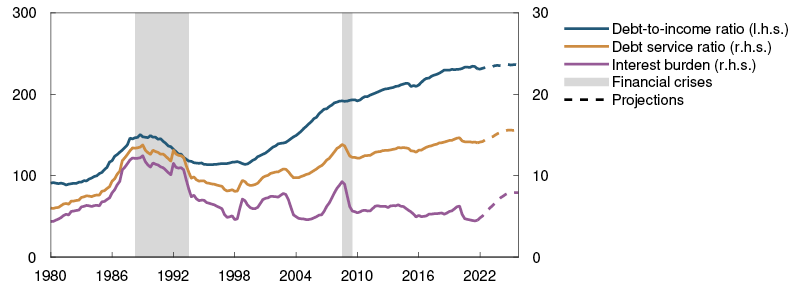
With higher lending rates, household interest expenses will rise more than income ahead. The interest burden, ie interest expenses as a percentage of after-tax income, increases gradually from 4.5% in 2021 Q4 to close to 8% towards the end of the projection period (Chart 5.8). At the same time, saving during the pandemic has been substantially higher than normal. This has increased financial buffers in the household sector overall, making it better equipped to face higher interest expenses.
Growth in corporate credit from domestic sources fell through much of 2020 but picked up again through 2021 (Chart 5.7). Developments have been in line with investment growth. In recent months, credit growth has been broadly as projected in the December Report. Low bond market risk premiums contributed to high bond issuance in 2021, which was an important driver of the increase in credit growth. Risk premiums on new bond issues have increased somewhat for most sectors since December, which is expected to dampen credit growth slightly in the near term. Further out, growth in business investment is expected to support credit growth.
Commercial property prices expected to level off
Commercial property selling prices are estimated as rental prices divided by a yield. Selling prices rose markedly in the latter half of 2020 (Chart 5.9), reflecting a substantial fall in the yield. In 2021, prices rose as a result of higher rents.
The yield, which depends on developments in long-term interest rates and a risk premium, has remained stable at a record-low level since 2020 Q4. Long-term interest rates have risen since the December Report (see discussion in Section 2). A gradual rise in the yield is therefore expected ahead. Owing to low supply of new office buildings, high employment growth and strong economic growth, rents are expected to rise rapidly in the period ahead. In the longer term, the rise in rents is expected to be moderate, in line with increased construction activity and slower growth in the Norwegian economy. Overall, the projections for rents and yields indicate that commercial property selling prices will level off further out (Chart 5.9).
Chart 5.9 Commercial property prices are leveling off10
Selling prices for commercial property. In thousands of NOK per square metre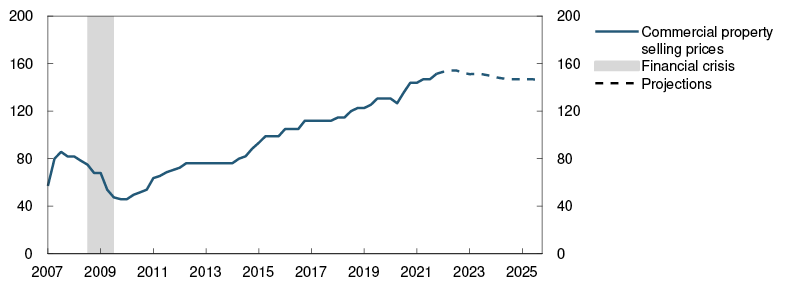
Commercial property prices are particularly vulnerable to interest rate increases or higher risk premiums when the yield is low. The war in Ukraine has led to heightened uncertainty about the economic outlook. This may lead to a higher risk premium and a higher yield than previously assumed. However, the rapid rise in commercial property prices in recent years has not been matched by corresponding borrowing by commercial real estate (CRE) firms. This has boosted these firms’ equity ratios, making them better equipped for a price fall. Banks’ losses on CRE exposures are expected to be low ahead.
The pandemic has led to extensive use of remote working. For the time being, there are no signs that this structural change has led to a reduction in demand for office space. For example, market participants point out that a greater need for video conferencing has actually increased demand for office space from some firms with parts of their workforce working remotely.
CRE sector vulnerabilities
Banks’ high CRE exposures and low yields are key financial system vulnerabilities (see discussion in Financial Stability Report 2021). Within the CRE market, the office segment is especially important for financial stability since banks’ exposure to this segment is substantial. A relatively large share of the stock of office buildings is in Oslo, and selling prices for prime office space in Oslo are therefore an important indicator of CRE sector vulnerabilities.
1 Period: 1983 Q1 – 2021 Q4. Disposable income is income after taxes and interest payments.
2 Period: January 2016 – June 2022. Projections from March 2022.
3 The amendments to the Sale of Real Property Act regulating the sale and purchase of dwellings entered into force on 1 January 2022. Along with the amendments, a separate regulation was laid down that sets out minimum house survey requirements.
4 Period: January 2010 – February 2022.
5 Period: January – February 2022. Small dwellings comprise terraced and semi-detached houses.
6 Period: January 2014 – February 2022. Flats are from ECON Nye Boliger and only include projects with more than 15 units. These statistics are issued for two-month periods. Detached and small dwellings are from the Norwegian Homebuilders’ Association.
7 Period: 2016 Q1 – 2025 Q4. Projections from 2021 Q4 for MPR 4/21 and 2022 Q1 for MPR 1/22.
8 Period: 2016 Q1 – 2025 Q4. Projections from 2022 Q1. Non-financial corporations in mainland Norway.
9 Period: 1980 Q1 – 2025 Q4. Projections from 2022 Q1. Debt-to-income ratio is loan debt as a percentage of disposable income. Disposable income is income after taxes and interest payments. Debt service ratio is interest and estimated principal payments as a percentage of after-tax income. Interest burden is interest expenses as a percentage of after-tax income.
10 Period: 2007 Q1 – 2025 Q4. Projections from 2022 Q1. Prime office space in Oslo.
5.3 Banks
The profitability of large Norwegian banks has been solid over the past year. Return on equity edged lower in 2021 Q4 (Chart 5.10), primarily due to somewhat higher personnel expenses and the marginal increase in the loan loss ratio. Higher deposit margins pushed up net interest income and boosted profitability. Higher net interest income is still expected, owing to higher interest rates in the period ahead.
Chart 5.10 Banks are profitable11
Return on equity. Annualised. Percent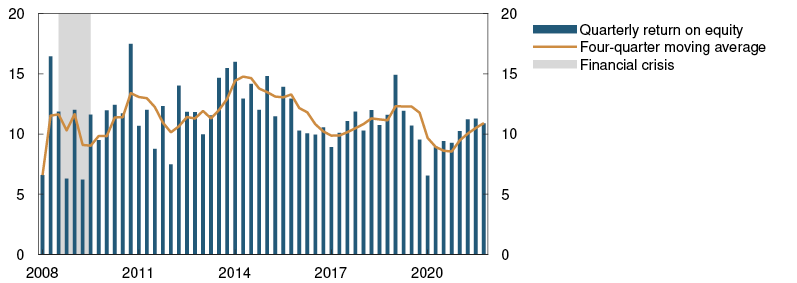
Banks’ credit losses were low in 2021. Credit losses for all Norwegian banks as a whole were approximately 0.1% of gross lending in 2021 (Chart 5.11), primarily because banks have reversed earlier impairment losses, reflecting better-than-expected economic developments.
Chart 5.11 Banks’ credit losses are low12
Credit losses as a share of lending. Annualised. Percent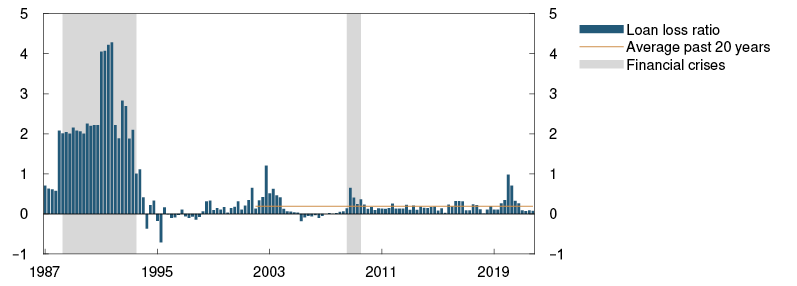
There appears to be little direct risk of credit losses on account of the war in Ukraine. Norwegian banks’ exposures to Russia and Ukraine are modest. There is also relatively limited trade between Norway and these two countries, which implies that few Norwegian firms will be impacted directly. Moreover, high oil and gas prices reduce banks’ risk of losses on oil-related exposures. Looking ahead, credit losses are expected to reach 0.2%, which is the average for the past 20 years.
The risk premiums Norwegian banks pay for senior bonds and covered bonds have increased somewhat since the December Report. These developments reflect the volatility associated with the war in Ukraine. Nevertheless, banks continue to have ample access to wholesale funding. They meet the requirements for liquidity reserves by an ample margin and are well equipped to weather financial market volatility.
At the end of 2021, the largest banks’ Common Equity Tier 1 (CET1) capital ratios were well above the current capital requirement. The majority of the banks also satisfy the capital requirements applicable from year-end 2022 by ample margins (Chart 5.12). CET1 capital ratios rose by 0.1 percentage point between 2021 Q3 and Q4, and 0.4 percentage in the course of 2021. The rise primarily reflects solid earnings and low credit losses. The large banks’ proposed dividends account for between 50% and 70% of total comprehensive income for 2021, in line with previous projections. Banks’ capital ratios are solid, also when accounting for proposed dividends. Banks are well equipped to meet a higher countercyclical capital buffer rate while maintaining credit supply.
Chart 5.12 Banks are well equipped to meet a higher buffer requirement13
Largest Norwegian-owned banking groups. Percent
11 Period: 2008 Q1 – 2021 Q4. Largest Norwegian-owned banking groups.
12 Period: 1987 Q1 – 2021 Q4. All banks and mortage companies in Norway.
13 At 2021 Q4. Total seven largest banks is a weighted average of the seven banks shown in the chart. Capital targets are defined here as regulatory requirements at December 31 2022 with a 1 percentage point margin above the capital requirements.
Annex
Detailed tables of projections
Table 1 International projections
|
Change from projections inMonetary Policy Report 4/21 in brackets |
Weights1 Percent |
Percentage change from previous year |
||||
|
2021 |
2022 |
2023 |
2024 |
2025 |
||
|
GDP |
||||||
|
US |
9 |
5.7 (0.1) |
3.2 (-0.1) |
2.3 (0) |
1.6 (0.1) |
1.3 |
|
Euro area |
35 |
5.3 (0.1) |
3.2 (-0.7) |
2.7 (0.5) |
1.6 (0.1) |
1.4 |
|
UK |
11 |
7.5 (0.7) |
4.3 (-0.4) |
1.8 (-0.7) |
1.3 (0.1) |
1.2 |
|
Sweden |
13 |
4.6 (0) |
3.2 (0.4) |
2 (-0.1) |
1.8 (0.1) |
1.6 |
|
China |
7 |
8.1 (0.3) |
4.6 (-0.2) |
5.3 (0) |
5 (-0.2) |
4.9 |
|
13 trading partners1 |
100 |
5.7 (0.2) |
3.4 (-0.3) |
2.8 (0.1) |
2.1 (0.1) |
2 |
|
5 trading partners2 |
5.9 (0.2) |
3.5 (-0.4) |
2.7 (0.1) |
2 (0.1) |
1.8 |
|
|
Prices |
||||||
|
Underlying inflation3 |
2 (0) |
3.4 (0.9) |
2.2 (0.3) |
2.1 (0.2) |
2 |
|
|
Wage growth4 |
3.9 (0.7) |
3.9 (0.8) |
3.3 (0.4) |
2.9 (0.2) |
2.8 |
|
|
Prices for consumer goods imported to Norway5 |
2 (0) |
4 (1.7) |
1.4 (0.5) |
0.8 (0) |
0.8 |
|
1 The aggregate includes: Euro area, China, UK, Sweden, US, Brazil, Denmark, India, Poland, South Korea, Singapore, Thailand and Turkey. Export weights.
2 The aggregate includes: China, Euro area, Sweden, UK and US. Export weights.
3 The aggregate for underlying inflation includes: Euro area, Sweden, UK and US. Import weights.
4 Projections for compensation per employee in the total economy. The aggregate includes: Euro area, Sweden, UK and US. Import weights.
5 In foreign currency terms. Including compositional effects.
Sources: IMF, Refinitiv Datastream and Norges Bank
Table 2a Consumer prices. Twelve-month change. Percent
|
2021 |
2022 |
||||||
|
Dec |
Jan |
Feb |
Mar |
Apr |
May |
Jun |
|
|
Consumer price index (CPI) |
|||||||
|
Actual |
5.3 |
3.2 |
3.7 |
||||
|
Projections MPR 4/21 |
5.0 |
3.6 |
3.5 |
3.7 |
|||
|
Projections MPR 1/22 |
4.9 |
4.5 |
4.3 |
4.0 |
|||
|
CPI-ATE |
|||||||
|
Actual |
1.8 |
1.3 |
2.1 |
||||
|
Projections MPR 4/21 |
1.3 |
1.0 |
1.2 |
1.2 |
|||
|
Projections MPR 1/22 |
2.5 |
2.3 |
2.6 |
2.5 |
|||
|
Imported consumer goods in the CPI-ATE |
|||||||
|
Actual |
1.1 |
1.2 |
2.4 |
||||
|
Projections MPR 4/21 |
0.5 |
0.2 |
0.3 |
0.6 |
|||
|
Projections MPR 1/22 |
3.4 |
2.7 |
3.6 |
2.9 |
|||
|
Domestically produced goods and services in the CPI-ATE |
|||||||
|
Actual |
2.1 |
1.4 |
1.9 |
||||
|
Projections MPR 4/21 |
1.6 |
1.5 |
1.6 |
1.6 |
|||
|
Projections MPR 1/22 |
2.0 |
2.1 |
2.1 |
2.3 |
|||
Sources: Statistics Norway and Norges Bank
Table 2b GDP for mainland Norway. Quarterly change. Seasonally adjusted. Percent
|
2021 |
2022 |
||||||
|
Q3 |
Q4 |
Q1 |
Q2 |
||||
|
Actual |
2.8 |
1.4 |
|||||
|
Projections MPR 4/21 |
1.3 |
-0.4 |
|||||
|
Projections MPR 1/22 |
-0.4 |
1.8 |
|||||
Sources: Quarterly National Accounts from Statistics Norway and Norges Bank
Table 2c GDP for mainland Norway. Monthly change. Seasonally adjusted. Percent
|
2021 |
2022 |
||||||
|
Dec |
Jan |
Feb |
Mar |
Apr |
May |
Jun |
|
|
Actual |
-0.7 |
-0.9 |
|||||
|
Projections MPR 4/21 |
0.0 |
-1.0 |
0.1 |
0.7 |
|||
|
Projections MPR 1/22 |
0.8 |
0.8 |
0.5 |
0.5 |
0.4 |
||
Sources: Statistics Norway and Norges Bank
Table 2d Registered unemployment (rate). Percent of labour force.Seasonally adjusted
|
2021 |
2022 |
||||||
|
Dec |
Jan |
Feb |
Mar |
Apr |
May |
Jun |
|
|
Actual |
2.3 |
2.4 |
2.1 |
||||
|
Projections MPR 4/21 |
2.5 |
3.0 |
2.9 |
2.7 |
|||
|
Projections MPR 1/22 |
2.0 |
2.0 |
2.0 |
2.0 |
|||
Sources: Norwegian Labour and Welfare Administration (NAV) and Norges Bank
Table 3 Projections for main economic aggregates
|
Change from projections inMonetary Policy Report 4/21 in brackets |
Percentage change from previous year (unless otherwise stated) |
|||||
|
In billionsof NOK2021 |
Projections |
|||||
|
2021 |
2022 |
2023 |
2024 |
2025 |
||
|
Prices and wages |
||||||
|
CPI |
3.5 |
3.4 (0.7) |
1.6 (0.1) |
2.2 (0.2) |
2.4 |
|
|
CPI-ATE |
1.7 |
2.5 (0.8) |
2.4 (0.4) |
2.5 (0.5) |
2.4 |
|
|
Annual wages |
3.5 |
3.7 (0.5) |
4.0 (0.4) |
3.9 (0.4) |
3.8 |
|
|
Real economy1 |
||||||
|
Gross domestic product (GDP) |
4133 |
4.1 |
4.6 (0.3) |
2.0 (-0.5) |
1.3 (0.0) |
0.3 |
|
GDP, mainland Norway |
3256 |
4.2 |
4.1 (0.6) |
1.6 (-0.4) |
1.0 (0.0) |
1.0 |
|
Output gap, mainland Norway (level) |
-0.9 |
1.6 (0.9) |
1.4 (0.1) |
1.0 (0.0) |
0.8 |
|
|
Employment, persons, QNA |
1.2 |
3.0 (0.5) |
0.6 (-0.1) |
0.4 (0.1) |
0.3 |
|
|
Registered unemployment (rate, level) |
3.1 |
2.0 (-0.4) |
1.8 (-0.3) |
2.0 (0.0) |
2.0 |
|
|
Demand1 |
||||||
|
Mainland demand |
3367 |
3.6 |
4.2 (0.6) |
2.1 (-1.9) |
1.6 (1.0) |
1.8 |
|
– Household consumption |
1616 |
4.8 |
6.0 (0.0) |
3.4 (-2.6) |
1.7 (-0.3) |
1.4 |
|
– Business investment |
353 |
2.2 |
4.9 (2.7) |
5.6 (-0.7) |
4.3 (-1.6) |
4.6 |
|
– Housing investment |
211 |
2.6 |
3.3 (-0.2) |
2.9 (0.5) |
0.5 (-0.2) |
0.5 |
|
– Public demand |
1187 |
2.5 |
1.7 (0.9) |
-1.1 (-1.6) |
1.0 (0.7) |
1.6 |
|
Petroleum investment |
178 |
-2.8 |
-8.0 (-2.0) |
8.0 (-2.0) |
15.0 (6.0) |
3.0 |
|
Mainland exports |
719 |
4.7 |
4.7 (-0.1) |
5.0 (1.0) |
3.3 (0.7) |
2.6 |
|
Imports |
1203 |
1.6 |
6.7 (0.9) |
5.3 (-3.3) |
4.6 (0.0) |
1.0 |
|
House prices and debt |
||||||
|
House prices |
9.1 |
4.4 (1.6) |
-0.8 (-1.5) |
0.9 (-1.5) |
3.3 |
|
|
Household credit (C2) |
5.0 |
5.1 (0.2) |
4.6 (0.0) |
3.9 (-0.2) |
3.4 |
|
|
Interest rate, exchange rate and oil price |
||||||
|
Policy rate (level) |
0.1 |
0.9 (0.1) |
2.0 (0.5) |
2.5 (0.8) |
2.4 |
|
|
Import-weighted exchange rate (I-44) (level) |
108.7 |
105.1 (-2.7) |
104.1 (-0.9) |
103.9 (-0.4) |
103.9 |
|
|
Money market rates, trading partners (level) |
-0.2 |
0.6 (0.5) |
1.4 (1.0) |
1.6 (1.0) |
1.6 |
|
|
Oil price, Brent Blend. USD per barrel |
75.0 |
100.2 (27.1) |
88.9 (18.9) |
82.3 (14.2) |
78.2 |
|
|
Household income and saving1 |
||||||
|
Real disposable income excl. dividend income |
2.2 |
1.5 (-0.7) |
1.8 (-0.4) |
1.1 (-0.7) |
1.5 |
|
|
Saving ratio excl. dividend income (rate, level) |
7.9 |
3.9 (-1.7) |
2.6 (0.2) |
2.2 (-0.3) |
2.3 |
|
|
Fiscal policy |
||||||
|
Structural non-oil deficit as a percentage of GPFG2 |
3.5 |
3.0(0.2) |
2.7(0.1) |
2.7(0.1) |
2.7 |
|
|
Structural non-oil deficit as a percentage of trend GDP |
11.6 |
11.0(0.7) |
9.0(-0.6) |
9.1(-0.5) |
9.2 |
|
1 All figures are working-day adjusted.
2 Government Pension Fund Global measured at the beginning of the year.
Sources: Eiendomsverdi, Finn.no, Ministry of Finance, Norwegian Labour and Welfare Administration (NAV), Real Estate Norway, Refinitiv Datastream, Statistics Norway and Norges Bank