
Households are able to service debt
Norwegian households are highly indebted. High inflation and higher interest rates have led to tighter finances for most households in recent years, and for some this has been difficult to manage. Even though costs have increased, a vast majority of households are able to service their debt, primarily reflecting that many households are employed and most had financial buffers they could draw on when costs rose.
Inflation has declined markedly since the peak and there are prospects for lower interest rates further out. This will make it easier to service debt.
Somewhat improved commercial real estate prospects, but still challenging for real estate developers
Firms in all sectors have been affected by rising interest rates in recent years. Firms in the real estate sector have been particularly affected by higher interest rates as they often have high debt-to-earnings ratios. High employment and rental income growth enable most CRE firms to cover higher interest expenses with current earnings. This is more difficult for real estate developers, which are also facing higher construction costs, lower residential construction activity and sluggish new home sales.
Risk of negative events
Future developments are highly uncertain. Geopolitical tensions are higher than they have been for a long time. Shocks abroad may have consequences for the financial system in Norway.
In a turbulent world, the risk of targeted cyber attacks increases. Attack surfaces expand as a result of rapid technological advances and increasing financial system interconnectedness.
Climate change also makes the economy more vulnerable, both through the transition needed to cut emissions and because climate change increases the frequency of extreme weather events.
Banks are resilient
Norwegian banks are solid. This is important for financial stability. Banks’ losses are low, and banks satisfy capital and liquidity requirements. Creditworthy firms and households have ample access to credit.
Norges Bank sets the level of the countercyclical capital buffer each quarter. The countercyclical capital buffer rate of 2.5% helps maintain bank resilience.
Financial stabilty assessment
Norges Bank’s Monetary Policy and Financial Stability Committee considers the financial system to be robust. Households and firms have so far been able to service debt in the face of high inflation and higher interest rates. Inflation has slowed and there are prospects for a lower policy rate. However, there is a risk of negative events that could weaken financial stability. It is important to maintain the resilience of the financial system so that vulnerabilities do not amplify an economic downturn.
Lower inflation, but also a risk of negative events that could weaken financial stability
Higher interest rates and high inflation have had an impact on the global financial system in the wake of the pandemic. The rise in interest rates has dampened economic activity, but employment has held up well. In Norway, the financial system has proven robust. Borrowers have been able to service debt, and banks’ credit losses have been low.
Inflation has declined markedly over the past two years. Since the May 2024 Financial Stability Report, short-term interest rates have fallen. Many central banks have communicated increased confidence that inflation will be close to their targets ahead, and several have started to reduce policy rates. Norges Bank’s forecast in Monetary Policy Report 3/2024 indicates that the policy rate in Norway will be gradually reduced from 2025 Q1.
At the same time, there is a risk of negative events that could weaken financial stability, and geopolitical tensions are higher than they have been in a long time. New shocks abroad can impact the financial system in Norway. Financial system vulnerabilities could amplify a downturn in the Norwegian economy and lead to bank losses.
Many households are highly indebted
The high indebtedness of many households is a key vulnerability in the Norwegian financial system. Norwegian households’ debt-to-income ratios are among the highest. This vulnerability has built up over time on the back of a high proportion of homeownership in Norway and debt and house prices rising faster than household income over a long period. High and rapidly rising debt can amplify economic downturns and increase the risk of financial crises. Indebtedness has risen less than income in recent years. Over time, such developments could reduce the vulnerability of the household sector to interest rate increases or a loss of income. On the other hand, household vulnerabilities could increase again if looser financial conditions result in rapidly rising house prices and debt.
Households have so far been able to service debt in the face of higher costs
Most households have also faced tighter finances owing to high inflation and higher interest rates, and for some this has been difficult to manage. However, default rates have remained low, partly reflecting high employment and the sound financial basis of most households provided by financial buffers. Many highly indebted households have reduced their bank deposits somewhat in recent years, but they are still higher than before the pandemic. The analyses in this Report show that the vast majority of households are able to service debt and cover ordinary consumption expenditure, housing expenses and electricity out of current earnings by an ample margin.
There are now prospects for both real wage growth and lower interest rates (see Monetary Policy Report 3/2024), which will boost households’ purchasing power and make it easier to service debt. At the same time, unemployment will likely edge up to approximately pre-pandemic levels. If unemployment were to rise markedly, many households would need to reduce consumption substantially. Firms’ earnings and debt-servicing capacity would then fall, and banks’ credit losses rise.
Somewhat improved commercial real estate prospects, but still challenging for real estate developers
Banks’ high commercial real estate (CRE) exposures are another key financial system vulnerability. Higher interest rates have weakened CRE firms’ profitability and led to a fall in commercial property prices, but prices now appear to have levelled off. High employment and rental income growth enable most CRE firms to service higher interest expenses out of current earnings. Weaker profitability and solvency may pose problems for firms that need to refinance debt. So far in 2024, credit premiums on CRE firms’ bank and bond financing have fallen, which is likely to reduce refinancing risk for debt maturing in the coming years. Further developments, however, remain uncertain. If employment were to fall markedly and rental income prove to be markedly weaker than expected, many firms could face debt-servicing problems.
The share of bankruptcies among Norwegian firms has risen since the beginning of 2023. The rise has been particularly pronounced among real estate developers, whose profitability has been impaired owing to higher interest rates, high construction costs, lower residential construction activity and sluggish new home sales. This makes it difficult for many developers to service debt out of current earnings. Bankruptcy rates in most other sectors have also increased somewhat but are still lower than before the pandemic. The analyses in this Report indicate that the corporate bankruptcy rate in Norway is likely to edge up further ahead, especially in the real estate sector.
The banking sector is resilient
Resilient banks are important for financial stability. Norwegian banks satisfy capital and liquidity requirements by a solid margin and have ample access to both deposits and wholesale funding. Both creditworthy firms and households have ample access to credit.
Banks’ profitability is the first line of defence against losses. Norwegian banks have been highly profitable through the post-pandemic tightening cycle, primarily reflecting high net interest income and low credit losses. In the period ahead, a lower policy rate is expected to pull down net interest income somewhat. If negative events occur, losses could increase more than expected, profitability could weaken and the funding situation could rapidly deteriorate.
Maintaining financial system resilience is important
Banks’ capital buffer requirements reflect the vulnerabilities in the Norwegian financial system and bolster resilience. In the event of a sharp downturn, buffer requirements can be reduced to mitigate the risk of tighter bank lending. The solvency stress test in Financial Stability Report 2024 H1 shows that banks can absorb large credit losses, while still maintaining lending.
Norges Bank sets the countercyclical capital buffer rate each quarter. At its meeting on 25 November 2024, the Monetary Policy and Financial Stability Committee decided to keep the countercyclical capital buffer rate unchanged at 2.5%.
Norges Bank also provides advice on the systemic risk buffer rate every other year. In May 2024, the Monetary Policy and Financial Stability Committee decided to advise the Ministry of Finance to maintain the systemic risk buffer rate at 4.5 percent. In August, the Ministry of Finance decided to keep the rate unchanged at 4.5 percent, in line with Norges Bank’s advice.
Norges Bank’s consultation response to the Ministry of Finance about changes to the Lending Regulations supports Finanstilsynet’s (Financial Supervisory Authority of Norway) proposal to continue all elements of the Regulations. However, Norges Bank is of the opinion that some of them can be adjusted somewhat. The Lending Regulations have set limits on banks’ lending practices and dampened the build-up of household sector vulnerabilities. Permanent Regulations will help contribute to predictability and counter any future slippage in credit standards. However, the Lending Regulations should be assessed at regular intervals. It is important to expand the knowledge base on the effects of the Regulations and the consequences of their individual elements.
Ida Wolden Bache
Pål Longva
Øystein Børsum
Ingvild Almås
Steinar Holden
1. Risks, vulnerabilities and resilience
1.1 Lower inflation, but risk of negative events that could weaken financial stability
Lower inflation and expectations of a further decline in interest rates
Global inflation has slowed markedly over the past few years. Since Financial Stability Report 2024 H1 was published in May, short-term interest rates have fallen. Many central banks have communicated increased confidence that inflation will be close to their targets ahead and that current tight monetary policy stances are no longer warranted. A number of central banks have reduced their policy rates, and market expectations indicate further cuts. Norges Bank’s forecast in Monetary Policy Report 3/2024 indicates that the policy rate will remain at 4.5% to the end of 2024 before being gradually reduced from 2025 Q1.
Long-term government bond yields fell over summer but have since risen again (Chart 1.1). Since the May Report, lower policy rate expectations have pushed down long-term yields. At the same time, elevated uncertainty associated with government borrowing requirements in many countries has likely pushed up the premiums required by investors to hold long-dated rather than short-dated bonds, measured as the term premium. This pulls up long-term yields. Even though inflation has eased, the outlook for global growth and inflation remains uncertain.
10-year government bond yields in selected countries. Percent

Financial market conditions in Norway are little changed since the May Report
Financial market conditions in Norway are little changed since the May Report. The Oslo Børs benchmark index remains broadly unchanged, the money market premium has remained stable and credit premiums in the bond market show little change. The krone exchange rate is around the same level prevailing at the time of the publication of the May Report.
US equity indexes have risen considerably over the past six months, while European indexes are at approximately the same level as in May. Equity markets in Asia are somewhat higher (Chart 1.2). Credit premiums are little changed internationally. At the beginning of August, turbulence and large market movements influenced financial markets, albeit briefly (see "Short-lived turbulence in international financial markets in August").

Short-lived turbulence in international financial markets in August
In early August, financial markets were influenced by turbulence and large market movements. The movements were primarily linked to a rapid appreciation of the Japanese yen, in particular following the Bank of Japan’s policy rate hike and expectations of lower interest rates in the US on the back of weak employment figures and recession fears. This in turn contributed to rapid carry trade unwinding and sales in equity markets. A carry trade is a strategy whereby a market participant borrows in a currency with a low interest rate, such as the Japanese yen, and then invests that money in a currency with a higher interest rate. A successful carry trade strategy depends on the loan denomination currency not strengthening beyond what the investor can earn from the interest rate differential. When the Japanese yen appreciated considerably against the US dollar, carry trade positions therefore came under great pressure.
In connection with the market turbulence, global equity indexes fell sharply, and volatility indicators rose to levels not seen since the outbreak of the pandemic (Chart 1.2). However, the turbulence subsided after a few days following, among other things, the Bank of Japan’s statements that the policy rate would not be raised further until market volatility subsided. This helped stabilise the situation. The Japanese yen depreciated and the decline in equity markets rapidly reversed.
Several international institutions have later pointed out the resilience shown by the markets during the days of large market movements.1 In spite of the volatility and poorer liquidity, trading continued across asset classes, and central counterparties and their participants were able to manage substantial changes in margin calls. However, the events of early August illustrate how shifts in market sentiment and increased volatility can have a rapid and marked impact on asset valuations.
Looser financial conditions may contribute to a renewed build-up of financial vulnerabilities
The expected decline in policy rates globally and other looser financial conditions help maintain a positive financial stability outlook in the short term. In the longer term, however, such conditions may contribute to a renewed build-up of financial vulnerabilities. In the October 2024 Global Financial Stability Report, the International Monetary Fund (IMF) points out that looser financial conditions can contribute to strong growth in asset valuations and private and public debt globally, which increases financial system vulnerabilities in the longer term. The build-up of such vulnerabilities can amplify economic downturns. See "Amendments to the Capital Requirements Regulation (CRR III)" for a review of the most important vulnerabilities in the Norwegian financial system.
Low growth in the Norwegian economy, but prospects for higher household purchasing power
Growth in the Norwegian economy has been low since the beginning of 2023, and increased living costs have dampened household consumption. Employment rates are high, but unemployment has risen somewhat from a low level. Inflation has fallen substantially from the peak in autumn 2022 but remains above the 2% inflation target. In Monetary Policy Report 3/2024, inflation is projected to gradually decline and approach the target towards the end of 2027. Labour force growth is projected to outpace employment growth, and unemployment is projected to rise somewhat to around the pre-pandemic level. Furthermore, real wage growth is expected to rise substantially in 2024, and in combination with higher employment, this will strengthen household purchasing power.
Risk of negative events that could weaken financial stability
In spite of reduced uncertainty relating to inflation developments and a higher likelihood of a soft landing for the global economy, considerable uncertainty persists about economic developments ahead. In the October 2024 Global Financial Stability Report, the IMF points out that the likelihood of substantial economic shocks has risen due to heightened economic and geopolitical uncertainty. The heightened uncertainty must be viewed in the context of ongoing military conflicts and uncertain outcomes of policies that will be implemented in the many countries holding elections this year. Policy uncertainty ranges from financial policy and budget deficits to trade policy and geopolitics. The European Central Bank (ECB) highlights in its Financial Stability Review from November that rising global trade tensions, in addition to geopolitical uncertainty, elevate the risk of negative events. Substantial uncertainty itself can also impact financial stability in several areas (see "Uncertainty and financial stability"). So far, there is little evidence of this in Norway.
In addition, the IMF emphasises that the high level of uncertainty, particularly related to geopolitical risk, thus far appears not to have materialised in increased financial market volatility. Furthermore, they note that this may increase the risk of large movements in financial markets and price corrections in the event of future shocks. The financial market turbulence in early August illustrates how changes in market sentiment can quickly increase market volatility (see "Short-lived turbulence in international financial markets in August").
Uncertainty and financial stability
Uncertainty can impact financial stability in several areas. First, changes in market sentiment can have a greater impact on financial markets when uncertainty is high. This may contribute to funding and financing problems for governments, banks and firms. Increased uncertainty may also contribute to the deferral of consumption and investment by households and firms. Such tightening may in turn cause firms’ earnings and debt-servicing capacity to decline and result in higher credit risk and thus amplify an economic downturn through tighter bank lending practices. Furthermore, heightened uncertainty about economic developments may make assessing credit risk more difficult for banks, leading to tighter lending practices. High uncertainty may also contribute to reducing market liquidity, leading to less efficient redistribution of risk and capital and weakening banks’ ability to realise securities from their liquidity reserves without pushing down market prices and thus the value of their liquidity reserves.
Uncertainty regarding developments in global commercial real estate (CRE) persists. From a financial stability perspective, CRE is important as such firms are often highly indebted and the banking system’s exposure to this sector is substantial. Higher interest rates have driven down commercial property prices in recent years. Although there are signs that prices are stabilising in many countries, there is still a risk of a price fall. This risk is amplified by structural changes in demand, such as increased remote working following the pandemic. However, there is no sign of significantly weaker demand for office space in Norway as a result of employees working remotely.
The IMF also emphasises that technological changes may impact financial stability in different ways. Artificial intelligence (AI) may boost financial stability prospects through improved risk management, increased market liquidity and enhanced market monitoring. This may also increase capital market efficiency through improved processing of both structured and unstructured information. On the other hand, the use of AI may increase market volatility in connection with unexpected events, particularly if many market participants rely on algorithms that respond similarly to news. Furthermore, widespread use of AI can increase operational risk as services are delivered by a relatively small number of providers. The development may also increase the risk of cyber attacks and market manipulation.
Norges Bank’s systemic risk survey conducted in October shows that Norwegian financial market participants consider international political tensions and cyber attacks to be primary sources of risk in the Norwegian financial system (Chart 1.3). The overall assessment of respondents is that the probability of an incident having a substantial impact on the financial system occurring in the next three years has increased somewhat, but they are confident that the Norwegian financial system will remain stable.
Norges Bank’s systemic risk survey from October 2024. Which source of risk do you consider most likely?
Households and firms have ample access to credit
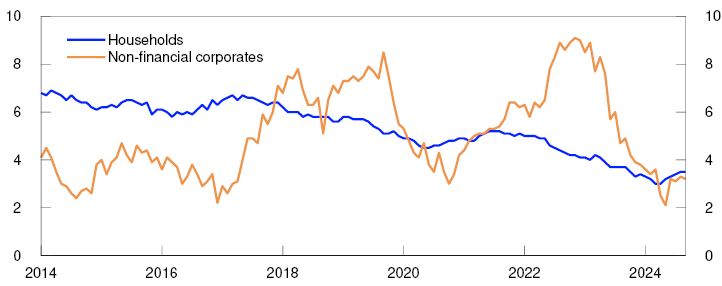
In Norway, household credit growth declined substantially through 2023. It has increased somewhat so far in 2024 but remains low (Chart 1.4). Firms’ credit growth is also low compared with previous years. Rather than tighter credit standards, the low credit growth largely reflects moderate credit demand. Norwegian households and firms still have ample access to credit. In Norges Bank’s lending survey, banks reported unchanged credit standards in Q3.
12-month change in credit to households and non-financial corporates (C2). Percent
House prices increase due to low residential construction and higher household purchasing power
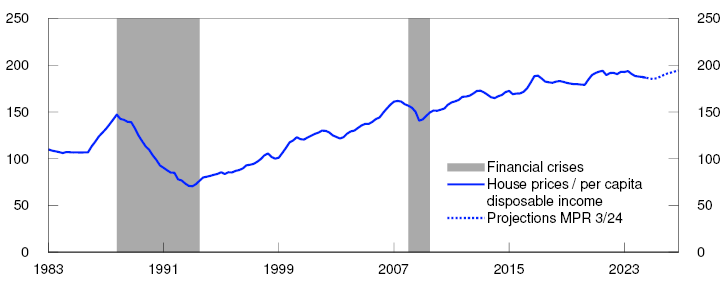
For a long period, house prices outpaced household income (Chart 1.5). This has increased household sector vulnerability as household debt ratios have also increased (see "The interaction between house prices and debt"). In recent years, house prices as a share of disposable income have levelled off. Looking ahead, house prices are expected to rise somewhat faster than incomes.
Index. 1998 Q4 = 100.
The interaction between house prices and debt
The housing market is key to the assessment of financial stability. This primarily reflects the mutual dependence of house prices and debt. Residential mortgage loans account for most household debt. Higher house prices raise the value of collateral and thus increase borrowing opportunities. Higher house prices can result in increased credit demand and improved access to credit can boost house prices through elevated housing demand.
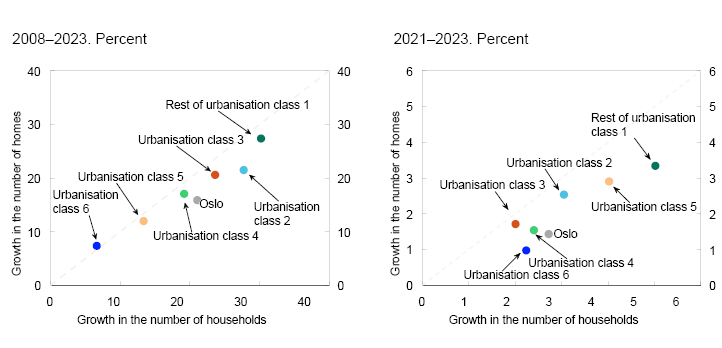
House price developments are determined by a number of factors, including interest rates, income and the tax system. In addition, the supply of houses is a key driver of house prices over time. Over a long period, the increase in the number of homes has been lower than suggested by household formation (Chart 1.6). This applies in particular to urban high-demand areas, and the gap has increased in recent years.
Higher interest rates and high construction costs have led to a marked fall in residential construction. In recent years, prices have increased more for new homes than existing homes, dampening new home sales. However, so far in 2024, prices have increased more for existing homes than new homes. In recent months, turnover of existing homes has been high, a high number of homes have been listed for sale, and new home sales, while still low, have picked up a little. Recently sold residential construction projects will take some time to be launched, which also suggests weak growth in housing investment in the coming quarters.
Looking ahead, prices for existing homes are expected to rise on the back of a low supply of new homes, increased household purchasing power and lower residential mortgage rates further out. Reduced price differences between new and existing homes are expected to contribute to boosting new home sales. Overall, increased sales and higher real house prices will lift housing investment further out in the projection period (See Monetary Policy Report 3/2024).
1 Period: 1 January 2019 – 22 November 2024.
2 Period: 2 January 2019 - 22 November 2024.
Right panel:
VIX and MOVE indexes measure expected 30-day volatility in equity and fixed income markets, respectively. The indexes are derived from option prices.
3 Based on Norges Bank’s systemic risk survey conducted in October. A sample is taken of participants in the Norwegian financial system and the responses reflect risk assessments when the survey was conducted.
The chart shows the main sources of risk in the Norwegian financial system according to the respondents.
4 Period: January 2014 – September 2024
Non-financial corporates in mainland Norway.
5 Period: 1983 Q1 - 2026 Q4.
Projections from 2024 Q4 from MPR 3/24 for house prices as a share of per capita disposable income.
6 Increase in the number of households and homes, by urbanisation class (urbanisation class 1 being the most centrally located).
1.2 Banks are resilient
Banks are solid and losses remain low
Norwegian banks meet their capital and liquidity requirements by ample margins. The banks’ funding markets have functioned well since the May Report. Risk premiums on banks’ wholesale funding are little changed, and deposit-to-loan ratios are stable.
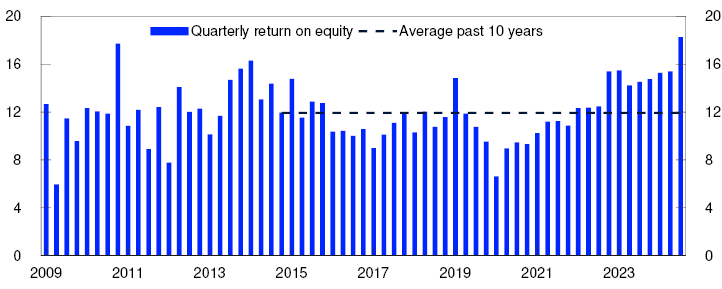
Current earnings are banks’ first line of defence against losses. Large Norwegian banks’ return on equity has been high over the past two years (Chart 1.7) and so far in 2024, this is on track to be higher than projected in the May Report. High profitability primarily reflects high net interest income and low credit losses.7 Increased net interest income is linked to higher interest rates.8 The policy rate has been kept unchanged so far in 2024 and net interest income has remained elevated. A lower policy rate ahead is expected to reduce net interest income somewhat.
Return on equity after tax for large banks. Percent
It is uncertain how margins and profitability will be affected by competition and structural changes. Competition may be weakened if there are fewer suppliers of banking services. However, should the ongoing mergers provide economies of scale, eg in IT and compliance, they could help lower costs and margins. Mergers may also be a factor in enabling more banks to compete for large customers.
Banks’ credit losses remain low (Chart 1.8), but corporate credit losses have increased somewhat so far this year. Norges Bank expects low economic growth, continued high interest expenses and low construction activity to contribute to somewhat higher default rates and corporate credit losses ahead, in particular in real estate development and construction (for more details, see Section 3). CRE prospects have improved somewhat, but future developments remain uncertain. If rental income developments in the CRE sector prove markedly weaker than expected and selling prices fall markedly, banks could face substantial losses.
Credit losses as a share of gross lending to customers. Percent

Losses on loans to households are low. Looking ahead, higher real household disposable income is expected to strengthen debt-servicing capacity and the loss rate on household exposures is expected to remain at a low level.
Norwegian banks’ financial strength gives them the flexibility to extend loans to creditworthy firms and households, even in the event of market stress and higher losses. Common Equity Tier 1 (CET1) ratios are well above total capital requirements and above banks’ own target ratios. In January 2025, amendments will be made to the EU’s Capital Requirements Regulation (see box above). Finanstilsynet’s (Financial Supervisory Authority of Norway) proposed implementation of the regulatory framework in Norway reduces the capital requirement for banks that use the standardised approach and is expected to increase the requirement somewhat for IRB banks.
The stress test in Financial Stability Report 2024 H1 showed that the largest Norwegian Banks overall are capable of absorbing large losses, while still continuing to maintain lending to households and firms, and thereby will not contribute to amplifying an economic downturn.
Amendments to the Capital Requirements Regulation (CRR III)
With effect from 1 January 2025, extensive amendments will be made to the EU’s Capital Requirements Regulation (CRR III). These amendments complete, among other things, measures proposed by the Basel Committee on Banking Supervision to increase banks’ resilience to crises. The Ministry of Finance’s aim is to enable corresponding EEA rules to simultaneously enter into force in Norway. The amendments include a more risk-sensitive standardised approach for estimating capital requirements for credit risk, limits for the use of IRB models and the introduction of an IRB floor. With this floor, from 1 January 2030, the capital requirement cannot be below 72.5% of what it would have been under the standardised approach. A new common approach for capital requirements for operational risk is also included.
Under the standardised approach typically used by small banks, the changes will mean lower capital requirements for low-risk exposures. The standardised approach uses risk weights set by the authorities, which will be reduced for mortgages when the new regulations are introduced. IRB banks, which use their own or internal models to calculate capital requirements and are usually large banks, will have less flexibility under the new rules.
The amendments are expected to reduce the current differences in capital requirements between small and large banks and may strengthen the competitiveness of small banks.
Key vulnerabilities in the Norwegian financial system
The economy is regularly exposed to shocks that affect both the real economy and the financial system. Promoting financial stability means ensuring sufficient financial system resilience to absorb such shocks. In this work, Norges Bank focuses on assessing systemic risk. The financial system should contribute to stable economic developments by channelling funds and offering savings products, executing payments and efficiently distributing risk. Systemic risk is the risk of disruption to the financial system’s ability to perform these functions.
The level of systemic risk depends on a number of factors. The risk of economic shocks, such as geopolitical tensions, pushes up systemic risk. Financial system vulnerabilities further increase systemic risk. Chart 1.A summarises Norges Bank’s key assessments of vulnerabilities in the Norwegian financial system.

The high indebtedness of many households is a key vulnerability. In Norway, household DTI ratios are very high, both historically and compared with other countries. This vulnerability has built up over time as debt levels rose more than household income over an extended period. In the years preceding the pandemic, debt growth slowed and was more closely in line with income growth. Over the past two years, debt has risen less than income. Further out, such developments can reduce household vulnerability to higher interest rates or a loss of income. On the other hand, vulnerabilities could increase again if looser financial conditions result in rapidly rising house prices and debt. For a more detailed discussion of household vulnerabilities, see Section 2.
Another key vulnerability is banks’ high CRE exposure. Higher financing costs have reduced CRE profitability, and lower property values have weakened solvency. With selling prices levelling off and lower refinancing risk, CRE sector prospects are now somewhat better than they were one year ago. However, the outlook still remains uncertain. If interest rates and risk premiums rise markedly, or rental income developments prove markedly weaker than envisaged, then profitability and property values will weaken. See Section 3 for a more detailed discussion of the CRE sector.
Furthermore, banks in Norway are interconnected through interbank exposures and common or similar securities in their liquidity reserves (see Financial Stability Report 2024 H1). Covered bonds account for a substantial share of banking groups’ wholesale funding. At the same time, banks own over 60% of outstanding covered bonds issued in NOK. In the event of simultaneous fire sales of covered bonds by multiple banks, bond prices may fall sharply, reducing the value of banks’ liquidity reserves. Moreover, it could then become even more difficult for banks to obtain fresh funding, weakening their resilience to further liquidity problems.
Digitalisation makes the financial system more efficient but also gives rise to vulnerabilities. Concentration, complexity and interconnectedness may amplify the consequences of a cyberattack that then spills over to the rest of the financial system (see Financial Infrastructure Report 2024). If the overall consequences are extensive, financial stability could be threatened.
Furthermore, banks’ substantial exposures to sectors that are particularly vulnerable to climate transition are a financial system vulnerability (see Financial Stability Report 2024 H1). The Norwegian business sector must adapt to climate change and the use of new forms of energy. There is considerable uncertainty about the cost of such a transition, and some firms may see their earnings weaken. If many firms are adversely affected, this may result in higher bank losses.
However, the financial system can be designed to be more resilient to shocks. In response to financial system vulnerabilities, a number of measures have been introduced to strengthen the system’s resilience, such as solvency and liquidity requirements and requirements for banks’ credit standards.
7 The increase in Q3 is caused primarily by the realisation of returns resulting from the merger of Eika Forsikring AS and Fremtind Forsikring AS.
8 When the policy rate is raised, banks’ interest income increases more than their interest expenses because banks have more interest-bearing assets than interest-bearing liabilities (equity effect). In addition, banks tend to raise the average lending rate more than deposit rates (interest margin increase).
9 Period: 2009 Q1 – 2024 Q3.
Figures for the seven largest Norwegian-owned banking groups. Annualised.
For comparability, the sample is retrospectively adjusted for major mergers and aquisitions, ie for the period preceeding a merger or aquisition, the figures for the merged banks are included.
10 Period: 2018 Q1 – 2024 Q3.
All banks and mortgage companies in Norway. Annualised.
Branches and subsidiaries abroad are not included.
2. Households are able to service debt in the face of higher costs
Norwegian households have high debt-to-income (DTI) ratio, and Norges Bank has long considered high household debt to be a key vulnerability in the Norwegian financial system. The combination of high indebtedness and floating-rate loans1 required most households to spend a considerably larger share of their income on interest payments when lending rates rose through 2022 and 2023. High inflation and higher interest rates have led to tighter finances for most households, and for some this has been difficult to manage. However, default rates have remained low, reflecting high employment and the sound financial basis of most households provided by financial buffers.
1 In Norway, floating-rate loans account for 94% of total household debt.
2.1 Debt-to-income ratios decline from a high level
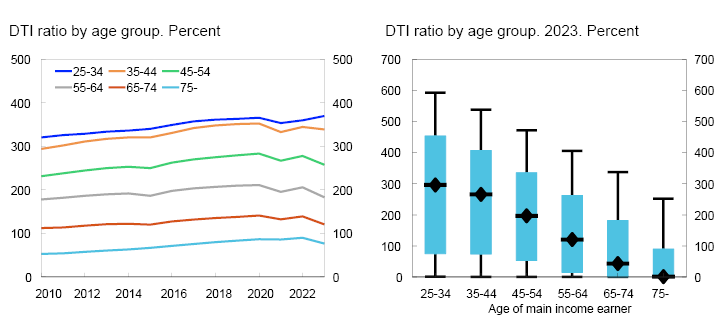
Norwegian households’ DTI ratio2 rose over many years and is high both historically and compared with other countries (Chart 2.1). The DTI ratio has declined somewhat in recent years. The decline is broadly distributed across age groups (Chart 2.2, left panel). Finanstilsynet’s residential mortgage lending survey for 2024 also shows a slight decline in debt as a share of gross annual income among borrowers that take out new residential mortgages.3
Percent
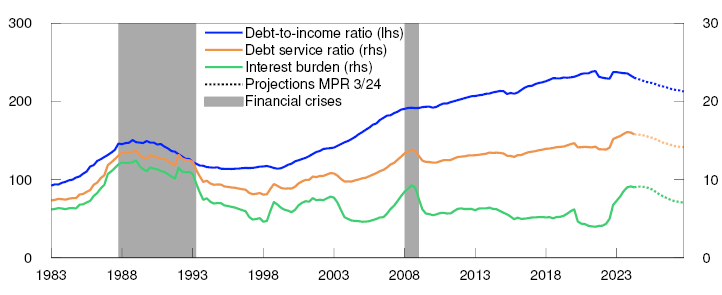
Low household debt growth is expected in the coming years (see Monetary Policy Report 3/2024) and, combined with prospects for higher disposable income, this will reduce the household DTI ratio further out in the projection period. With a lower DTI ratio and an expected decline in lending rates, the interest burden and the debt service ratio6 will also gradually decrease. This may make it easier for households to service their debt. Should the DTI ratio decline over time, households may become less vulnerable to interest rate increases and a loss of income.
In a well-functioning credit market, households have access to credit in periods when income is low and save in periods when income is higher. This results in a distribution of consumption over a life cycle that is better adjusted to households’ needs. Norwegian households have historically accumulated substantial debt due to such considerations, owing primarily to home purchases early in life. Consistent with this, DTI ratios are found to be particularly high among younger age groups when many households buy their first home or trade up in the housing market (Chart 2.2, left panel).
At the same time, there are wide differences within each age group. In the 25–34 age group, more than 10% of households had DTI ratios of more than six times after-tax income in 2023 (Chart 2.2, right panel). Within the 34–45 age group, there is also a large group with high debt levels. Both the differences within age groups and the percentage with high debt levels decline markedly with age. In the 45–54 age group, 10% have DTI ratios of close to five times after-tax income, while for those with the highest debt levels in the 65–74 age group, DTI ratios are 3.5 times after-tax income.
Households are able to service debt in the face of higher costs
In 2022 and 2023, a large number of households experienced less financial flexibility. Purchasing power fell in response to higher interest rates and because price inflation was higher than wage inflation. Household consumption fell in 2023, but the decline was less pronounced than the fall in disposable income. The saving rate fell to a low level in 2023. Changes in saving behaviour are discussed in more detail in Section 2.3.
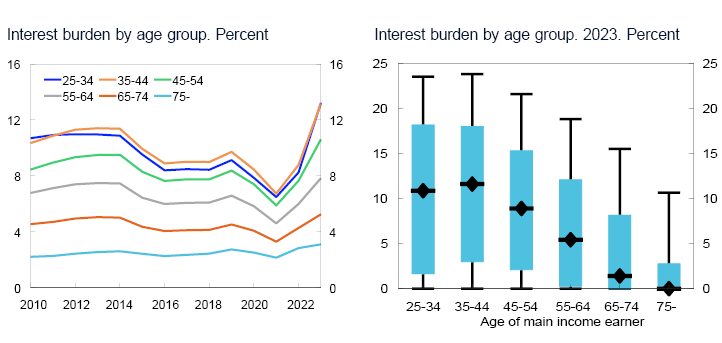
Chart 2.3 Marked increase in interest burden for all age groups7
ISources: Norwegian Tax Administration, Statistics Norway and Norges Bank
The interest rate increases have led to a rise in average household interest burdens from about 4% at the end of 2021 to about 9% at the start of 2024 (Chart 2.1). The interest burden rose substantially for all age groups in 2023 (Chart 2.3, left panel). The rise was most pronounced for the younger age groups where DTI ratios are highest. However, there are also large groups with high DTI ratios in the older age groups. Through to the 65–74 age group, more than 10% of households had interest burdens above 15% of after-tax income in 2023 (Chart 2.3, right panel).
In addition to the rise in the interest burden in recent years, other costs have also increased. Food expenditure in particular has risen (Chart 2.4). Nevertheless, most households have been able to both service their debt and cover normal living expenses out of current income, but the remaining discretionary income has been substantially reduced in recent years.8 In 2021, average household discretionary income was about half of after-tax income based on the definitions in this Report. Higher costs reduced this share through 2022 and 2023, while lower principal payments owing to the repayment of self-amortising mortgages and somewhat lower estimated electricity expenses cushioned the decline. The reduction in discretionary income results in less room for financial saving, real investment and other consumption.
Expenses as a share of after-tax income. Percent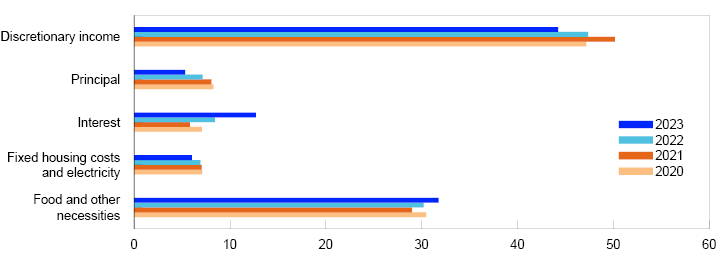
Discretionary income also continued to account for a substantial share of most households’ after-tax income in 2023 (Chart 2.5). At the same time, about 40% of households’ have discretionary income below 30% of after-tax income and many of these households have experienced a relatively large reduction in discretionary income in recent years. Moreover, some households have negative or very low discretionary income. Households without discretionary income or accumulated savings may be at risk of default (see Section 2.3). In 2024, interest rate levels have risen slightly. At the same time, real wage growth is expected for large groups of households. Most households’ discretionary income will likely remain buoyant or rise slightly through 2024.
Share of homeowners in different discretionary income ranges. Percent

2 Debt as share of disposable income.
3 Finanstilsynet’s residential mortgage lending survey follows up the requirements in the Lending Regulations and asks households about debt as a share of gross income. The Regulations require that total debt does not exceed 500%.
4 Period:1983 Q1 – 2027 Q4
Projections from 2024 Q3 from MPR 3/24.
Debt-to-income ratio is debt as share of disposable income. Disposable income is after-tax income less interest expenses. Debt service ratio is interest expenses and estimated principal payments on loan debt as a percentage of after-tax income. Interest burden is interest payments as a percentage of after-tax income.
5 Left panel:
Period: 2010–2023.
Debt-to-income ratio is defined as debt as a share of disposable income. Disposable income is net income after tax and interest rate espenses. The age groups are determined by the main income earner. Households under 25 years old and self-employed households are excluded.
Right panel:
The box plots show the 10th, 25th, 50th, 75th and 90th percentiles.
6 Debt service ratio is the sum of interest expenses and estimated principal payments as a percentage of after-tax income.
7 Left panel:
Period: 2010–2023.
Interest burden is interest expenses as a share of income after tax.
Households are assigned to the age group of the main income earner. Households under the age of 25 and self-employed households are excluded.
Right panel:
The box plots show the 10th, 25th, 50th, 75th and 90th percentiles.
8 Normal living expenses include expenditure related to food, clothing and other ordinary consumption, fixed housing expenses and electricity, but not restaurant dining, holidays or gifts. See Lindquist, K.-G, H. Solheim and B.H. Batne (2022) "Norske boligeiere har god gjeldsbetjeningsevne." [Norwegian homeowners’ debt-servicing capacity is adequate] Staff Memo 8/2022. Norges Bank, for a detailed description of normal living expenses and discretionary income. Note that the analysis is limited to households that own their home. Homeowners account for about three quarters of the dataset.
9 Period: 2020–2023.
Self-employed and homeowning households where the main income earner under the age of 20 or over the age of 90 are excluded. Top and bottom 1 percent income earners and top 1 percent financial wealth holders are excluded.
Discretionary income is the income households are left with after tax, debt repayments and normal expenses. Debt-related expenses include interest payments and, if the loan-to-value ratio exceeds 60 percent, principal payments. Normal expenses cover food and other basic consumption, and expenses related to housing. Food and other necessary consumption are based on the size of the household and Consumption Research Norway’s reference budget. Expenses related to housing include municipal fees, property tax and insurance. In addition, electricity expenses are estimated using the size of the house, type and electricity zone.
10 Calculations for 2023. Self-employed and households where the main income earner is under the age of 20 or over the age of 90 are excluded. Top and bottom 1 percent income earners and top 1 percent financial wealth holders are excluded.
Discretionary income is the income households are left with after tax, debt repayments and normal expenses. Debt-related expenses include interest payments and, if the loan-to-value ratio exceeds 60 percent, principal payments. Normal expenses cover food and other basic consumption, and expenses related to housing. Food and other necessary consumption are based on the size of the household and Consumption Research Norway’s reference budget. Expenses related to housing include municipal fees, property tax and insurance. In addition, electricity expenses are estimated using the size of the house, type and electricity zone.
2.2 There is a limited risk of mortgage default
Even though the purchasing power of many households has been reduced, Norges Bank has so far not observed a particularly pronounced rise in the household default rate. Nor has there been an increase in the number of payment remarks among households over the past year.
Default rates among Norwegian households have been low since the banking crisis in the 1990s. Household interest burdens are now at their highest level since the banking crisis (Chart 2.1). The risk of extensive default is nevertheless considered limited, partly owing to strong real income growth in recent decades. Higher real income has provided households with more financial flexibility, which can be used for consumption and debt servicing. In addition, the Lending Regulations set the framework for banks’ credit standards and have helped prevent even higher debt accumulation (see "About the data underlying the analyses in this section"). The build-up of both financial wealth and housing wealth has improved the household sector’s financial position. In addition to current income, accumulated wealth can be drawn upon to cover normal expenses and service debt. A margin is therefore estimated that takes into account both income and wealth, and it is assumed that households have been granted interest-only periods in the event of payment problems. A negative margin means that households are incapable of paying interest unless they reduce consumption to below a normal level (Chart 2.6). In the sample, 1.4% of households may have a negative margin based on the residential mortgage rate in 2024. This is an increase of about 20 000 households compared with 2021. Overall, these vulnerable households hold approximately 2.2% of residential mortgage debt.
Share of homeowners that may experience payment problems (negative margin) at different interest rate levels and with a loss of income. Percent
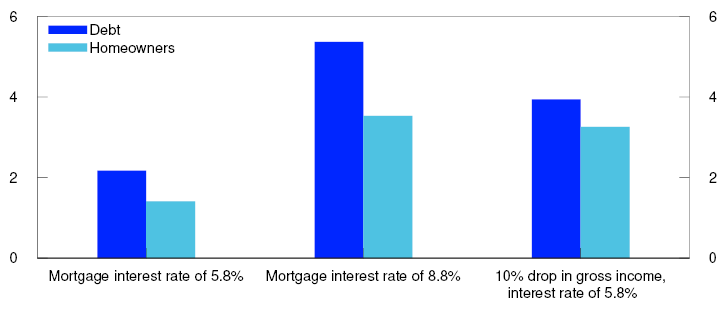
Norges Bank’s estimates indicate that the number of households with a negative margin at current interest rate levels is somewhat lower than suggested by the sensitivity analysis in Financial Stability Report 2023 H2. The analysis was based on household income, debt and wealth in 2021 and indicated that just below 2% of homeowners would have a negative margin at an interest rate of 5.8%, and that these households held approximately 3% of the debt.
There may be several reasons for this difference. Despite having fallen for the average household in this period, the real income of some households rose. A large number of households with small margins are young, but often have above-average income growth. Furthermore, a number of households that were close to having a negative margin in 2021 may have drawn on financial wealth to repay debt in the period, which in turn has reduced their sensitivity to interest rate increases.
There is uncertainty concerning future developments in the Norwegian economy. Norges Bank has conducted a new sensitivity analysis showing that 3.5% of households may have a negative margin at a lending rate of 8.8%, which is 3 percentage points higher than actual interest rates in 2024. This is in line with the lending rate assumed in the stress test presented in Financial Stability Report 2022. The stress test was based on a scenario of high inflation and a severe downturn (Chart 2.6). These households hold approximately 5.4% of residential mortgage debt.
Households may also be affected by higher unemployment and a fall in income. If residential mortgage rates remain at 5.8%, a fall in gross income of 10% increases the share of households with a negative margin by close to 2 percentage points to 4%.
Other negative shocks may also affect households ahead. Climate transition requirements and more extreme weather are examples of effects that may increase in the coming years. This may push up homeownership costs and reduce households’ debt servicing capacity (see "Energy transition will entail costs for homeowners").
11 Calculations for 2023. Self-employed and households where the main income earner under the age of 20 or over the age of 90 are excluded. Top and bottom 1 percent income earners and top 1 percent financial wealth holders are excluded.
A negative margin means that households are incapable of paying interest unless they reduce consumption to below normal. When measuring negative margin, principal payments are disregarded and it is assumed that households with payment issues are granted interest-free periods. Borrowers may also use some of their savings to cover normal expenses and interest payments. This means using deposits and securities funds and increasing the LTV ratio if the loan is less than 60 percent of the value of the home.
2.3 Households have drawn on accumulated savings, but debt repayment behaviour shows little change
When interest rates rise, households must spend more of their income to service debt, but if they expect the decrease in purchasing power to be temporary, several adjustments can be made to reduce the fall in consumption. They can reduce financial saving and, over a period, draw on accumulated savings, such as bank deposits and some securities funds. For households with self-amortising mortgages, the share of principal repayments will be reduced automatically when interest rates rise. If a household experiences debt-servicing problems, they can ask their bank to reduce the principal repayments on their loans. Figures for household income and wealth in 2023 show that households have adjusted their saving behaviour in relation to bank deposits and debt repayment in the face of high inflation and higher interest rates.
The average household saves primarily in bank deposits
Household financial assets can be broadly divided into three main categories. Bank deposits are normally highly liquid and available at short notice. Securities funds and savings in listed equities and bonds are also normally liquid financial assets, but savings in equities will often be subject to a latent tax on historical capital gains. The third category is unlisted equities. Equities not listed on an exchange may be difficult to sell at short notice.
Financial wealth is unevenly distributed (Table 2.1 ). A large majority of households have some bank deposits. The ownership of securities funds and other financial wealth is limited to a small group of households, predominantly high-net-worth individuals. Median bank deposits are almost NOK 200 000, while median holdings of securities funds and other financial wealth are close to zero. A substantial part of the holdings of securities funds and unlisted equities are owned by less than 10% of households. Developments in bank deposits are therefore most important for a typical household.
Table 2.1 Distribution of financial wealth among households. 2022
|
Asset holdings held by the median household. In thousands of NOK |
Share of households with various financial assets. Percent |
Share of total asset holdings held by the top ten percentiles12. Percent |
|
|---|---|---|---|
|
Bank deposits |
205 |
98 |
54 |
|
Securities funds |
0 |
29 |
93 |
|
Other financial wealth |
9 |
58 |
94 |
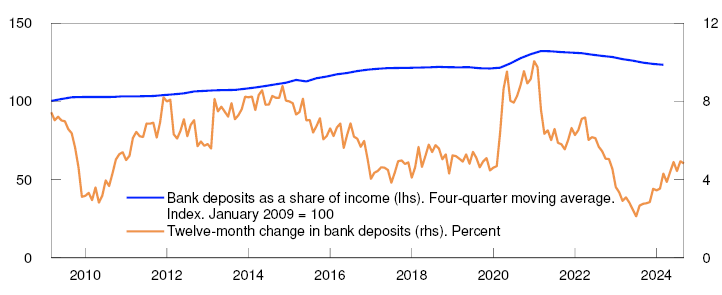
From 2009 to 2021, bank deposits increased more than income (Chart 2.7). Households increased their bank deposits particularly during the first two years of the pandemic. Saving slowed after this period and the 12-month rise in bank deposits moved down through 2022 and until autumn 2023. Bank deposits also fell relative to income during this period. At the end of 2023, income growth started to pick up, and the 12-month rise in bank deposits was 4.9% in August.
Bank deposits relative to income, and growth in bank deposits. Households
Highly indebted households have reduced their bank deposits somewhat
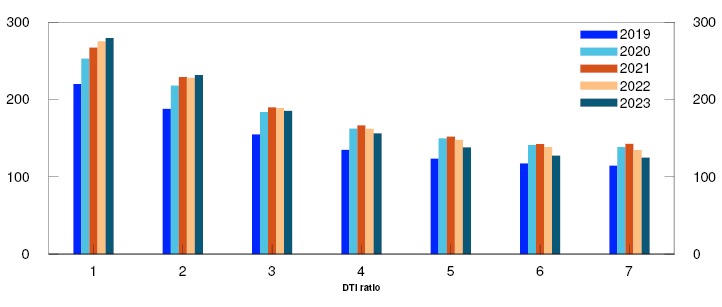
In 2022 and 2023, bank deposits fell the most for households with high DTI ratios (Chart 2.8), which was the most vulnerable group when interest rates rose. The decline in bank deposits steepens as DTI ratios rise, and the reduction in bank deposits in 2023 was slightly below 10% in groups with higher DTI ratios. By comparison, the median household will normally increase bank deposits by slightly more than 5% in a normal year. Bank deposits are still higher than they were before the pandemic, but deposits have risen at a slower pace than consumer prices during this period. This suggests that the ability of households to use bank deposits to cover higher living costs has been reduced somewhat.
Median bank deposits. In thousands of NOK
In line with expectations, bank deposits are unevenly distributed in each debt group (Chart 2.9). About 10% of households have less than NOK 20 000 in bank deposits. At the same time, many households have substantially higher deposits than the median household, also in the groups with high DTI ratios.
Bank deposits by DTI ratio group. 2023. In thousands of NOK

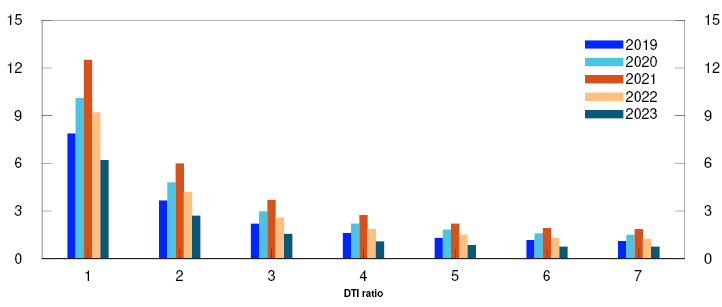
At the end of 2023, most households with high DTI ratios had bank deposits that were approximately equal to their interest expenses in 2023 (Chart 2.10). A simple calculation, in which interest expenses in 2023 are projected using the increase in the average residential mortgage rate in the period between 2023 and 2024, shows that households in the groups with the highest DTI ratios can cover about two-thirds of their interest expenses in 2024 solely by using their bank deposits.
Median bank deposit relative to interest expenses
So far in 2024, aggregated figures from Statistics Norway indicate that households use bank deposits to cover higher living costs to a lesser extent than they did in 2023. Aggregate household deposit growth has accelerated somewhat since the end of 2023 (Chart 2.7). Higher real wages on the back of high wage growth and falling inflation, are now improving households’ ability to cover higher costs out of current income.
Households have made little change to debt repayment and borrowing
Households that cannot or do not wish to spend their savings to reduce the fall in consumption when costs rise, can instead opt to increase borrowing or reduce debt repayment. On the other hand, higher interest rates may mean that some households choose to repay their loans faster than before.
Households that wish to change their borrowing and principal repayments have several options. As most Norwegian households have floating-rate loans, banks can adjust loan terms and permit faster repayment without the borrower incurring premium or discount rates. Households with access to home equity lines of credit can easily increase the loan amount as long as the loan-to-value (LTV) ratio is below 60%. Many households can also quickly access consumer credit at relatively higher interest rates if they so wish.17 Consumer credit has increased somewhat in recent years, but still accounts for less than 3% of total household debt. Furthermore, under a self-amortising mortgage repayment plan, households will automatically pay relatively lower principal repayment instalments when interest rates increase. In the 2024 Q3 lending survey, banks report that almost all loans with principal repayments are self-amortising mortgages.
Norges Bank has explored how households in 2023 changed their debt levels and has focused on highly indebted households – here defined as households with DTI ratios above 3.5 and LTV ratios above 40%. Most changes in debt results from housing transactions. As Norges Bank’s focus is household response to high inflation and higher interest rates – not house purchases – households that have carried out a housing transaction have been omitted from the analysis.18
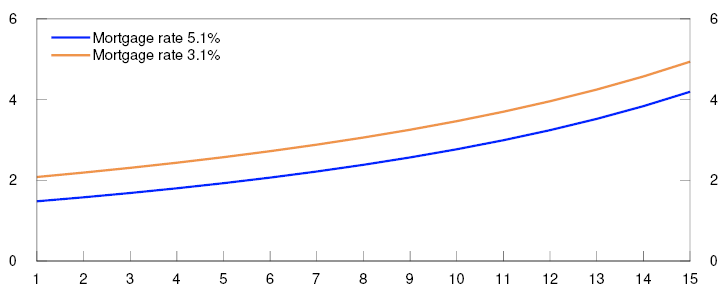
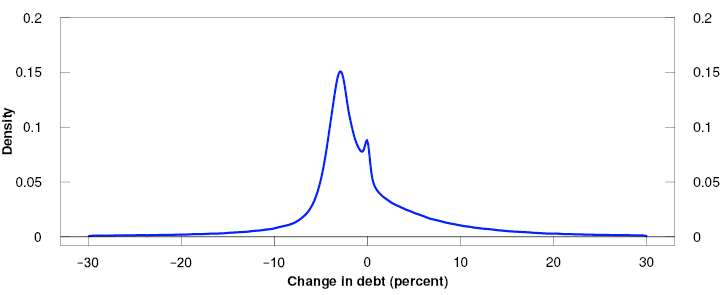
At 2022 and 2023 interest rate levels, a household with a self-amortising mortgage with a repayment period of 30 years will repay between 1.5% and 5% of the debt during the first half of the repayment period (Chart 2.11). A majority of households in the sample are found to repay up to 7.5% of outstanding debt on an annual basis (Chart 2.12). Slightly more than 10% of the debt in any given year is held by households that repay more than 7.5% of debt. At the same time, about one-third of the debt is held by households that increase their debt in any given year, even if they do not buy a house. There is reason to believe that this group will include many households with home equity lines of credit.
Principal as a share of outstanding debt in a 30-year self-amortising mortgage by the number of years into the repayment term at different interest rate levels. Percent
Distribution of changes in debt in the period 2018–2023
The figures indicate that many households follow a repayment plan that correlates with what one would expect from a self-amortising mortgage. For the group that repaid up to 7.5% of the debt in 2022, there is a clearly visible shift towards smaller principal payments in 2023 (Chart 2.13). Median debt repayment for this group fell from 3.0% in 2022 to 2.3% in 2023. This reduction in median debt repayment broadly corresponds to the reduction in principal repayments in the repayment plan for a self-amortising mortgage, given an interest rate increase of slightly above 2 percentage points, which corresponds to the change in the residential mortgage rate in the period between 2022 and 2023.
Distribution of annual change in debt in 2022 and 2023
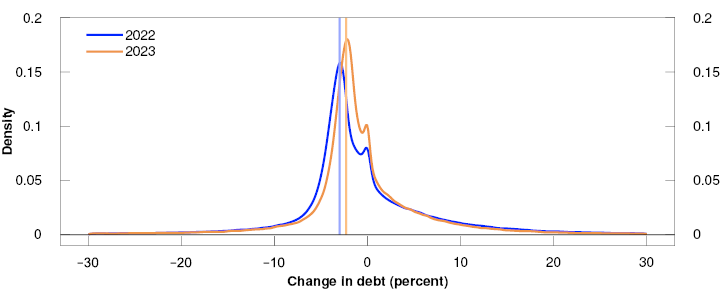
The figures also indicate that the use of interest-only periods increased somewhat in 2023. In 2023, there was a small increase in the share that paid close to zero in principal payments. Norges Bank’s lending surveys in 2023 showed an increasing demand for interest-only periods through the year. However, banks reported in the 2024 Q2 lending survey that applications for interest-only periods have returned to approximately the level preceding the tightening cycle.
Norges Bank has also observed that households in the groups that make substantial changes to their debt levels, have made adjustments in 2023. In the group that makes large repayments, the median repayment increased from approximately NOK 700 000 to just over NOK 800 000 (Chart 2.14). In the group that increases their borrowing, median debt accumulation fell from approximately NOK 200 000 to approximately NOK 150 000.
Median change in debt for different household groups. In thousands of NOK
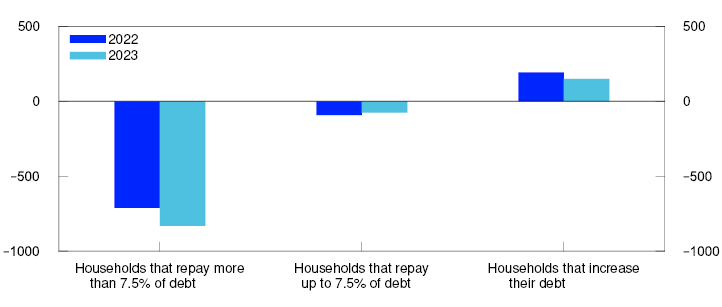
The figures indicate that for many households, reduced principal repayments have helped reduce the fall in consumption in 2023. In addition, more households than before have chosen to increase debt repayment and reduce borrowing, making them less vulnerable to high interest rates ahead. In addition, households do not appear to have drawn more on home equity lines of credit and short-term credit, such as consumer credit, to maintain consumption.
About the data underlying the analyses in this section
Analyses of households are based on statistics, with tax returns as the most important data source. Tax returns contain, inter alia, information about income, debt and financial wealth at the individual household level.
In the period to 31 December 2022, Statistics Norway supplies complete income and wealth statistics for Norwegian households. For 2023, data are used from tax returns processed as of 9 July 2024 by the Norwegian Tax Administration. The data set for 2023 comprises approximately 90% of Norwegian households.
12 The top ten percentiles are calculated for each type of financial asset.
Sources: Norwegian Tax Administration, Statistics Norway and Norges Bank
13 Income is wages paid for all industries. Monthly figures for bank deposits relative to income are calculated using linear interpolation of quarterly figures.
Period:
Bank deposits as a share of income: January 2009 - March 2024.
Twelve-month change in bank deposits: January 2009 - September 2024.
14 Period: 2019–2023.
Debt-to-income (DTI) ratio is debt as a share of income after tax. Households in the net wealth top percentile are excluded.
15 Debt-to-income (DTI) ratio is debt as a share of after-tax income. Households in the net wealth top percentile are excluded.
The box plots show the 10th, 25th, 50th, 75th and 90th percentiles.
16 Period: 2019–2023.
Debt-to-income (DTI) ratio is debt as a share of after-tax income. Bank deposits are measured at year-end, while interest expenses are aggregated interest expenses for the year. Households in the net wealth top percentile are excluded.
17 In a new analysis of data from the debt registry in Norway, Norges Bank explores what affects households’ use of consumer credit. One key finding is that homeownership and thus being able to finance consumption by borrowing against a home reduces the need for consumer credit see Gautan, Getz-Wold, Gulbrandsen og Nenov (2024) "The driving forces behind households’ accumulation of consumer debt". Staff Memo 8/2024. Norges Bank.
18 The remaining selection comprises around 25% of households.
19 We include highly indebted households that have not carried out a housing transaction. Households with DTI ratios above 3.5 and LTV ratios above 40 percent are considered highly indebted. We assume that households have carried out a housing transaction if the value of the home has fallen by more than 10 percent or has increased by more than 20 percent.
DTI ratio is debt as a share of after-tax income. LTV ratio is debt as a share of the value of the home.
20 Period: 2022–2023.
We include highly indebted households that have not carried out a housing transaction. Households with DTI ratios above 3.5 and LTV ratios above 40 percent are considered highly indebted. We assume that households have carried out a housing transaction if the value of the home has fallen by more than 10 percent or has increased by more than 20 percent.
DTI ratio is debt as a share of after-tax income. LTV ratio is debt as a share of the value of the home.
Vertical lines show median of those that repay up to 7.5 percent of debt.
21 Period: 2022–2023.
We include highly indebted households that have not carried out a housing transaction. Households with DTI ratios above 3.5 and LTV ratios above 40 percent are considered highly indebted. We assume that households have carried out a housing transaction if the value of the home has fallen by more than 10 percent or has increased by more than 20 percent.
DTI ratio is debt as a share of after-tax income. LTV ratio is debt as a share of the value of the home.
The Lending Regulations have dampened the build-up of vulnerabilities in the household sector
On 3 October 2024, Norges Bank sent a consultation response (in Norwegian only) to the Ministry of Finance concerning changes in the Lending Regulations that expire on 31 December 2024.
Finanstilsynet has proposed a continuation of the Regulations in their current form. Norges Bank supports Finanstilsynet’s assessment that the Regulations help prevent financial vulnerabilities, and in the Bank’s view, the Regulations should be continued with some adjustments.
The Lending Regulations have set limits on banks’ lending practices and helped prevent an even stronger build-up of debt. The share of households with higher DTI and LTV ratios than the maximum defined in the Regulations was substantially reduced after the Regulations entered into force. In the view of Norges Bank, the Regulations have curbed the build-up of vulnerabilities in the household sector and contributed to fewer families facing problems servicing debt when both prices and interest rates rose markedly in 2022. The regulation of consumer credit from 2019 also helped reduce vulnerability in the household sector.
Access to credit is a good. A well-functioning credit market provides households with the opportunity to borrow in low-income periods against saving in higher-income periods. This results in a distribution of consumption over a life cycle that is better adjusted to households’ needs.
However, based on historical experience, unregulated financial markets may result in more debt than is optimal for society as a whole. High and rapidly rising debt can increase financial system vulnerability, amplify economic downturns and raise the risk of financial crises.1 Financial crises are very costly, both for individual agents and for society as a whole.2 In light of experiences from the banking crisis in the early 1990s and later from the 2008–2010 financial crisis, much has been done to regulate the financial sector, both nationally and internationally, in order to improve the functioning of financial markets.
Several international bodies have emphasised that the regulation of lending to households is an important part of the policymaking toolkit to promote financial stability and prevent financial crises. Both the European Systemic Risk Board (ESRB)3 and the IMF4 have agreed that the Lending Regulations increase financial system resilience. Many countries, including most EU/EEA countries, have introduced lending regulations over the past 10–15 years.
Credit regulation must strike a balance between limiting the build-up of risk in the financial system and ensuring efficient credit markets. Standardised requirements may have undesirable consequences in individual cases and weaken banks’ incentives to assume independent responsibility for assessing risk. Meeting requirements for additional collateral may also be at the expense of other financial buffers.5 Regulation may also have unintended distributional effects. The LTV ratio requirement may prevent individuals with low equity but otherwise solid debt-servicing capacity from entering the housing market without help from their families.6
Such effects from individual requirements must be weighed against the economic benefits of lending regulations. The benefit of reducing the probability of financial crises is substantial. In Norges Bank’s view, there are clear indications that the Regulations have reduced borrowing without significantly preventing creditworthy households from entering the housing market. For that reason, Norges Bank is of the opinion that the Lending Regulations should be continued indefinitely. Permanent Lending Regulations will contribute to predictability and counter future deterioration of banks’ credit standards. The Regulations should, however, be reassessed at regular intervals. It is important to expand knowledge about the effects of the Regulations and the consequences of their individual elements.
In light of the experience gained since the introduction of the Lending Regulations, Norges Bank proposes some changes. Assuming that all other requirements remain unchanged, raising the maximum LTV ratio from 85% to 90% should be considered. Given that the other current requirements remain unchanged, in Norges Bank’s view, such an adjustment would dampen potentially unfortunate distribution effects of this requirement somewhat, without a significant increase in systemic risk. In Norges Bank’s opinion, it should also be assessed whether the interest rate stress test of debt-servicing capacity should give greater consideration to the risk-mitigating effects of fixed-rate loans.
1 See, inter alia, Schularick & Taylor (2012) “Credit Booms Gone Bust: Monetary Policy, Leverage Cycles, and Financial Crises, 1870-2008.” American Economic Review, 102 (2), p. 1029–61, Jordà, Schularick & Taylor (2015) “Leveraged bubbles.” Journal of Monetary Economics, 76, Supplement, p. 1-S20, Jordà, Schularick, & Taylor (2016) “The great mortgaging: housing finance, crises and business cycles.” Economic Policy, 31 (85), p. 107–152, Eggertson & Krugman (2012) “Debt, Deleveraging, and the Liquidity Trap: A Fisher-Minsky-Koo Approach*.” The Quarterly Journal of Economics, 127 (3), p. 1469-1513, and Korinek & Simsek (2016) “Liquidity Trap and Excessive Leverage.” American Economic Review, 106 (3), p. 699–738.
2 See, inter alia, Reinhart & Rogoff (2009) This Time is Different: Eight countries of Financial Folly. Princeton, New Jersey: Princeton University Press, and Jordà, Schularick & Taylor (2013) “When credit bites back.”, Journal of money, credit and banking, 45 (2), p. 3–28.
3 See ESRB (2024) Follow-up report on vulnerabilities in the residential real estate sectors of the EEA countries. February 2024. European Systemic Risk Board.
4 See IMF (2024) Norway: Staff concluding Statement of the 2024 Article IV Mission. Internatial Monetary Fund.
5 See Aastveit, Juelsrud, & Wold (2020) “The leverage-liquidity trade-off of mortgage regulation.” Working paper 6/2020, Norges Bank.
6 Wold, Aastveit, Brandsaas, Juelsrud & Natvik (2023) “The housing channel of intergenerational wealth persistence. ” Working paper 16/2023, Norges Bank, show that help to become a homeowner is one of the most important channels for transferring wealth across generations.
Energy transition will entail costs for homeowners1
To reach lower greenhouse gas emission targets, energy consumption must change. Fossil fuels must be replaced with new energy sources and energy consumption must be reduced. The transition will entail costs in a transition period. Firms and households that are unprepared may face problems servicing debt, potentially posing challenges to banks and financial institutions. An efficient energy transition requires the financial system to be prepared. In a number of reports, Norges Bank has quantified how climate transition could affect banks’ customers. The possible consequences for bank losses arising from an increase in carbon prices are discussed in Financial Stability Report 2024 H1.2
This Report focuses on households. In many sectors, it may be difficult to reduce energy consumption without reducing activity levels. However, the housing sector has a considerable potential for reducing energy consumption without necessarily lowering housing standards, for example, by improving insulation and increasing the use of air source heat pumps. It may also be appropriate to use biofuel as an alternative to electricity.3
New homes have long been subject to strict building standards. In recent years, many countries have also introduced requirements to improve the energy efficiency of existing homes. In the EU, this is set out in the Energy Performance of Buildings Directive.4 In 2023, the Norwegian Ministry of Petroleum and Energy presented its action plan for energy efficiency in which the government asks the Norwegian Water Resources and Energy Directorate (NVE) to explore a target of reducing electricity consumption in the building stock (residential and commercial buildings) by 10 TWh by 2030.5 The analysis is based on the premise that Norwegian homeowners may be required to make investments in the future to improve the energy efficiency of their homes.
To illustrate the potential effects of new energy efficiency requirements, it is assumed that households must carry out comprehensive energy efficiency measures without government subsidies, ie financed by drawing on accumulated savings or increasing debt. Higher debt will lead to elevated costs and reduce discretionary income, which could affect house prices and households’ debt-servicing capacity. Borrowing to implement energy efficiency measures may also breach existing regulations such as the current Lending Regulations.
The calculation uses data on energy consumption per home from Eiendomsverdi and information on homeowner income, wealth and debt from the Norwegian Tax Administration. Simple assumptions have been made regarding energy renovation costs per square metre of living space to calculate the norm for energy use per square metre.6 The estimated average energy renovation cost varies from around NOK 450 000 for a detached house to around NOK 150 000 for a flat (Chart 2.A).
Average estimated renovation cost per housing unit by type. In thousands of NOK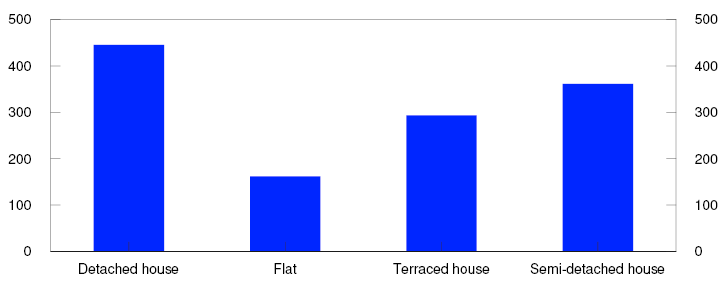
The income, debt and wealth of each homeowner is known. It is explored whether the owner is able to finance the investment, either with bank deposits (where there must be at least NOK 100 000 remaining in the homeowner’s account) or by increasing debt without breaching the debt-to-income and loan-to-value requirements in the Lending Regulations.
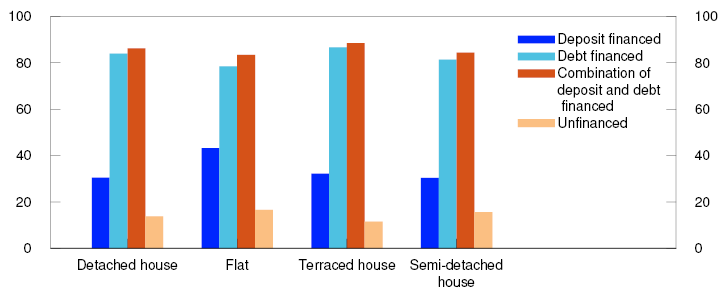
The analysis indicates that around 40% of households can finance the investment solely with bank deposits (Chart 2.B). Around 80% can cover investment expenses by taking out loans in accordance with the Lending Regulations, and a further 8% can cover costs by using bank deposits as well. Around 12% are unable to cover such investment costs under the stipulated assumptions. Around half of these households have neither bank deposits nor the possibility to borrow to cover even fairly small investments.
Chart 2.B Approximately 90 percent of households can cover renovation costs with bank deposits or by borrowing8
Possible forms of financing for residential renovation costs. Share of homeowners. Percent
Sources: Eiendomsverdi, Norwegian Tax Administration and Norges Bank
The significant decline in electricity expenses resulting from this investment must also be considered when calculating financing costs. It is assumed that a home’s post-investment energy consumption will equal the calculated norm. Costs are considerably reduced when electricity savings are taken into consideration, however, the investment will be a net expense for the average household at current residential mortgage rates and electricity prices (Chart 2.C). This is also the case when assuming a reduction in residential mortgage rates of two percentage points or a doubling of electricity prices, both of which will improve returns on investment. The investment will therefore weaken homeowners’ liquidity and furthermore their ability to service existing loans.
Net cost of energy efficiency measures fully debt-financed. By income group. Percent of after-tax income

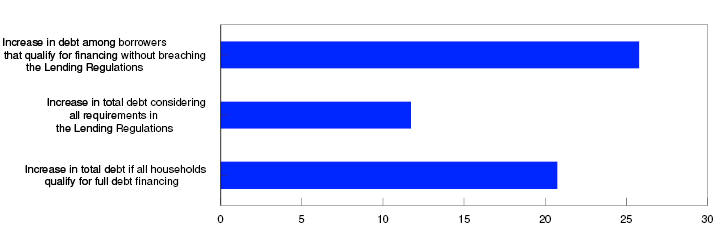
At the same time, the demand for credit is increasing. If all households cover their investment needs by borrowing, total credit needs will increase by around 20% (Chart 2.D). Banks will therefore play a key role in the transition process.
Percentage increase in debt for different groups that finance renovations only by borrowing
It must again be emphasised that this calculation assumes the introduction of strict requirements within a short time span without transitional arrangements or other government measures. It is not a projection for how a transition will play out. Nevertheless, the calculation may illuminate some financial stability risk factors and be seen as an order-of-magnitude estimate of the transition costs. There is reason to believe that energy efficiency requirements will be introduced and that they may carry significant costs for many households, even when lower energy consumption returns are taken into consideration. Other types of climate risk, such as an increased frequency of extreme weather events, may result in similar consequences. The risk of higher costs for homeowners must be considered by banks in their credit assessments. To adequately assess potential risk, banks must have sufficient information on the energy consumption per home and potential improvements. Homes are required to have an energy label rating in Norway, but there is room for improvement in both the methodology and the scope of the assessment. This analysis also supports the climate analysis presented in Financial Stability 2024 H1, which notes that higher emission taxes may lead to somewhat higher bank losses and a marked rise in the need for new loans.
1 The box expands upon Solheim, H. and Vatne, B. H. (2024), “Energiomstilling av bolig: konsekvenser for husholdningenes gjeldbetjeningsevne og gjeldsopptak” [Residential energy transition: consequences for households’ debt-servicing capacity and borrowing”, Staff Memo 7/2024. Norges Bank.
2 Hjelseth, I.N., R.M. Johansen and H. Solheim (2024): “Firms’ transition to lower greenhouse gas emissions and the risk in Norwegian banks”, Staff Memo 3/24. Norges Bank
3 It must be noted that the most efficient way to reduce energy consumption in homes is to accept lower indoor temperatures when it is cold and smaller living space than today. These are measures that will reduce quality of living. In the following, we disregard such adjustments.
5 “Handlingsplan for energieffektivisering i alle deler av norsk økonom” i (regjeringen.no) [Action plan for energy efficiency in all parts of the Norwegian economy] (in Norwegian only). The target was set in Report No. 25 to the Storting (2015–2016) “Kraft til endring – Energipolitikken mot 2030” [Power for change – The energy policy towards 2030] (in Norwegian only).
6 The norm is set as energy consumption per square metre of the 15% most energy-efficient homes of the same housing type in the same county.
7 Renovation costs to bring homes to the norm. The norm is set as the energy use per square metre of the 15 percent most energy efficient homes of the same housing type in the same county.
8 For each home, the owner’s income, debt and wealth are known. It is explored whether the owner is able to finance the investment either with deposits (where there must be at least NOK 100 000 remaining in the homeowner’s account) or by increasing debt without breaching the debt-to-income or loan-to-value requirements in the Lending Regulations.
9 The cost takes into account a considerable reduction in electricity expenses. The energy consumption in the home is assumed to equal the norm.
10 Requirements in the Lending Regulations refer to:
Borrowing limited to five times gross income and to 85 percent of the value of the home.
3. Somewhat improved CRE prospects but still challenging for real estate developers
In the financial stability assessment, Norges Bank is particularly concerned with developments in the CRE sector and among real estate developers because Norwegian banks’ relative exposure to these sectors is substantial. While all sectors have been affected by rising interest rates in recent years, the impact on the real estate sector has been particularly pronounced owing to often high debt-to-earnings ratios. However, growth in the Norwegian economy has remained buoyant, which has helped most firms cover higher interest expenses. Prospects for the CRE sector are now somewhat improved, but conditions remain challenging for real estate developers.
3.1 Firms are solid, but interest expenses erode profitability
Corporate financial positions were somewhat weaker at end-2023
Overall, corporate financial positions were solid during the pandemic years 2020 and 2021.1 Developments have since weakened somewhat in pace with higher interest rates, particularly in real estate (CRE firms, construction firms and real estate developers). These firms have also been affected by a low level of construction activity. The interest rate increases have also influenced consumer-facing sectors such as retail trade and household services through lower household consumption. However, following weak developments in 2023, consumption has picked up so far in 2024.
For listed companies, figures for 2024 indicate some improvement in financial positions but differences across sectors are wide. Information from Norges Bank’s Regional Network indicates that economic growth will pick up a little from current weak levels in the second half of 2024 (see Monetary Policy Report 3/2024).
Overall corporate sector solvency is strong. Equity ratios have risen steadily over an extended period and have remained relatively stable in recent years (Chart 3.1). However, profitability as measured by firms’ operating margins showed somewhat weaker developments in 2023. In sectors with high debt-to-earnings ratios, such as real estate development and CRE, the decline primarily reflects higher interest expenses (Chart 3.2). Not since the financial crisis in 2008 has real estate development profitability adjusted for interest expenses been as low.
Equity ratios. Percent

Operating margins before and after interest expenses. Percent
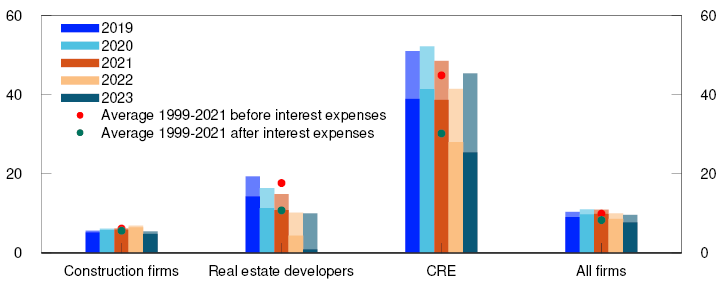
So far in 2024, profitability has improved slightly for some large real estate developers and CRE firms that report quarterly, but less than for other sectors. However, the profitability of some construction firms that also report quarterly was slightly weaker. In September, construction contacts in Norges Bank’s Regional Network expected activity levels to decline in 2024 H2.
Liquid buffers increase firms’ resilience to periods of reduced earnings. During the pandemic, corporate bank deposits increased more than firms’ current liabilities but have since fallen back (Chart 3.3). For real estate developers, liquid buffers have fallen markedly below their historical average.
4Bank deposits as a share of current liabilities. Percent
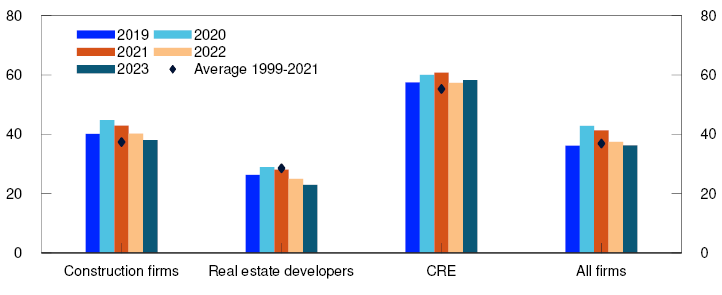
The real estate sector’s importance for financial stability
The financial position of real estate firms is important for financial stability because their problems can result in bank losses. Banks have historically suffered higher losses on loans to the corporate sector than to households.
At year-end 2023, CRE and real estate development loans amounted to 55% of Norwegian banks’ total corporate exposures. Construction firms account for a smaller share of banks’ corporate exposures but a higher share of those employed in real estate.
In a construction project, real estate developers normally own the project and take out loans secured on the project. For developers to be able to access financing, banks normally require either a considerable share of the units to be pre-sold or a binding lease agreement. The contractor and sub-contractors are responsible for building construction. When a unit is completed, ownership is normally handed over to a household if the property is residential or to a CRE firm if the property is commercial. The new building usually becomes a part of the CRE firm’s existing portfolio of commercial properties for rent. Banks play a key role in financing building purchases, both for households and CRE firms. For CRE firms, banks also play a key role in refinancing loans.
Banks’ credit risk on exposures to real estate development and CRE is closely linked to price developments in the real estate market. For real estate development exposures, the risk also reflects the demand for new commercial and residential buildings, and the number of unsold units in projects that have already been started.
Higher number of real estate bankruptcies
Owing to weaker economic developments since the beginning of 2023, the share of corporate bankruptcies has risen. Bankruptcies have risen more in the real estate sector than in other sectors (Chart 3.4), reflecting the greater impact on the real estate sector of higher interest expenses and low construction activity. Higher bankruptcy rates in other sectors may also reflect a normalisation following a period of unusually low bankruptcy rates during the pandemic.
Share of firms that have gone bankrupt over the past 12 months. Percent
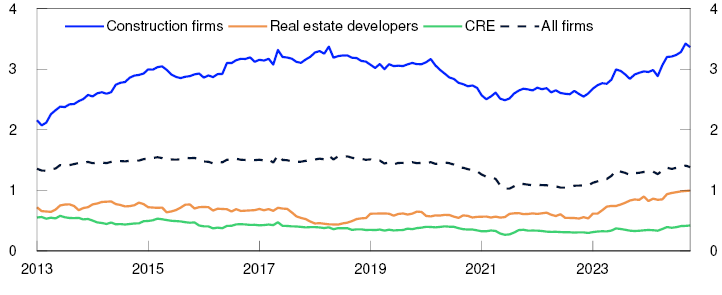
In CRE and real estate development, normally only a few firms go bankrupt, although post-pandemic bankruptcy rates in these sectors are up. Since the pandemic, real estate development has been the sector with the highest relative increase in bankruptcy rates, at over 50%. It is also the sector with the weakest economic developments in 2023. Higher bankruptcy rates are more common in construction, where firms typically have small profit margins and low capitalisation. This makes them less resilient to temporary declines in demand, as witnessed in recent years.
Most of the firms that have gone bankrupt over the past year are relatively small, with an average of just under five employees and NOK 1m in bank debt (Chart 3.5). Debt held by firms that go bankrupt has increased somewhat in recent years but is at broadly the same level as the average for the past ten years and still below the average for all firms. In the real estate sector, however, the increase in debt held by bankrupt firms is substantial. While the average debt of bankrupt real estate developers and CRE firms is more than twice as high as before the pandemic, the average number of employees remains broadly the same.
Number of firms that have gone bankrupt over the past 12 months and average bank debt and employees in firms that have gone bankrupt
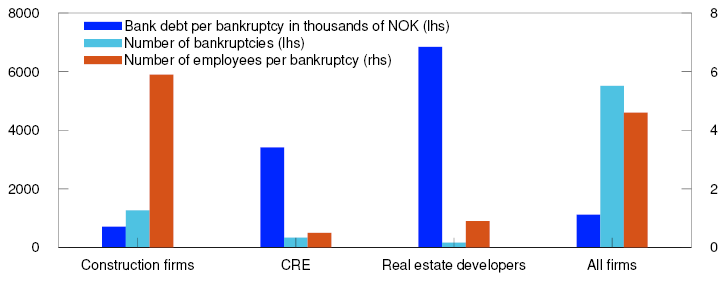
Developments in debt collection cases indicate a somewhat higher bankruptcy rate ahead
The share of firms facing debt collection7 has risen considerably in recent years (Chart 3.6). As a last resort, debt collection cases can end in bankruptcy, and developments in bankruptcy rates moved broadly in pace with debt collection cases up until 2018. Since then, the number of firms facing debt collection has risen considerably faster than bankruptcy rates. There may be various reasons for this change. The scope of debt collection statistics may have broadened, and in addition the Norwegian Tax Administration reduced its bankruptcy petitions substantially during the pandemic. Over the past two years, both debt collection cases and bankruptcies have picked up again, rising at broadly the same rate.
Share of firms that have gone bankrupt over the past 12 months and share of firms with outstanding debt collection cases (Twelve-month moving average). Index. Jan. 2013 = 1
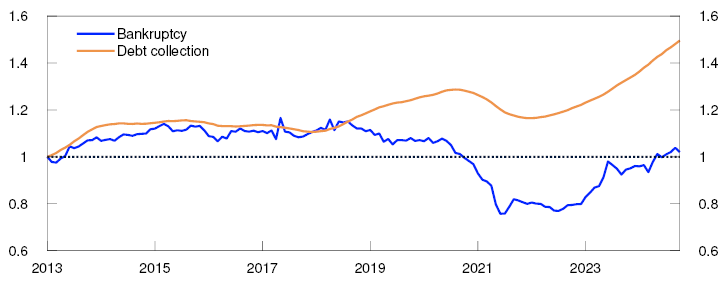
A new analysis from Norges Bank examines the relationship between debt collection cases and bankruptcies, and particularly whether developments in debt collection cases can indicate bankruptcy risk. The results confirm that there is a clear correlation between developments in debt collection cases and bankruptcies over time.9 Over 85% of firms that have gone bankrupt were found to have had at least one debt collection case. Among the firms that had at least one outstanding debt collection case at the end of a given month, 14% went bankrupt within a year in the period between 2013 and 2018. This share declined after 2018 and during the pandemic but appears to have stabilised around 10% in recent years. The share of firms that went bankrupt within three years following their first debt collection case was 26% in the period between 2013 and 2018.
In the analysis, a wide difference is found between the number of debt collection cases among the firms that go bankrupt and among the firms that do not. For firms that go bankrupt one, two or three years after their first debt collection case, the number of outstanding debt collection cases during this period increases substantially compared with the firms that do not go bankrupt (Chart 3.7).
Average number of outstanding debt collection cases per firm declared bankrupt within 1, 2 and 3 years of the first debt collection case and per firm that did not go bankrupt

Firms with a high risk of bankruptcy are defined here as those with at least four outstanding debt collection cases.11 These firms account for almost 30% of all firms facing debt collection and have an average of 25 employees. By comparison, firms with lower bankruptcy risk have an average of 15 employees.
In order to project bankruptcy developments ahead, a closer examination is carried out of whether the rise in the share of debt collection cases in recent years is driven by firms with high or relatively low bankruptcy risk. If the rise had primarily been driven by firms with relatively low bankruptcy risk, it would have been reasonable to assume that the resulting rise in the bankruptcy rate would not have been as high. However, the analysis finds that the share of firms with a high risk of bankruptcy has increased just as much as the share of those with a lower risk since December 2019, and particularly in the recent period (Chart 3.8). These developments in debt collection therefore suggest a somewhat higher bankruptcy rate ahead. A simple prediction model indicates a rise in the bankruptcy rate from 1.4% to 1.5% over the coming year.12
Share of firms with outstanding debt collection cases. Twelve-month moving average. Index. Dec 2019 = 1
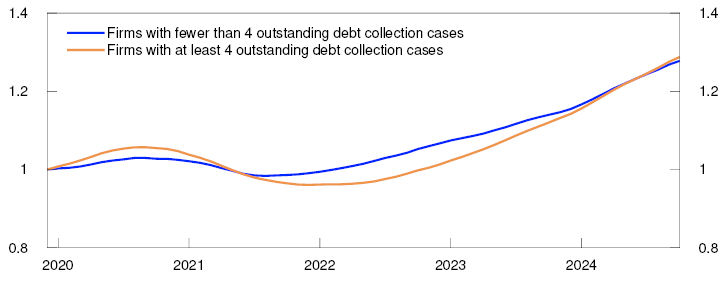
1 The financial statement analysis covers Norwegian non-financial limited companies that have submitted annual financial statements for the applicable year. Firms in oil and gas extraction, and power companies are omitted from the analysis owing to substantial earnings volatility that has a disproportionately large impact on overall developments. Bank exposure to such firms is relatively small.
2 Period: 1999 – 2023.
Equity ratio is book equity as a percentage of total assets (equity and debt).
3 Period: 2019–2023.
Operating margins before interest expenses are earnings (EBITDA) as a share of turnover.
Operating margins after interest expenses are earnings (EBITDA), less interest expenses, as a share of turnover.
Interest expenses are shown by shaded areas in the chart.
Period: 2019–2023.
Current liabilities refers to debt and liabilities with a maturity of less than one year.
5 Period: January 2013 – October 2024.
The share of companies that have gone bankrupt over the past 12 months is the sum of bankruptcies over the past 12 months as a share of the total number of firms in the sector over the past 12 months.
6 Period: October 2023 - October 2024.
Number of firms that have gone bankrupt over the past 12 months is the sum of bankruptcies over the past 12 months.
Bank debt per bankruptcy is the sum of bankrupt firms’ bank debt over the past 12 months as a share of the number of firms that have gone bankrupt over the past 12 months.
Employees per bankruptcy is the sum of number of employees in firms one year before bankruptcy, as a share of the number of firms that have gone bankrupt over the past 12 months. If the firm did not exist one year before bankruptcy, the number of employees from the same year as the bankruptcy occured is used.
7 Debt collection cases where the claim has remained outstanding long enough for a payment remark to be formally registered with the credit reporting agencies.
8 Period: January 2013 – October 2024.
Share of firms that have gone bankrupt over the past 12 months is the sum of bankruptcies over the past 12 months as a share of total firms in the sector over the past 12 months. Share of firms with debt collection cases outstanding is a twelve-month moving average of firms with at least one new debt collection case per month as a share of total firms in the sector.
9 See Hjelseth, I.N. and K. Liaudinskas (2024) “Record Increase in Payment Remarks: A Red Flag for Norwegian Firms?”. Staff Memo 9/2024. Norges Bank
10 Period: January 2013 - October 2024.
Average number of outstanding debt collection cases per firm declared bankrupt within 1, 2 and 3 years after the first debt collection case, and firms that did not go bankrupt after the first debt collection case. For each of the four groups, the lines represent the average number of debt collection cases outstanding (vertical scale) among the firms by month-end after the first debt collection case (horizontal scale). For example, firms that went bankrupt within 2 years of the first debt collection case had, on average, 6 outstanding debt collection cases by the end of year 1.
11 Following the pandemic, 22% of such firms went bankrupt within one year. In the period between 2013 and 2024, this criterion reflects 60% of bankruptcies among firms facing debt collection.
12 The prediction is based on the number of firms with outstanding debt collection cases, the share of firms that have gone bankrupt after at least one debt collection case in the past year and the share of firms that have gone bankrupt without having received any debt collection cases in the past year. See further discussion in Hjelseth, I.N. and K. Liaudinskas (2024) “Record Increase in Payment Remarks: A Red Flag for Norwegian Firms?”. Staff Memo 9/2024. Norges Bank.
13 Period: December 2019 – October 2024.
Share of firms with outstanding debt collection cases is a twelve-month moving average of the number of firms with at least one new debt collection case per month as a share of the number of firms in the sector.
3.2 Somewhat improved prospects in the CRE sector
Commercial property prices have levelled off and financing costs have fallen
Owing to higher interest rates, commercial property prices have fallen over the past two years (Chart 3.9), and so far in 2024, selling prices have levelled off. Selling prices depend on rental prices and the yield.14 The rise in interest rates has led to markedly higher yields and lower selling prices, while a sharp rise in rents has curbed the fall in prices. Long-term interest rates have fallen slightly since Financial Stability Report 2024 H1 was published in May, and credit premiums have fallen. The yield is therefore not expected to increase as much as previously projected. However, the yield has risen less than long-term interest rates over the past two years and is therefore expected to rise somewhat ahead. Employment is expected to remain high (see Monetary Policy Report 3/2024), which drives up demand for office space and underpins expected growth in rents to the end of the projection period.
Prime office space in Oslo. Estimated selling prices. In thousands of NOK per square metre
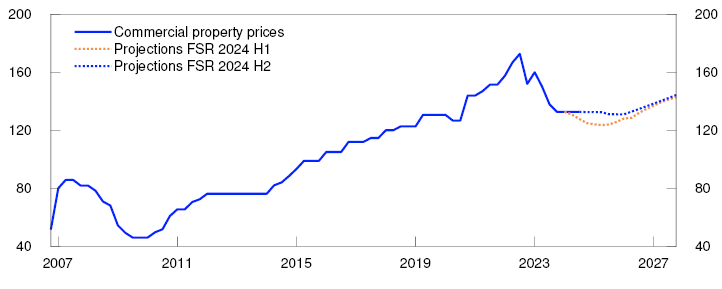
The projections for the yield and rent inflation imply that commercial property selling prices will remain fairly flat in the year ahead before rising moderately for the rest of the projection period. This is an upward revision from the Report in May, when a more pronounced decline in selling prices was expected.
In recent years, CRE firms’ financing costs have increased as a result of higher interest rates and higher credit premiums. Most of these firms’ debt is bank debt, but over time bond debt has become a more important source of financing. Credit premiums rose sharply in 2022 and 2023, both in the bond market and on bank lending (Chart 3.10, left panel). Higher financing costs and lower equity ratios due to lower property values have posed challenges to CRE firms that have had to refinance their debt, particularly in the bond market, where much of the debt has matured over the past few years (Chart 3.10, right panel). So far in 2024, however, credit premiums on bond financing have fallen considerably. Margins on banks’ CRE lending have also narrowed somewhat, which has contributed to lower financing costs for new loans. In Norges Bank’s lending survey for 2024 Q3, all banks report somewhat increased use of interest rate hedging among CRE firms, which in isolation reduces uncertainty regarding the firms’ financing costs.
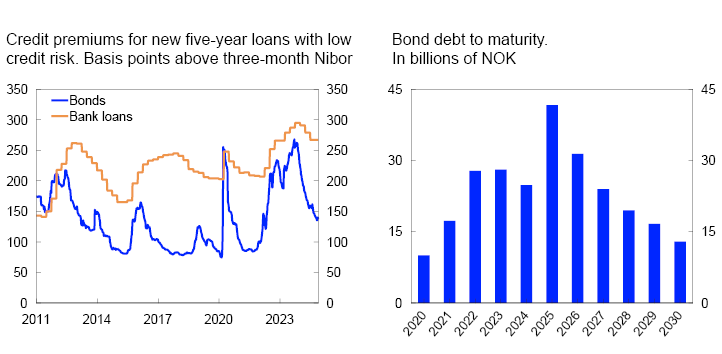
With selling prices levelling off and lower financing costs, CRE sector prospects have improved somewhat since a year ago. However, there is still uncertainty about future developments.
High interest rates have weakened the profitability and equity ratios of CRE firms
Higher financing costs have weakened the profitability and equity ratios of CRE firms. The interest coverage ratio (ICR), a measure of a firm’s current earnings (EBITDA) relative to interest expenses, has fallen in recent years (Chart 3.11). In 2023, the ICR fell broadly as projected in Financial Stability Report 2023 H2. Firms’ overall ICR continued to remain well above 1, which is when earnings cover interest expenses exactly and also above the minimum requirement of 1.8, which is widely used by lenders.17 In the 2023 H2 Report, the ICR was expected to fall below 1.8 in 2024. Owing to the combined effect of lower credit premiums and higher rental income, the ICR is now expected to fall to 2.1 in 2024 and remain there in 2025 (see blue line in Chart 3.11).
Interest coverage ratio (ICR)
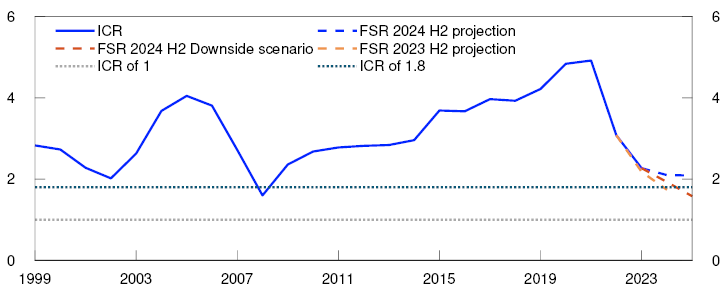
The projections assume that CRE firms’ interest expenses will increase by 15% in 2024 and 4% in 2025. Since some of the firms’ debts are at fixed rates, higher interest expenses are gradually phased into their cash flows. Lower credit premiums normally only affect cash flows once debt is refinanced. A rise in rental income is also assumed owing to high employment, the adjustment of existing leases according to the CPI and the fact that new leases will likely be entered into at higher rents than expiring leases in response to the rapid rise in rents in recent years.
In a downside scenario where the average interest rate rises more than projected, credit premiums increase and rental income developments are markedly weaker than expected, the overall CRE sector ICR is likely to fall below 1.8 (Chart 3.11).
Estimates based on consolidated financial statements19 show that the vast majority of CRE groups were able to cover interest expenses out of current earnings in 2023 (Chart 3.12). Approximately 40 of 400 CRE groups had ICRs below 1, compared with 35 groups in 2022. The chart also shows that the debt levels of CRE groups with ICRs below 1 did not increase significantly through 2023. In 2023, 9% of debt was held by such groups, compared with 7% in 2022.20 Some groups have reduced their debt by selling properties, which may reflect the unchanged number of groups with ICRs below 1. In Norges Bank’s lending survey for 2024 Q3, half of the banks report somewhat increased CRE sales motivated by borrowers improving their financial position or by avoiding default.
Share of debt in CRE firms within interest coverage ratio thresholds. Percent
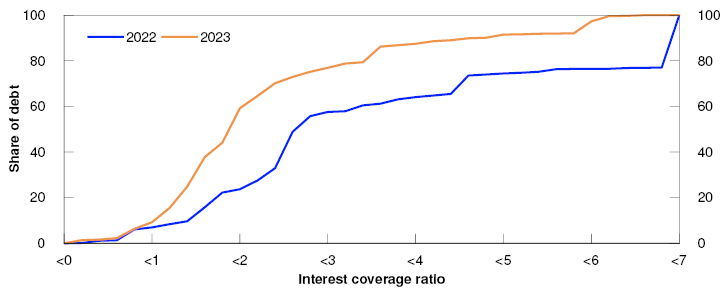
Even though the increase in the share of debt in CRE groups with ICRs below 1 has not been significant, the share of debt in groups with ICRs below 1.8 almost doubled in the period between 2022 and 2023 (Chart 3.12). This largely pertains to the groups that originally had high ICRs in 2022, which reduced their ICRs in 2023, but there has also been a substantial reduction for the groups with ICRs between 2 and 3.
Since the financial crisis, CRE firms’ equity ratios have strengthened, partly reflecting the fact that the rise in CRE prices has not been matched by a corresponding rise in lending. However, interest rate increases in recent years have weighed down on CRE firms’ equity ratios (Chart 3.13).
Share of debt in CRE within interest equity ratio thresholds. Percent
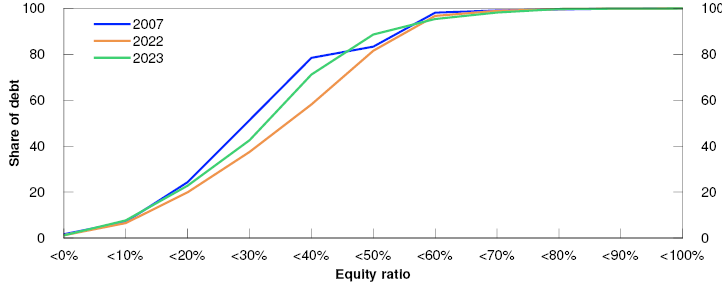
In line with the fall in market commercial property prices, CRE firms have had to write down their property values. The write-downs often depend on the accounting standards used by the firms. In 2023, over 20% of the debt was held by CRE groups with book equity ratios below 20%. This share was little changed from 2022 partly because the properties of many firms with low equity ratios are carried at historical cost, which can often be lower than fair value. Book equity ratios fell more in 2023 for firms that initially had higher ratios in 2022. This was likely driven by firms that hold their investments at fair value and therefore often see increased write-downs on property values when market prices fall.
14 The yield is based on property sale information and depends on developments in long-term interest rates and risk premiums.
15 Period: 2006 Q4 – 2027 Q4.
Projections from 2024 Q2 for FSR 2024 H1 and from 2024 Q4 for FSR 2024 H2.
16 Left panel:
Period:
Bank loans: 2011 Q1 – 2024 Q3.
Bonds: Week 1 2011 – week 47 2024.
Bank loans is the margin for new five year bank loans to purchase office space in central Oslo at an LTV ratio of 65 percent and a lease contract average of seven years.
Right panel:
Period: 2020 - 2030.
Data as of September 2024.
17 For firms that rely on bond financing, some credit rating agencies require an ICR above 1.8 to qualify for an investment-grade credit rating. If the ICR falls below this threshold, the bonds may be downgraded, with a marked rise in yields on new and existing bonds.
18 Period: 1999–2025.
Projections from 2023 for FSR 2023 H2 and from 2024 for FSR 2024 H2.
ICR is total earnings as a share of the total interest expenses of legal entities in CRE.
The projections in FSR 2024 H2 assume that average interest rates rise by 0.6 percentage units in 2024 and fall by 0.03 percentage units in 2025. In these projections, credit premiums remain at the current level in 2024 and 2025. Operating income is further assumed to increase by 4.7 percent in 2024 and 3.1 percent in 2025, while operating expenses increase by 3.2 percent in both 2024 and 2025. Interest-bearing debt is also assumed to rise by 3.5 percent in 2024 and 4.6 percent in 2025.
In the downside scenario, average interest rates are assumed to increase by 0.8 percentage units in 2024 and 0.6 percentage units in 2025. In these projections, credit premiums increase by 0.25 percentage units in 2024, where they remain in 2025. It is further assumed that operating income rises by 2.9 percent in 2024 and falls by 1.3 percent in 2025, while operating costs increase by 3.2 percent in both 2024 and 2025. Interest-bearing debt is also assumed to increase by 3.5 percent in 2024 and 4.6 percent in 2025.
19 Consolidated financial statements provide a broader picture of the financial situation than those at the firm level and are therefore better suited for micro-level analyses.
20 Some of the firms with ICRs below 1 in 2022 have not submitted their annual accounts for 2023 and are thus no longer included in the underlying data.
21 Period: 2022 - 2023.
ICR is total earnings as a share of total interest expenses for CRE groups with an interest-bearing debt of more than NOK 50m.
22 Period: 2007, 2022, 2023.
Equity ratio is total book equity as a share of total assets for CRE groups.
3.3 Challenges persist in real estate development
High interest expenses and a low level of construction activity are weakening the profits and equity ratios of real estate developers
High construction costs and higher interest rates have weakened the profitability of many residential and commercial construction projects. Construction costs are still high, even though the pace of the rise has slowed since 2022 (Chart 3.14, left panel). In recent years, the prices of new homes have risen more than the prices of existing homes. This has dampened new home sales and resulted in a substantial decline in residential construction. Housing investment fell more than projected in 2023 (see Chart 3.14, right panel and Monetary Policy Report 3/2024). Even though new home sales have picked up slightly in the recent period, turnover is still low.
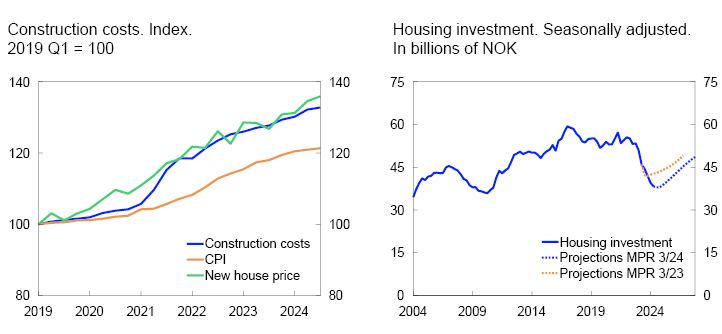
Lower construction activity means lower income for both real estate developers and building contractors, but real estate developers are particularly vulnerable as the sector also has substantial debt and is therefore more sensitive to higher interest rates. In Norges Bank’s lending survey for 2024 Q3, most banks report a slightly higher risk that real estate developers will breach the terms of loan covenants relating to debt-servicing capacity.
In 2023, real estate developers’ interest expenses increased substantially, while earnings fell. This resulted in a marked decline in the ICR for the sector (Chart 3.15). The ICR is expected to decline further in 2024, to 0.7, ie that overall interest expenses will exceed the earnings of real estate developers. The ICR is falling more than projected in Financial Stability Report 2023 H2, reflecting weaker-than-expected construction activity. When earnings become insufficient to cover interest expenses, firms must draw on their financial buffers. Many firms are likely to have sufficient liquidity to face a period of losses. It may be necessary for firms without sufficient available liquidity to sell land and property development projects or raise more capital.
Interest coverage ratio (ICR)

In the Bank’s projections, it is assumed that real estate developer income moves in line with housing investment and that interest rate developments follow the path projected in Monetary Policy Report 3/2024. This generates a slight increase in the ICR in 2025. The projections largely depend on construction activity. If construction activity does not pick up as expected, the ICRs of real estate developers will decline more than currently envisaged (Chart 3.15). The overall ICR for the real estate development sector may then fall to 0.5% in 2025, which means that interest expenses will be twice as large as earnings.
In 2023, the equity ratios of real estate developers weakened (Chart 3.16). The share of debt held by groups with both moderate equity ratios (between 20% and 30%) and weak ratios (below 20%) increased. Among the groups with ICRs below 1, more of the debt was held by groups with weak ratios in 2023, and approximately 9% of the debt was held by groups with negative ratios. So far in 2024, interest expenses and construction activity indicate a further weakening of real estate developers’ equity ratios. These developments are unlikely to continue if construction activity picks up as expected in 2025 and the policy rate is reduced further out.
Share of debt in real estate development within equity ratio thresholds. Percent
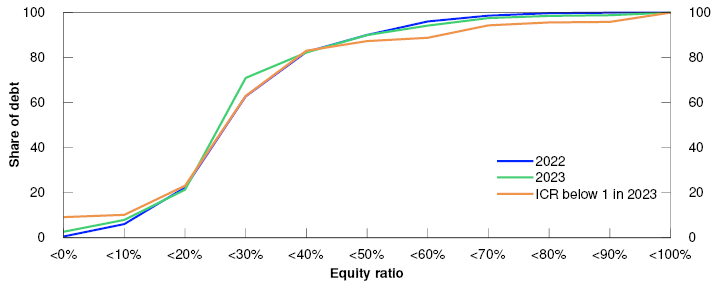
23 Left panel:
Period: 2019 Q1 - 2024 Q3.
Construction costs is the construction cost index from Statistics Norway. CPI is the consumer price index from Statistcs Norway. New house price is the price index for new houses from Statistics Norway.
Right panel:
Period: 2004 Q1 - 2027 Q4.
Projections from 2023 Q3 for MPR 3/23 and from 2024 Q3 for MPR 3/24.
24 Period: 1999 – 2025.
Projections from 2023 for FSR 2023 H2 and from 2024 for FSR 2024 H2.
ICR is total earnings as a share of total interest expenses for legal entities in real estate development.
The projections for FSR 2024 H2 assume that the average interest rate will rise by 1 percentage point in 2024 and fall by 0.4 percentage points in 2025. Furthermore, the assumption is that operating income will fall by 16 percent in 2024 and increase by 4 percent in 2025 and that operating expenses will change by 90 percent of the income change in percent in 2024 and 2025. Interest-bearing debt in 2024 and 2025 is assumed to remain at the same level as in 2023.
The downside scenario assumes the same interest rate rise, but that operating income will fall by 20 percent in 2024 and 10 percent in 2025 and that operating expenses will change by 90 percent of the income change in percent in 2024 and 2025. Interest-bearing debt in 2024 and 2025 is assumed to remain at the same level as in 2023.
25 Period: 2022 - 2023.
Equity ratio is total book equity as a share of total assets for groups with at least 30 percent of total loans linked to real estate development.
3.4 Higher default rates in real estate
So far in 2024, banks’ overall corporate credit losses have risen (Chart 3.17). This is because there have been no net oil-related impairment reversals, which have pushed down losses over the past two years, since they were not as high as banks expected in 2020. Overall, credit losses in other sectors have not risen.
Recognised credit losses as a share of lending to the sector. Percent
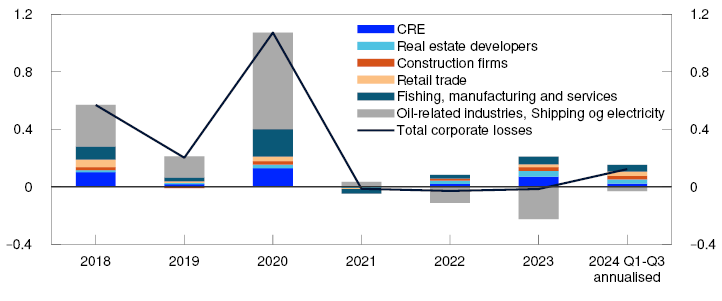
In 2023, defaults on real estate loans increased substantially, and in 2024, the share of defaulted loans has risen further in CRE and among real estate developers (Chart 3.18). In real estate development in particular, defaulted loans have risen sharply. The level is now at its highest since 2009, when figures for this sector were first recorded.
Defaulted loans as a share of lending to the sector. Percent
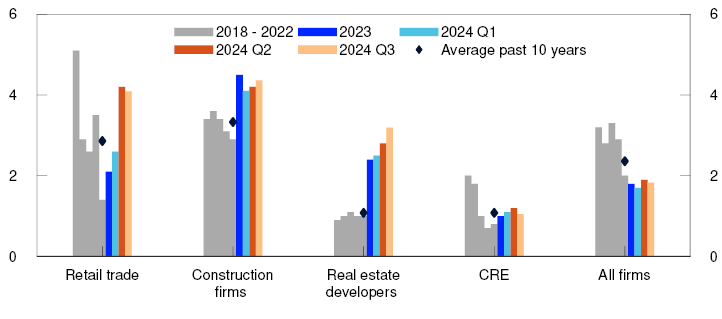
Somewhat higher corporate default rates and credit losses are expected ahead owing to weak economic growth, continued high interest expenses and a low level of construction activity.28 These loss projections are underpinned by Norges Bank’s new analysis of default and bankruptcy risk (see "New microdata on corporate loan defaults improve the estimates of banks’ credit losses"). Bank loans for real estate development and construction currently appear more vulnerable than CRE loans. If the decline in real estate developers’ earnings proves more pronounced than expected and equity in the sector continues to fall markedly, banks’ losses in this sector may be more pronounced than currently envisaged. Nevertheless, the sector only accounts for 9% of banks’ corporate exposures, which limits the extent of these potential losses relative to total corporate exposure.
As discussed in Section 3.2, CRE sector prospects have improved somewhat but developments ahead remain uncertain. Commercial property prices may prove to fall more than currently envisaged. If long-term interest rates or risk premiums were to rise markedly and rental income to prove appreciably weaker than expected, profitability and property values would then weaken. Lower equity ratios and weaker profitability may make rolling over maturing loans more demanding and trigger fire sales of properties. This could in turn amplify a fall in property prices if many such sales occur at the same time. If writing down property values results in negative equity in banks’ collateral and CRE firms’ debt is defaulted on, banks may incur losses. Experiences of banking crises in Norway and abroad have shown that losses on CRE exposures have been an important factor behind solvency problems in the banking sector.
26 Period: 2018 - 2024 H1.
Annual figures for 2018 – 2023. 2024 Q1-Q3 is the sum of 2024 Q1-Q3 with a projection for Q4 based on the average for 2024 Q1-Q3.
Recognoised credit losses for Norwegian corporate exposures as a share of total lending to the sector.
27 Period: 2014 – 2024 Q3.
Loan defaults are the holdings of defaulted loans after 90 days and other defaults, for Norwegian corporate exposures, as a share of total lending to the sector.
28 A more detailed assessment of bank losses will be made in Financial Stability Report 2025 H1, where the focus will be on banks.
New microdata on corporate loan defaults improve the estimates of banks’ credit losses
Norges Bank’s assessment of credit risk related to banks’ corporate lending uses models1 to estimate bankruptcy probability among Norwegian firms. The models indicate a higher risk of bankruptcy in 2024 and 2025 (Chart 3.A). However, banks’ credit losses are not only limited to firms that go bankrupt. Significant losses may also arise if firms that do not go bankrupt default on loans.2 Loan defaults are thus more directly linked to credit losses than bankruptcy rates and are therefore likely a better indicator of banks’ losses. Microdata on both loan defaults and credit losses have long been limited. In a new analysis from Norges Bank, new microdata on default is used to estimate the probability of default (PD) for firms that do not go bankrupt, and Norges Bank uses these insights to improve its corporate loan loss estimates.3
Bankruptcy debt and estimated debt-weighted bankruptcy probabilities. Seven sectors in total. Percent
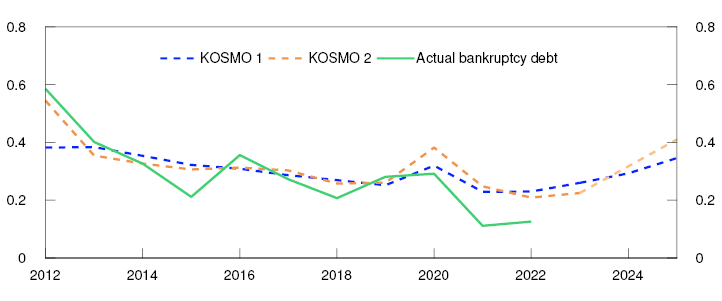
A simple model for PD is estimated based on existing bankruptcy probability estimates and is compared with a widely used rule of thumb stating that the default rate is approximately twice the bankruptcy rate.5 The data indicate that the relationship between bankruptcies and defaults varies across sectors and over time. Seven sectoral models are therefore estimated with a time dummy.
The results show that the model is more similar to actual developments in new loan defaults than the rule of thumb, especially after the pandemic (Chart 3.B, left panel). When weighted by firms’ debt, the model estimates are somewhat higher than actual defaulted debt (Chart 3.B, right panel). However, the new model better captures the rise in defaulted debt in 2023, something the rule of thumb does not significantly capture. The model estimates indicate that new corporate loan defaults will increase somewhat in 2024 and 2025 (Chart 3.C).
Average PD (lhs) and debt-weighted PD (rhs). Seven sectors in total. Percent

New loan defaults as share of total loans. Percent
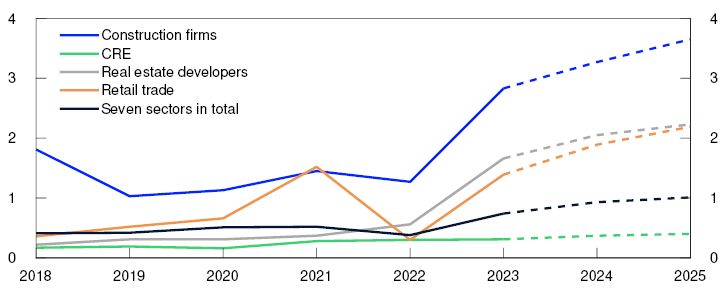
In the event of new defaults, banks set aside loan loss provisions (LLPs), often referred to as the provision rate at default or loss-given-default (LGD). To estimate the ratio of LLPs to new loan defaults, a provision rate is assumed, which is equal to the average provision rate at default for 2024 Q1 and Q2 for each sector.
In the estimates, new LLPs as a share of total corporate loans increase slightly in 2024 and 2025 compared with 2023 (Chart 3.D), and the increase is most pronounced in construction and real estate development.
New LLPs for loan defaults as share of total loans. Percent
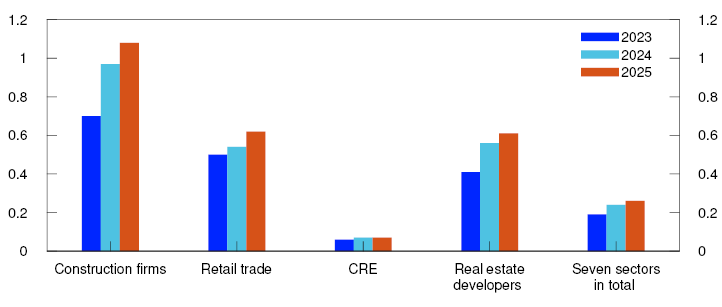
There is considerable uncertainty surrounding the estimates, and banks’ loss assessments are naturally more complex than accounted for in this model. Nonetheless, the model estimates are well in line with the firm-level analyses in this Report and Norges Bank’s overall assessment of banks’ risk of losses and they also provide an initial estimate of annual credit losses.
1 See Hjelseth, I. and A. Raknerud (2016) “A model of credit risk in the corporate sector based on bankruptcy prediction”. Staff Memo 20/2016. Norges Bank, for KOSMO 1 and Hjelseth, I., A. Raknerud and B.H. Vatne (2022) “A bankruptcy probability model for assessing credit risk on corporate loans with automated variable selection”. Working Paper 7/2022. Norges Bank, for KOSMO 2.
2 For a review of accounting rules for impairment recognition, see box on page 23 of Financial Stability Report 2024 H1.
3 For a complete documentation of the analysis see Hjelseth, I., K. Liaudinskas and S.K. Thuve (2024) “Nye mikrodata for misligholdte foretakslån gir bedre anslag for bankenes utlånstap" [New microdata on loan defaults provide better estimates of banks’ credit losses]. Staff Memo 10/2024. Norges Bank
4 Period: 2012–2025.
Since there is often a significant lag between firms’ most recently submitted financial statements and bankruptcy registration, the bankruptcy indicator is defined as occurring in year t if year t-1 is the most recently submitted financial statement and the firm has been declared bankrupt by the end of year t+1. Actual bankruptcy debt therefore only covers 2022 pending complete bankruptcy data for 2024.
The seven sectors are fishing and aquaculture, manufacturing, construction, retail trade, CRE, real estate development and services. Bankruptcy probabilities have not been estimated for the remaining sectors (oil-related industries, shipping, electricity, agriculture and forestry) and are therefore omitted from the analysis. The analysis covers approximately 80 percent of banks’ Norwegian corporate exposure.
5 The relationship is based on an estimation first documented in Bernhardsen, E. (2001) “A Model of Bankruptcy Prediction”. Working Paper 10/2001. Norges Bank. Examples of default risk analyses where this relationship is used include Bernhardsen, E. and K. Larsen (2007) “Modellering av kredittrisiko i foretakssektoren – videreutvikling av SEBRA-modellen”. [Credit risk modelling in the business sector - further development of the SEBRA model] Economic Bulletin /2007, pages 60–66 (in Norwegian only); H. Andersen and Hjelseth, I. (2019) “How does IFRS 9 affect banks’ impairment recognition in bad times?“ Staff Memo 9/2019. Norges Bank; I. Hjelseth, Johansen, R. M. and Solheim, H. (2024) “Firms’ transition to lower greenhouse gas emissions and the risk in Norwegian banks” Staff Memo 3/2024. Norges Bank.
6 Period: 2018–2023.
Nine large banks’ exposures to the seven sectors in the analysis. See description in Chart 3.A.
7 Period: 2018–2025.
Estimates for 2024 and 2025.
Nine large banks’ exposures to the seven sectors in the analysis. See description in Chart 3.A.
8 Period: 2023–2025.
2023 is an estimated variable. Estimates for 2024 and 2025.
Nine large banks’ exposures to the seven sectors in the analysis. See description in Chart 3.A.