Most households and firms have been able to service debt so far, but uncertainty persists
So far, most households and firms have been able to service their debt in the face of higher interest rates and high inflation. At the same time, there is considerable uncertainty about the economic outlook and future market developments, not least as geopolitical tensions persist. Many households are highly indebted, and they are vulnerable if an economic downturn were to occur.
Banks are solid
The Norwegian financial system is robust. High earnings, efficient operations and solid buffers ensure that banks are resilient. Norges Bank’s stress test shows that banks can still lend even if losses were to increase substantially owing to an economic downturn. Unchanged capital buffer requirements for banks contribute to maintaining resilience.
Banks can withstand large deposit withdrawals
Confidence in banks is fundamental to stable deposits. Norges Bank has conducted a stress test where confidence in banks was put to the test as a result of a cyberattack. The test shows that Norwegian banks can withstand large withdrawals of deposits by customers following such an incident. Sound contingency planning helps strengthen banks’ resilience.
Climate transition may inflict losses on banks
The Norwegian business sector must adapt to climate change and the use of new forms of energy. There is considerable uncertainty about the cost of such a transition, and some firms may see their earnings weaken. Banks have large exposures to some sectors that are particularly vulnerable to climate transition. If many firms are adversely affected, this may result in higher bank losses.
Financial stabilty assessment
The Monetary Policy and Financial Stability Committee considers that the financial stability outlook has not materially changed since the November 2023 Financial Stability Report. The Norwegian financial system is robust, but there is still uncertainty about the economic outlook and market developments. It is important to maintain the resilience of the financial system so that vulnerabilities do not amplify an economic downturn.
There is still an elevated risk that negative events could weaken financial stability
The rise in interest rates has curbed activity in the Norwegian economy, but employment is at a high level. Lower credit spreads and higher equity values since the November Report reflect the market expectation that a pronounced downturn will not adversely affect economic growth in Norway and abroad. At the same time, there is still an elevated risk that negative events could occur and weaken financial stability. Geopolitical tensions are still high. Risk premiums may increase abruptly, and there is uncertainty surrounding growth in activity, inflation and interest rate developments. Financial system vulnerabilities could amplify a downturn in the Norwegian economy and lead to bank losses.
So far, most households and firms have been able to service debt in the face of higher costs
High household indebtedness, which means households must spend more of their income on interest expenses when interest rates rise, is the key vulnerability in the financial system. So far, the vast majority of households have been able to service their debt in the face of higher interest rates and high inflation. This is in part due to the fact that they are employed and have accumulated ample savings over the past ten years.
A higher interest burden has increased the risk that more households will be unable to service debt. Many households have drawn on accumulated savings. In isolation, this suggests that households would be more vulnerable if, for example, unemployment were to rise sharply or if interest rates were to rise further. If consumption is then tightened to a substantial degree, corporate earnings and debt-servicing capacity may fall.
The share of Norwegian firms facing debt collection has increased further since the November Report. The increase is particularly pronounced in the real estate sector. The share of bankruptcies has recently risen somewhat but remains lower than before the pandemic.
A number of Commercial Real Estate (CRE) firms have been adversely affected by weaker earnings and lower equity ratios over the past two years. Some of the firms have drawn on financial buffers, raised more equity or sold off property to be able to continue operations. However, there are not clear signs that property sales driven by financial problems in individual firms have amplified the fall in commercial property prices. High employment and growth in rental income have enabled most CRE firms to cope with higher interest expenses so far. If rental income developments prove markedly weaker than expected, for example if employment falls sharply, many firms could face debt-servicing problems.
Climate change may inflict losses on banks
Climate change and the energy transition will lead to higher costs for many households and firms in the years ahead. Banks have large exposures to some sectors that are particularly vulnerable to climate transition, including shipping and oil extraction. In addition, higher energy efficiency standards are in the pipeline for the real estate sector, where banks also have large exposures. In the event of abrupt changes, higher business and household costs may entail higher losses for banks than would otherwise have been the case. At the same time, investment needs relating to climate transition may increase.
Cyberattacks can be a source of liquidity risk
Deposit funding is the foundation for bank activities. For deposits to be a stable source of funding, customers must have confidence that deposits are secure and accessible. Even though previous loss of confidence episodes were mainly caused by depositor fears of losing funds, solid banks can also experience a loss of confidence. Turbulent times and a high degree of digitalisation have made the financial system more vulnerable to events that may affect confidence, such as cyberattacks. As a result, bank deposits could be withdrawn so rapidly that banks would face liquidity problems.
The liquidity stress test in this Report indicates that Norwegian banks are equipped to withstand large deposit withdrawals. At the same time, it is difficult to foresee how a future deposit run might unfold. Banks must ensure that risk management is well adapted to dealing with the consequences of a cyberattack. In order to strengthen resilience against liquidity problems in general, banks should limit holdings of other banks’ securities in their liquidity portfolios. To promote diversification, the Financial Supervisory Authority of Norway (Finanstilsynet) recommends that banks should limit holdings of covered bonds backed by Norwegian real estate to a maximum of 50%. In the event of fire sales of bonds, this can cushion a price fall.
The capital buffer requirements should be maintained
Norwegian banks satisfy capital and liquidity requirements by an ample margin. Banks' losses are low and profitability is high. The capital buffer requirements reflect vulnerabilities in the Norwegian financial system. The countercyclical capital buffer of 2.5% and the systemic risk buffer of 4.5% mean that banks are well equipped to absorb higher losses. In the event of a severe downturn, buffer requirements can be reduced to mitigate the risk of banks tightening credit standards. The solvency stress test in this Report illustrates that banks can absorb large credit losses while still having the capacity to lend.
Ida Wolden Bache
Pål Longva
Øystein Børsum
Ingvild Almås
Steinar Holden
1. Risks, vulnerabilities and resilience
1.1 Risk of abrupt changes in market conditions
Financial markets in Norway and other countries are marked by uncertainty about the outlook for growth and inflation. Since the November 2023 Financial Stability Report, equity markets have risen, while credit premiums have fallen. However, higher inflation or weaker growth expectations may trigger abrupt changes.
Market participants expect that the period of frequent policy rate increases is over
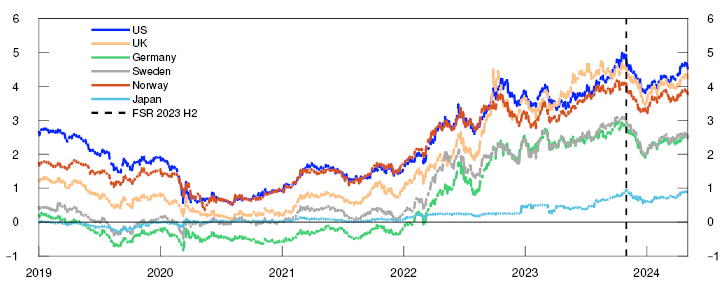
International interest rates fell markedly towards the end of 2023 but have returned to the high levels from November 2023 when Financial Stability Report H2 was published (Chart 1.1). Markets have priced in that the period of frequent policy rate increases is over and that policy rates will be gradually lowered. In the April 2024 Global Financial Stability Report (GFSR), the IMF affirms that the financial system has proved robust through the tightening cycle.1
10-year government bond yields. Percent
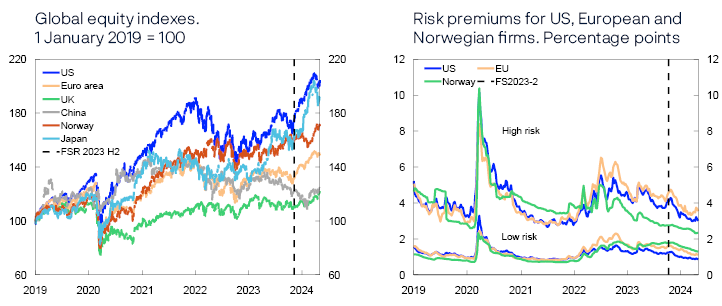
Leading equity market indexes have risen markedly since Financial Stability Report H2, and a number of markets have reached new peaks (Chart 1.2, left panel). Credit market risk premiums have fallen both in Norway and other countries (Chart 1.2, right panel).
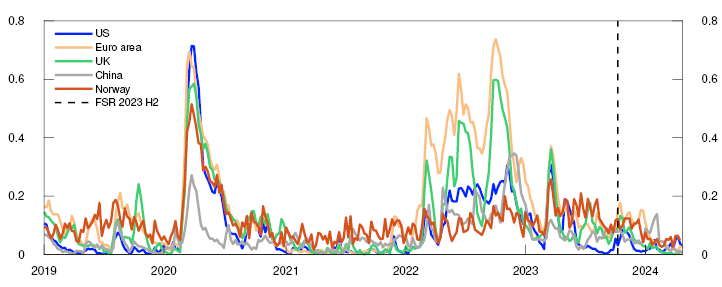
Financial market stress levels measured using the Composite Indicator of Systemic Stress (CISS)4 have continued to be relatively low both in Norway and other countries since Financial Stability Report H2 (Chart 1.3). When Russia invaded Ukraine in February 2022, the CISS rose markedly. The war in Gaza and other acts of war in the Middle East over the past six months have not had the same impact on the indicator.
CISS indicators. Selected countries
Individual banks abroad have incurred substantial losses on commercial real estate (CRE) loans
Commercial property prices in Europe and the US have fallen over the past year. The fall in prices is driven by higher interest rates and structural changes in demand, such as increased use of remote working.6 This winter, there has been some turbulence abroad surrounding some banks’ real estate exposure, which in turn has led to weak equity price developments for these banks (Chart 1.4) as they have incurred substantial losses on commercial and office property exposures, particularly in the US.7 Market stress has been related to individual banks and has not spread to other parts of financial markets.

Uncertainty surrounding developments in risk premiums
In the April GFSR, the IMF affirms that growing strains in the CRE sector and signs of credit deterioration among corporates and in some residential housing markets could be exacerbated by adverse shocks. If risk premiums increase, this could spread to the Norwegian economy. Credit ratings of firms could also worsen in Norway if economic growth prospects were to weaken.
Norges Bank’s systemic risk survey conducted in April shows that Norwegian financial market participants consider international geopolitical tensions, a fall in property prices and cyberattacks to be the main sources of risk to the Norwegian financial system (Chart 1.5).
Norges Bank’s systemic risk survey from April 2024. Which source of risk do you consider most likely?

Source: Norges Bank
1 See IMF (2024) “Global Financial Stability Report – April 2024”.
4 The composite indicator of systemic stress (CISS) measures the overall stress level (measured by volatility) in the financial system, ie the money, bond, equity, financial and foreign exchange markets. In constructing the indicator, consideration is given to the greater challenge to the financial system posed by simultaneous stresses in these market segments than periods without such correlation. The CISS has proved to be an accurate indicator of a systemic banking crisis in real time or in the near future. See Hagen M. and P.M. Pettersen (2019) “An improved composite indicator of systemic stress (CISS) for Norway”. Staff Memo 3/2019. Norges Bank.
6 See IMF (2024) “Global Financial Stability Report – April 2024”.
9 Based on Norges Bank’s systemic risk survey conducted in April. Responses are from a sample of participants in the Norwegian financial system and reflect risk assessments made at the time of the survey. The chart shows the most likely risk reported by the respondents in the Norwegian financial system.
2 Period: 1 January 2019 – 3 May 2024.
3 Left panel:
Period: 1 January 2019 – 3 May 2024.Right panel:
Period: Week 1 2019 – week 18 2024.Five-year credit premiums for non-financial corporates with low and high expected credit risk, respectively. Premiums for USD and EUR are over five-year government securities. Norwegian premiums are over three-month Nibor.
5 Period: Week 1 2019 – week 17 2024. Data for Norway up to week 16.
The indicator is based on volatility in money, bond, equity, banking, FX and commodity markets. There are some differences in how the CISS is calculated for the different countries.
7 See Deghi, A., F. Natalucci and M.S. Qureshi (2024) “US Commercial Real Estate Remains a Risk Despite Investor Hopes for Soft Landing”. IMF Blog, 18 January 2024.
8 Period: 2 January 2023 – 3 May 2024.
The KBW Regional Banking Index is a modified capitalisation-weighted index of 50 regional US banks, designed by Keefe, Bruyette and Woods.
1.2 Most households and firms have coped with higher expenses so far
So far, most Norwegian households and firms have coped with higher expenses resulting from higher interest rates and high inflation. This partly reflects the continued high employment rate. At the same time, the economic outlook is uncertain. Financial system vulnerabilities persist and may amplify a downturn.
High indebtedness makes households vulnerable
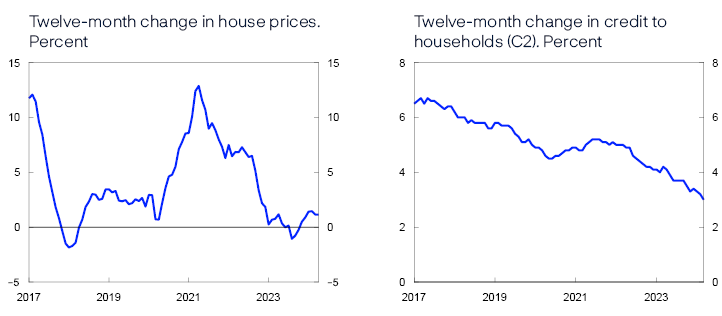
The key vulnerability in the Norwegian financial system is the high level of household debt. Household debt is unevenly distributed, and debt-to-income ratios are particularly high among younger age groups, which account for many first-time home buyers. House prices and debt rose rapidly over many years but have decelerated in recent years. So far in 2024, house price inflation has increased again, while credit growth has slowed further (Chart 1.6). Low credit growth reflects lower credit demand owing to higher interest rates and low new home sales. If the slow pace of debt growth and property price inflation continues, financial system vulnerabilities may eventually diminish.
Owing to high debt levels, households need to spend a larger share of their income on interest payments when interest rates rise (Chart 1.7). The vast majority of households have been able to service their debt in the face of higher interest rates and high inflation. This is partly because many households are employed and have accumulated savings over the past ten years that have given them a solid foundation. Financial Stability Report 2023 H2 points out that households have drawn on accumulated savings to meet higher costs. Preliminary tax return data indicate that fewer housholds reduced their bank deposits substantially in 2023.
Percent
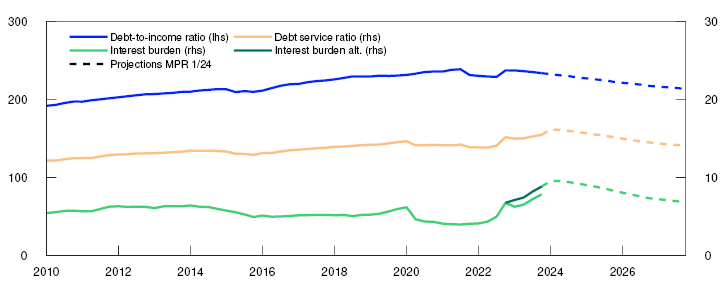
A higher interest burden has increased the risk that more households will be unable to service debt. In isolation, the fact that households have drawn on accumulated savings suggests that households would be more vulnerable if unemployment were to rise sharply or if interest rates were to rise further. If consumption is then tightened to a substantial degree, corporate earnings and debt-servicing capacity may fall.12 This may inflict losses on banks and amplify an economic downturn through tighter credit standards. (see also the solvency stress test in Section 2).
Higher interest rates lead to declining CRE selling prices
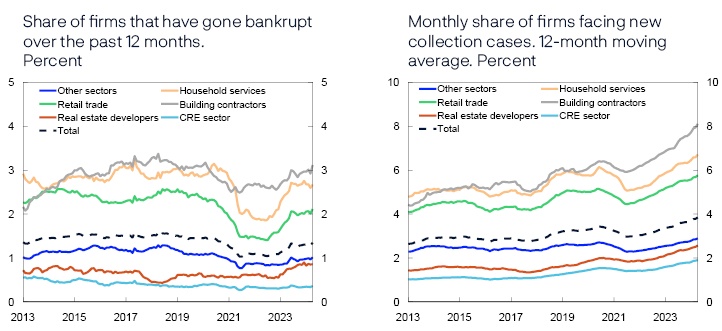
The share of Norwegian firms facing debt collection cases has increased further since Financial Stability Report 2023 H2. The increase is particularly pronounced in the real estate sector. The share of bankruptcies has recently risen somewhat, but remains lower than before the pandemic. (Chart 1.8).
Sources: Brønnøysund Register Centre, Dun & Bradstreet and Norges Bank
Banks’ exposure to CRE firms is particularly high. Overall, CRE firms’ debt-to-earnings ratios are high, and these firms are therefore vulnerable to higher interest expenses. The rise in interest rates in recent years has led to a marked increase in financing costs. Credit premiums on CRE firms’ bond financing have also increased markedly in recent years, but the premiums have fallen since November. High employment is helping sustain demand for office space and is boosting CRE firms’ rental income. Rent inflation adjustment under existing leases is also pushing up CRE firms’ rental income. Strong developments in the rental market increase CRE firms’ resilience to higher interest expenses.
Commercial property selling prices have fallen somewhat over the past two years (Chart 1.9). Selling prices are calculated as rental prices divided by an estimated yield. The yield is based on property sale information and depends on developments in long-term interest rates and risk premiums. The rise in interest rates over the past two years has resulted in markedly higher yields and a fall in selling prices, while a sharp rise in rents has cushioned the fall in prices.
Prime office space in Oslo. Estimated selling prices. In thousands of NOK per square metre

In recent years, however, the yield has risen less than indicated by the rise in long-term interest rates in recent years, which means that the spread between the yield and the five-year swap rate, which is a simple measure of the risk premium, is now at a low level. The yield is expected to increase somewhat. In line with high employment and moderate economic activity in the years ahead, a moderate rise in rent is expected towards the end of the projection period. Overall, the projections for the yield and rent inflation imply that commercial property selling prices will fall somewhat further before rising moderately to the end of the projection period.
Weaker earnings and lower equity ratios have had an impact on a number of CRE firms over the past two years. Some firms have drawn on financial buffers, raised more equity or sold off property in order to continue oper ating. However, there are not clear signs that property sales driven by financial problems in individual firms have amplified the fall in commercial property prices.
A number of factors may result in a steeper price fall than projected. If CRE rental income developments are markedly weaker than expected, for example if employment falls markedly, profitability and property values will then weaken. Lower equity ratios and weaker profitability will make rolling over maturing loans more demanding. This may trigger fire sales of properties, which could amplify a fall in property prices if many such sales occur at the same time. If reducing the carrying amount of property values results in negative equity in banks’ collateral, banks may incur losses if CRE firms’ debt is defaulted on. Experiences of banking crises in Norway and abroad have shown that losses on CRE exposures have been an important factor behind solvency problems in the banking sector.
Climate transition may result in higher costs for firms and homeowners
Climate transition has been ongoing for some time, but there is reason to believe that in the years ahead, the pace of both climate change and the energy transition will increase. This will lead to higher costs for many households and firms. Increases are expected in costs related to emission taxes, energy efficiency improvements and expenses related to damage resulting from changes in weather and climate. Higher costs will weaken firms’ profitability and may inflict losses on banks and weaken their lending capacity. At the same time, investment needs relating to climate transition may increase.
In Section 2, the analysis of how climate transition can impact Norwgian bank balance sheets indicates that banks can handle an orderly transition, where policies are incrementally adapted to the goals of the Paris Agreement. Nevertheless, banks have substantial exposures to certain industries that will have to undergo extensive restructuring in the years ahead. Uncertainty about implementation and the distribution of climate change costs may lead to short-term price volatility, even though most progress will not be made until somewhat further out.
In addition, stricter transition requirements in the commercial real estate market will be introduced (see Financial Stability Report 2023 H1). Moreover, homeowners can expect an increase in expenditure on energy efficiency improvements, as well as insurance against multiple risks. In a disorderly transition, for example if emission reductions are not coordinated globally, or in the event of a more severe natural disaster than currently assumed in climate forecasts, the risk of substantial credit losses will be markedly higher than assumed in this Report.
10 Left panel:
Period: January 2017 – April 2024.Right panel:
Period: January 2017 – March 2024.11 Period: 2010 Q1 – 2027 Q4.
Projections from 2024 Q1 for MPR 1/24. Debt burden is debt as a share of disposable income. Disposable income is after-tax income less interest expenses. Debt-service ratio is interest expenses and estimated principal payments on loan debt as a percentage of after-tax income. Interest burden is interest payments as a percentage of after-tax income. For 2023 there are unusually large differences between different measures of household interest expenses. Estimates based on household interest rate data (Statistics Norway table 10745) and debt (Statistics Norway table 09560) indicate significantly higher interest expenses than preliminary data from income and capital accounts (IKR). When calculating the interest burden and debt-to-income ratio, Norges Bank usually uses historical IKR data and estimates based on the relationship between estimated interest rates and the stock of household debt. The dark green line shows the alternative interest burden in 2023 if the relationship between lending rates and the stock of interest-bearing debt is used to estimate interest expenses.
12 Analyses of household debt based on latest available microdata on income and wealth will be presented in Financial Stability Report 2024 H2.
14 Period: 2007 Q1 – 2027 Q4.
Projections from 2024 Q2 for FSR 2024 H1 for commercial property prices.
13 Period: January 2013 – April 2024.
Left panel: Share of firms that have gone bankrupt over the past 12 months is total bankruptcies over the past 12 months as a share of the number of firms in the sector over the past 12 months.
Right panel: Monthly share of firms facing new debt collection cases is the number of firms with at least one newly reported past-due payment per month as a share of firms in the sector.
1.3 Financial system vulnerabilities may affect banks’ liquidity
The main sources of bank funding are deposits and long-term bonds, which both represent a stable funding base for Norwegian banks. Liquidity stress may arise even among solid banks, for example as a result of severe cyberattacks. Financial system vulnerabilities may amplify liquidity problems.
One bank’s funding is another’s liquidity reserve
Banks in Norway are interconnected through interbank exposures and common or similar securities in their liquidity reserves. Covered bonds account for a substantial share of banking groups’ wholesale funding. At the same time, banks own over 60% of outstanding covered bonds issued in NOK, which is broadly the same level as in recent years (see Section 3).
The purpose of owning liquid securities is to enable banks to sell or pledge these securities if they have difficulties obtaining new funding. In the event of simultaneous fire sales of covered bonds by a large number of banks, prices may fall sharply, reducing the value of banks’ liquidity reserves. Moreover, it could then become even more difficult for banks to obtain fresh funding, weakening their resilience to further liquidity problems.
Serious cyberattacks can undermine confidence in banks and lead to deposit withdrawals
The financial sector is an attractive target for cyberattacks. According to the Nordic Financial CERT’s assessment, the cyber threat to the Nordic financial sector is high.15 At the same time, in Norges Bank’s assessment, the financial infrastructure is resilient (see Financial Infrastructure Report 2023).16 The banks work continuously to maintain and enhance their cyber defences, and most attacks are averted before they impact banks’ customers.17 Nonetheless, serious attacks could arise.
The financial system’s characteristics can potentially amplify and spread the consequences of a cyberattack. For example, an attack on critical infrastructure or key ICT providers may quickly create problems in large parts of the financial system. The consequences of such an attack could spread further through operational and financial interconnections between institutions. If the overall consequences are extensive, financial stability could be threatened. Section 3 examines how a cyberattack could lead to a loss of confidence and liquidity problems for banks.
15 Nordic Financial CERT (NFCERT) is a collaborative initiative for the Nordic financial sector to strengthen resilience to cyberattacks through for example threat information sharing (see the 2024 Cyber Threat Landscape for the Nordic Financial Sector).
16 Cyber risk and vulnerabilities in the financial infrastructure are also discussed in the forthcoming Financial Infrastructure Report 2024, which will be published on 5 June.
17 See Finanstilsynet (2024) “Risiko- og sårbarhetsanalyse (ROS) 2024” [Risk and vulnerability analysis (ROS) 2024] (in Norwegian only, forthcoming in English).
1.4 The Norwegian financial system is robust owing to its resilience and the measures implemented
Firms and households have ample access to credit. However, financial system vulnerabilities imply that financial institutions must be resilient to enable them to extend credit even in the event of a sharp decline in economic growth. Financial institutions’ resilience primarily depends on sound risk management. In addition, banks’ capital and liquidity requirements mitigate systemic financial risk.
Ample access to credit
Over the past year, banks in Norges Bank’s lending survey have reported unchanged credit standards for both households and firms. This means that banks’ credit assessments are not stricter than before, but higher interest rates have limited how much households and firms can borrow.
In the bond market, credit risk premiums have fallen since the November 2023 Financial Stability Report, and issue activity has picked up.
Capital requirements and solid profitability contribute to Norwegian banks’ solvency and capacity to extend credit even in turbulent times.
Capital requirements comprise minimum requirements and a number of buffer requirements. Norges Bank sets the countercyclical capital buffer (CCyB) rate each quarter and provides the Ministry of Finance with advice on the systemic risk buffer rate at least every other year.
The CCyB is intended to reflect the assessment of cyclical vulnerabilities in the financial system and mitigate the risk of banks amplifying an economic downturn. According to the capital framework, the CCyB is intended, in principle, to range between 0% and 2.5%. Norges Bank will normally set the buffer rate in the upper part of this range. In the event of particularly high cyclical vulnerabilities, the CCyB rate may be set above 2.5%. On 2 May, Norges Bank’s Monetary Policy and Financial Stability Committee decided to keep the CCyB unchanged at 2.5%.
The systemic risk buffer (SyRB) rate should reflect the assessment of structural vulnerabilities in the financial system. Norges Bank has advised the Ministry of Finance to maintain the SyRB rate of 4.5% for all exposures in Norway.18 In Norges Bank’s assessment, key structural vulnerabilities in the Norwegian financial system are broadly at the same level as in the previous assessment in 2022. It is further assessed that an SyRB rate of 4.5% contributes to banks holding sufficient capital to withstand future downturns.
Stress tests show that even in a severe downturn, the current capital buffers of the largest Norwegian banks are sufficient to absorb substantial losses while allowing banks to continue to extend credit (see Section 2). Norges Bank’s decision to keep the CCyB rate unchanged, and its advice that the SyRB rate should be maintained, contribute to maintaining a resilient banking sector.
Norwegian banks satisfy liquidity requirements and have ample access to funding
Norwegian banks meet the liquidity and stable funding requirements. Moreover, Norwegian banks’ access to the money market and to long-term wholesale funding in turbulent times is underpinned by their solvency (see Section 2). The liquidity stress test in Section 3 indicates that Norwegian banks are equipped to withstand large withdrawals of bank deposits.
18 See Norges Bank’s letter to the Ministry of Finance of 8 May 2024 with advice on the SyRB rate.
Financial systemic risk
The financial system contributes to stable economic developments by channelling funds and offering savings products, executing payments and distributing risk effectively. Systemic risk, ie the risk of disruption to the financial system’s ability to perform these functions, is high when the risk of shocks is deemed elevated or when financial vulnerabilities are high, but such risk can be mitigated by financial system resilience (see table below).
The financial system is global. Shocks to financial markets or the real economy in other countries can therefore spread to Norway. Shocks may result in an economic downturn, which may be amplified the more severe the vulnerabilities are in the financial system. The high indebtedness of many households is a key vulnerability.
Financial stability depends on banks having sufficient resilience to be able to service customers through an economic downturn. This is because banks are by far the primary source of credit for Norwegian households and firms, and the only provider of deposit services.
Deposits can often be withdrawn at any time, while loans generally have long maturities. The use of short-term funding for long-term lending is referred to as maturity transformation. This leads to substantial economic gains but at the same time exposes banks to liquidity risk.
Failure in the ability of banks to fulfil their role, for example in a banking crisis, will result in high economic costs. Banks are therefore subject to specific regulations and have access to Norges Bank’s lending facilities. Sound risk management, liquidity regulation and capital requirements strengthen bank resilience so that banks are able to perform their role.

2. Bank earnings and solvency
Stable earnings and sufficient solvency among banks improve financial system resilience, which also presupposes efficiency and sound risk management. This section primarily examines Norwegian banks’ earnings and solvency.
2.1 Bank profitability is expected to decline slightly
Banking sector profitability has been high through the post-pandemic tightening cycle. The return on equity of many banks abroad has also increased. Looking ahead, profitability is expected to decline to a more normal level on the back of both gradually lower net interest income and slightly higher credit losses.
Norwegian banks are highly profitable
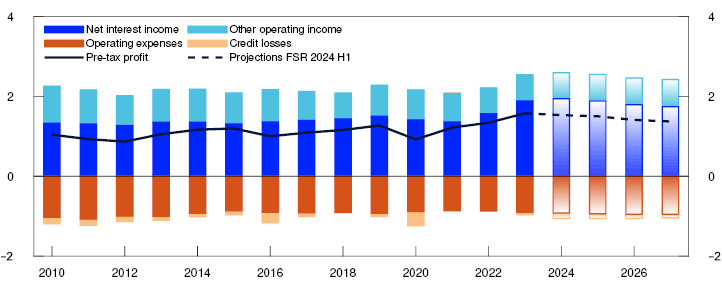
Banks’ profits have increased since 2020 (Chart 2.1), reflecting net interest income growth since the tightening cycle began in 2021. Higher loan loss provisions (LLPs) at the outbreak of the pandemic pulled down profits. In the post-pandemic period, losses have been almost zero. This has also boosted profitability, and return on equity for 2023 rose to 14.8% (Chart 2.2).
Income statement items as a percentage of average total assets
Return on equity after tax. Percent
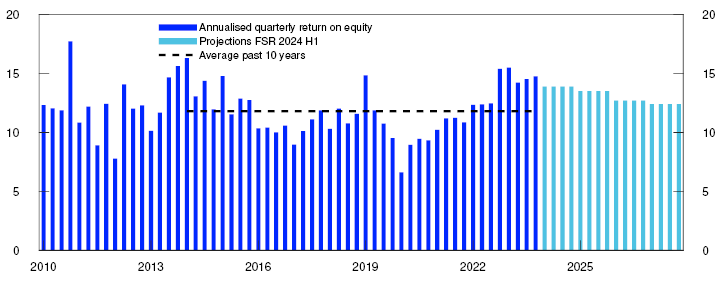
Net interest income, which is the most important source of banks’ income, is projected to moderate in the coming years. Losses are expected to increase somewhat but remain moderate, which means that banks’ return on equity is expected to remain high, above 12% in the years ahead.
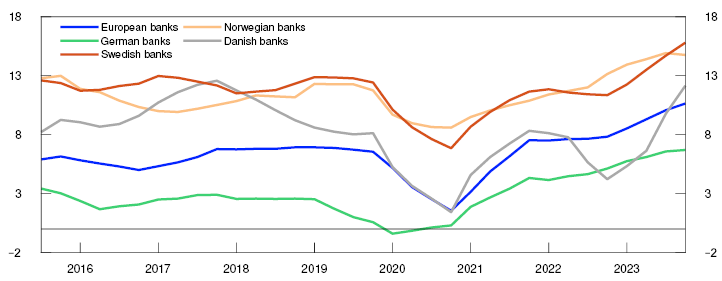
Profitability also improved in banks abroad
Since the rise in interest rates began in 2021, profitability has also improved among banks in other European countries (Chart 2.3).
Return on equity. Percent
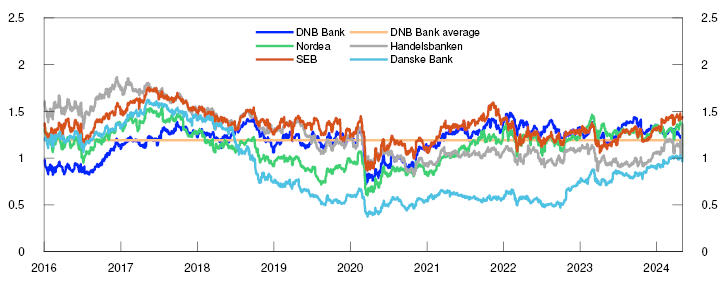
In isolation, the profitability of the large Nordic banks has also strengthened. The ratio of the market value of equity to its book value (price-to-book) is influenced by the ratio between return on equity and the market’s required rate of return.4 In terms of accounting, if return is much higher than the required rate of return, a high price-to-book ratio can be expected. From a longer perspective, the pricing of the large Nordic banks in recent years does not indicate particularly high deviation between the return on equity and the market’s required rate of return (Chart 2.4).
Developments in price-to-book ratios for large Nordic banks
Competition is important for credit market efficiency
In a well-functioning credit market, capital is channelled at low cost. It is important for economic growth that corporate credit is channelled to profitable purposes. In a bank-based financial system like Norway’s, banks and mortgage companies are the largest providers of debt financing. Interbank competition is important because it promotes efficiency.
Competition ensures that borrowers can choose the banks they wish to borrow from. The possibility to switch banks increases customers’ bargaining power and gives banks an incentive to reduce costs in order to offer competitive terms. However, banks' lending spreads are intended to cover expected losses in addition to costs. Higher credit risk in isolation should therefore result in higher lending rates. Expected losses must be covered by banks' current earnings, while particularly high or unexpected losses must be covered by banks' capital reserves. The capital adequacy framework sets out the authorities' regulatory capital requirements that banks must meet to cover such high unexpected losses.
Mergers have reduced the number of banks in Norway in recent years. The Norwegian Competition Authority plays a key role in assessing whether such mergers are in accordance with competition legislation. Banks’ profitability in Norway and other European countries has increased as interest rates have risen, raising the question of whether interbank competition is sufficiently strong. Several assessments have been made of competition in the banking market. The Financial Market Report 2024 (in Norwegian only) summarises some of these assessments and refers to a number of measures that may promote competition, such as better information and measures that make it easier to switch banks.
Solvent and profitable banks are essential for financial stability. It is important that banks maintain prudent banking practices and charge for credit risk exposure. At the same time, in a longer perspective, we see that profitability in the banking sector varies. Periods of particularly high or low profitability are often transitory. A period of high profitability does not therefore necessarily indicate that competition is weak. However, it is important to assess measures that can promote competition. Better banking product information and lower costs when switching banks may contribute to this. Improved competition also presupposes active bank customers that compare offers from more than one bank and are willing to switch banks.
Policy rate hikes typically push up net interest income
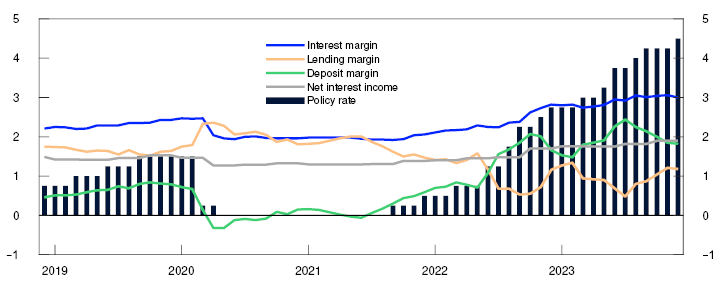
A higher policy rate level often precedes higher net interest income.6 An important reason for this is that banks have more interest-bearing assets than interest-bearing liabilities, entailing a faster rise in interest income than interest expenses when the policy rate is raised (equity effect). Another reason for the rise is that following a policy rate hike, banks tend to raise the average lending rate more than deposit rates (interest margin increase). Since the tightening cycle began in 2021, about half of the rise in net interest income in the largest banks has been attributable to the equity effect and the rest to interest margin increases.
An increase in the interest margin is likely to be particularly pronounced when the policy rate is raised from a very low level, as during the pandemic, because banks are reluctant to set deposit rates below zero and have a narrow interest margin when the policy rate is particularly low (Chart 2.5). The deposit margin (difference between the money market rate and the deposit rate) was low during the pandemic but has since increased substantially. A lower lending margin (difference between the lending rate and the money market rate) has had a dampening effect on banks’ overall interest margin.
Percent and percentage points
The increase in banks’ net interest income that follows from a higher deposit margin is dampened by the fact that deposits are not the only funding source. Banks’ funding also includes a large share of wholesale funding. Wholesale funding costs have increased more in pace with the policy rate level.
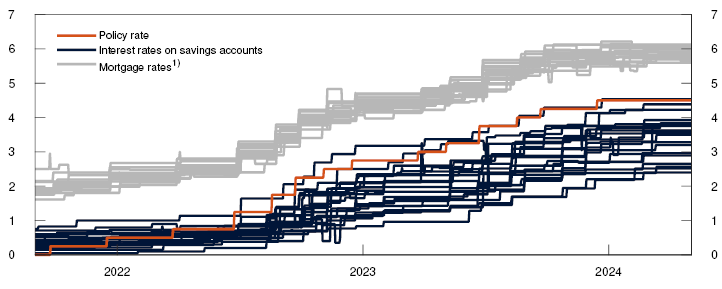
Interest margins may also be affected by competition. An ample supply of deposits during and after the pandemic may have reduced the need for banks to compete for deposits. This may have amplified the rise in the deposit margin. There are considerable differences between the deposit rates offered by different banks. The spread between these rates is wider than for residential mortgage rates and has widened since the general rise in interest rates started (Chart 2.6). This may indicate that competition is weaker for deposits than for mortgages. Deposit growth fell through 2023 and the deposit margin is expected to fall somewhat as a result of increased competition. Based on the policy rate forecast in the March 2024 Monetary Policy Report, banks’ net interest income is also expected to eventually fall slightly.
Estimated average quoted rates. Percent
Credit losses are expected to be somewhat higher, which will pull down earnings slightly
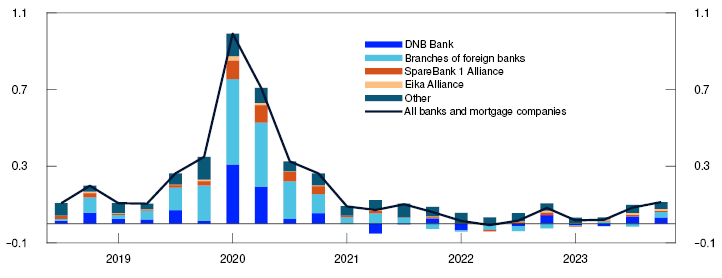
Banks’ losses are still low (Chart 2.7). Reversals of earlier LLPs have contributed to low losses, particularly for foreign bank branches in Norway, whose reversals have been substantial on exposures to oil, gas and shipping.
Annualised quarterly loan losses. In percent of gross lending to customers. Contributions from different banking groups
Source: Norges Bank
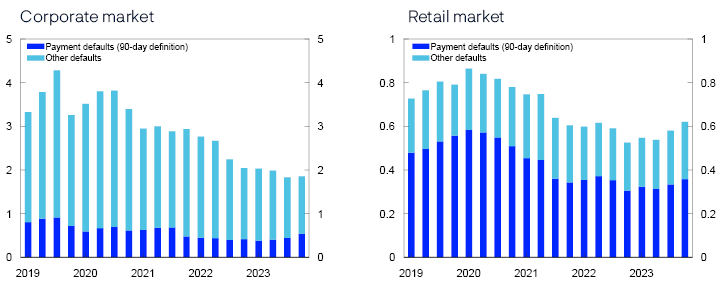
In recent quarters, defaults have increased slightly in the retail market, while falling steadily since the end of 2020 in the corporate market (Chart 2.8). Payment defaults have increased somewhat in both markets in recent quarters.
Non-performing loans as a share of lending to the sector. Percent
In the March 2024 Monetary Policy Report, growth in the Norwegian economy is projected to remain low through the first half of 2024 before picking up. Continued lower-than-normal economic growth, high interest expenses and weak commercial property price developments are expected to result in somewhat higher credit losses ahead11, albeit from a very low level (Chart 2.9). In particular, somewhat higher losses for firms in the real estate sector are expected. CRE firms’ debt-to-revenue ratios are high and therefore vulnerable to higher interest expenses.12 Losses are also expected to increase somewhat in retail trade owing to weak developments in household consumption, but banks’ exposures to this industry are relatively small. Losses on loans to households are expected to rise somewhat as a result of the higher interest expenses but remain at a low level.
Percent

There is uncertainty surrounding economic developments ahead. There are wide differences across industries and increased defaults in some. If rental income developments in the CRE sector prove markedly weaker than expected and selling prices fall markedly, bank losses may rise substantially. The solvency stress test illustrates a possible adverse scenario for the Norwegian economy and the potential effects on banks (see Section 2.2).
1 Period: 2010–2027.
Projections from 2024 for FSR 2024 H1.
Figures for the 7 largest Norwegian-owned banking groups. For comparability, the sample is retrospectively adjusted for major mergers and aquisitions, ie for the period preceeding a merger or aquisition, the figures for the merged banks are aggregated.
2 Period: 2010 Q1 – 2027 Q4.
Projections from 2024 Q1 for FSR 2024 H1.
Figures for the 7 largest Norwegian-owned banking groups. Annualised.
For comparability, the sample is retrospectively adjusted for major mergers and aquisitions, ie for the period preceeding a merger or aquisition, the figures for the merged banks are aggregated.
3 Period: 2015 Q3 – 2023 Q4.
Four-quarter moving average. The series are based on the European Banking Authority’s (EBA) “Risk Dashboard”. The sample varies over time. For Norway, figures for the 7 largest Norwegian-owned banking groups from S&P Capital IQ and Norges Bank are used. For comparability, the sample is retrospectively adjusted for major mergers and aquisitions, ie for the period preceeding a merger or aquisition, the figures for the merged banks are aggregated.
4 Investors’ required rate of return for holding equities are determined by the profitability that can be achieved by holding other equities with the same level of risk. Future dividend payouts are determined by banks’ return on equity (ROE) and the dividend payout ratio. In a model where equity prices are calculated based on discounting future dividend payouts, the price-to-book ratio is determined by ROE, the discount rate (the market’s required rate of return) and future dividend growth.
6 Historically, a higher policy rate has typically pulled up net interest income as a percentage of average total assets, see Alstadheim, R. and R. Johansen (2023) “Norwegian banks’ net interest income and macroeconomic developments over the past 30 years”. Staff Memo 17/2023. Norges Bank.
8 Period: 1 September 2021 – 3 May 2024.
1) Floating nominal interest rate.
Sample of 20 largest banks measured by outstanding volume of freely useable deposits and residential mortgages at December 2023.
The interest rates in the chart are an estimated average rate per bank for all products from Finansportalen included in the categories.
Residential mortgages include amortising loan products with floating rates. The products’ loan-to-value ratios vary between 60 and 85 percent.
Household savings accounts include deposit products without fixed terms and do not include current accounts.
9 Period: 2018 Q3 – 2023 Q4.
All banks and mortgage companies in Norway.
Branches and subsidiaries abroad are not included.
10 Period: 2019 Q1 – 2023 Q4.
According to the capital framework, a loan is considered to be in default when a payment claim is 90 days past due and the amount is not insignificant (payment default), or if there is little likelihood that the counterparty will be able to meet their debt obligations (other defaults).
All banks and mortgage companies in Norway.
11 The Bank’s expectations of somewhat higher credit losses, as a percentage of average total assets, are supported by a set of simple VAR models for banks’ credit losses. The VAR models include key macroeconomic variables such as Norwegian mainland GDP, policy rate, core inflation and the real exchange rate. The set of VAR models is expanded based on a broad set of financial indicators that includes commodity prices, property prices, expectation indicators and alternative measures of activity and interest rates. Expectations ahead are based on the March 2024 Monetary Policy Report. The Bank’s expectations are also supported by models that estimate corporate bankruptcy probabilities, which indicate that probabilities will increase somewhat in 2024 and remain elevated in 2025. See Hjelseth, I. and A. Raknerud (2016) “A model of credit risk in the corporate sector based on bankrupcty prediction”. Staff Memo 20/2016. Norges Bank. See also Hjelseth, I., A. Raknerud and B.H. Vatne (2022) “A bankruptcy probability model for assessing credit risk on corporate loans with automated variable selection". Working Paper 7/2022. Norges Bank.
5 Period: 1 January 2016 – 3 May 2024.
The price-to-book ratio is the market value of equity relative to the book value of equity.
7 Period: December 2018 – December 2023.
Interest margin, lending margin and deposit margin for a sample of banks and mortgage companies in Norway.
Net interest income as a percentage of average total assets for the 7 largest Norwegian-owned banking groups. For comparability, the sample is retrospectively adjusted for major mergers and aquisitions, ie for the period preceeding a merger or aquisition, the figures for the merged banks are aggregated.
Lending margin is the difference between lending rate and three-month money market rate (NIBOR). Deposit margin is the difference between money market rate and deposit rate.
Interest margin, lending margin and deposit margin are in percentage points. Policy rate and net interest income are in percent.
12 For more detailed analyses of developments in household and corporate risk, see Financial Stability Report 2023 H2.
13 Period: 2000–2027.
Projections from 2024 for FSR 2024 H1 for credit losses and from MPR 1/24 for mainland GDP.
Credit losses as a percentage of average total assets (ATA) for the 7 largest Norwegian-owned banking groups. For comparability, the sample is retrospectively adjusted for major mergers and aquisitions, ie for the period preceeding a merger or aquisition, the figures for the merged banks are aggregated.
Credit losses and loss provisioning in large Norwegian banks
Loans are the most important assets of banks. Historically, most banking crises have been caused by substantial credit losses. In 2018, a new accounting standard, IFRS 9, for impairment recognition was introduced.1 Under the new rules, loan loss provisions (LLPs) are to be more forward-looking and reflect expected credit losses (ECLs).2 While the stock of LLPs provides an indication of what banks expect to lose on their loan portfolios, losses recorded in banks’ income statements (recognised credit losses) express the amount to be charged against the accounts for the period.
Loss provisioning and losses under IFRS 9
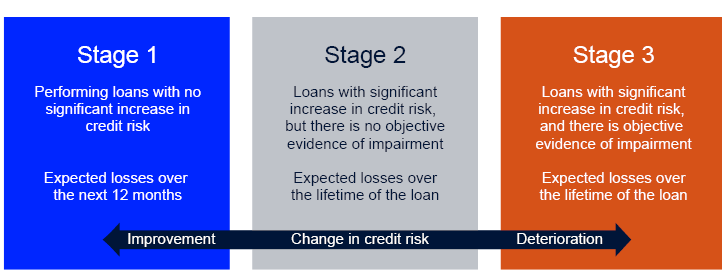
Loan loss provisions (LLPs): Under IFRS 9, loans must generally be classified in one of three stages (Chart 2.A). Loss provisioning for performing loans with no significant increase in credit risk since initial recognition must be based on ECLs over the next 12 months (Stage 1). If a loan’s credit risk has increased significantly, lifetime ECLs are recognised in Stages 2 and 3. Loans are classified in Stage 2 if the credit risk has increased significantly and there is no objective evidence of impairment. Banks define their own criteria for the level of and change in a loan’s probability of default (PD) that is indicative of a significant increase in credit risk.3 A change in classification from stage 2 to stage 3 requires objective evidence of impairment, for example a loan past due for 90 days or more.
Following a period of higher credit risk, the stock of LLPs will increase. Correspondingly, if estimated credit risk improves, the stock of LLPs will be reduced. ECLs can be recognised as an actual loss in the future and the loan is then written off.4 Writing off loans means that loans and related LLPs are removed from the balance sheet, which reduces the stock of LLPs. If the actual loss is already covered by earlier LLPs, the bank’s income statement will not be affected by the write-off.
Recognised credit losses: Losses recorded on the banks’ income statement that pull down earnings in a period. Recognised credit losses consist of the increase in LLPs resulting from changes in estimated credit risk in the period, with the addition of net write-offs not previously covered by LLPs.5
Developments in losses and loss provisioning since the introduction of IFRS 9
Since the introduction of IFRS 9 in 2018, changes in estimated credit risk have largely driven changes in banks’ credit loss recognitions. At the onset of the pandemic, higher credit risk pushed up banks’ credit losses in some quarters. In subsequent years, credit losses have been close to zero (Chart 2.B).
Recognised credit losses and stock of loan loss provisions as a percentage of gross lending
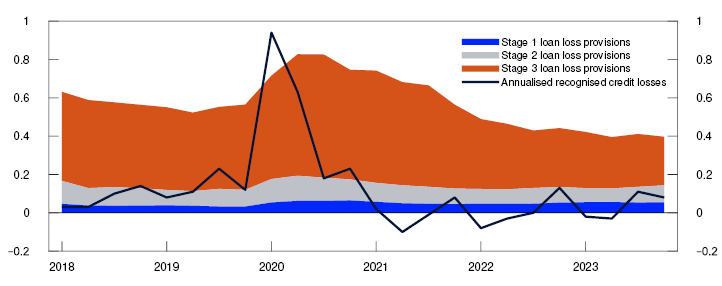
Banks’ LLP stocks increased at the beginning of the pandemic and have since been gradually reduced (Chart 2.B). LLPs are now at a low level and lower than before the pandemic. This provides little room for a substantial reduction in estimated credit risk to push down further on LLP stocks. Since the introduction of the new LLP rules, changes in stage 3 have largely driven developments in banks’ LLPs.
During the pandemic, higher estimated credit risk pushed up LLPs (Chart 2.C). For large Norwegian banks as a whole, it was write-offs that largely pushed LLPs back down. Lower estimated credit risk also contributed to somewhat lower LLPs. In 2023, somewhat higher estimated credit risk contributed to pulling up LLPs, while write-offs have pulled down LLPs. Overall, LLPs in 2023 were approximately unchanged.
Contributions to changes in loan loss provisions. Four-quarter moving average. Annualised percentage points as share of gross lending

Some signs of higher credit risk for large Norwegian banks’ exposures
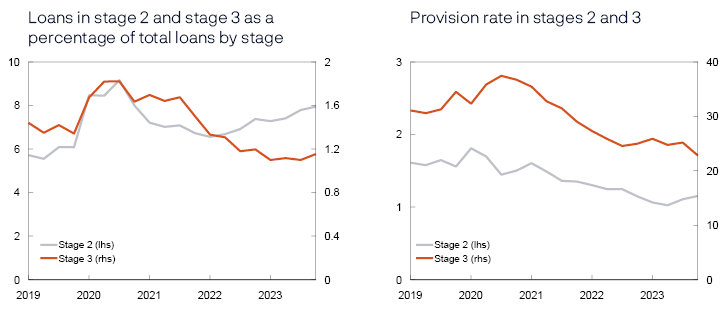
Banks’ LLPs are currently at a low level, but loans in stage 2 have risen in recent years. Moving loans from stage 1 to stage 2 can be viewed as an early warning of deteriorating credit quality. For large Norwegian banks, we have seen that the stock of loans in stage 2, measured as a percentage of gross lending, has gradually increased (Chart 2.D). Volume levels in 2023 Q4 are approaching pandemic levels. At the same time as loan volumes have increased in stage 2 over the past two years, the provision rate (total loss provisions as a share of lending volume) in stage 2 has declined. Movements in stage 2 LLPs were therefore minor (Chart 2.B). Even though the large banks’ stocks of loans in stage 3 have declined in the wake of the pandemic, loans with a substantial increase in credit risk (stages 2 and 3 together) have edged up in recent years.
Lending by large Norwegian banks. Percent
1 International Financial Reporting Standards (IFRS). See Andersen, H. and I.N. Hjelseth (2019), “How does IFRS 9 affect banks’ impairment recognition in bad times?” Staff Memo 9/2019, Norges Bank. The old rules only gave banks the right (and obligation) to write down the value of a loan when there was objective evidence of a loss event.
7 Period: 2019 Q1 – 2023 Q4.
Figures for the 7 largest Norwegian-owned banking groups.
Other causes include changes that are not included in the other categories.
8 Period: 2019 Q1 – 2023 Q4.
Figures for the 7 largest Norwegian-owned banking groups.
Left panel: Loans in stages 2 and 3 as a percentage of total loans by stage. Loans include both loans at fair value and at amortised cost.
Right panel: The provision rate is estimated as loan loss provisions in each stage as a percentage of loans in the stage.
2 Expected credit losses (ECLs) in each period are determined by three components: 1) Probability of default (PD), 2) Loss given default (LGD) and 3) Exposure at default (EAD).
3 Both external auditors and Financial Supervisory Authority of Norway are responsible for following up how banks apply IFRS 9.
4 Loans are written off when it is highly likely that losses are final, for example upon final liquidation of a company or settlement of an estate after a death.
5 This means that loan write-offs only affect the income statement if the loss proves to be lower or higher than expected, based on the previous ECL.
6 Period: 2018 Q1 – 2023 Q4.
Figures for the 7 largest Norwegian-owned banking groups and their fully owned covered bond mortgage companies.
Loan loss provisions on the balance sheet broken down by stage.
Credit losses are recognised credit losses in the period as a percentage of gross lending.
2.2 Banks’ capital ratios are sufficient to withstand a severe downturn
The risk-based CET1 capital ratio of Norwegian banks has been above 18% since 2020, and a solvency stress test of the largest banks shows that they hold sufficient equity capital to avoid amplifying a severe downturn by tightening credit.
Banks’ capital adequacy is expected to remain elevated
For banks in the stress scenario, the risk-based CET1 capital ratio is compared with a baseline scenario that is based on expected developments in banks’ earnings.14
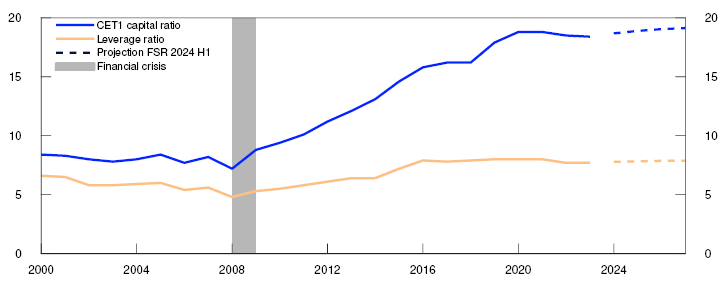
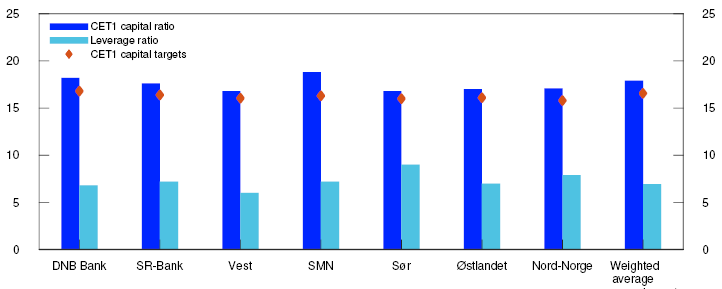
If the economy evolves as projected in the March 2024 Monetary Policy Report, banks’ capital ratios are expected to remain at a high level in the coming years (Charts 2.10 and 2.13). The leverage ratio is also expected to be high in the projection period, just below 8%. The largest banks all meet the regulatory capital requirements by an ample margin. The CET1 capital ratio is also above banks’ own target ratios (Chart 2.11).
Norwegian banks’ CET1 capital and leverage ratios. Percent
At 31 December 2023. Percent
The stress scenario reflects the vulnerability associated with the high level of household debt
The purpose of the stress test is to show the capacity of banks to withstand a severe downturn without tightening credit supply, and a hypothetical scenario is designed with such a downturn. The stress test is based on the current macroeconomic situation and banks’ capital ratios.
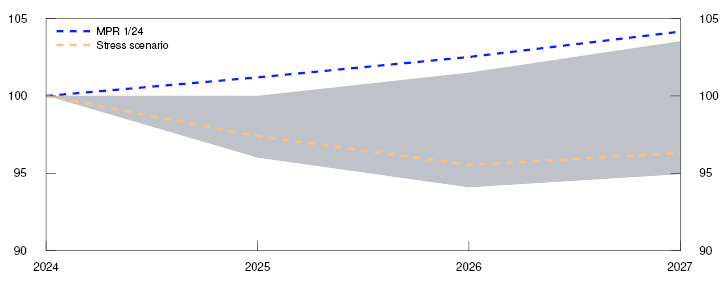
The baseline scenario for activity levels in the Norwegian economy is in line with projections in the March 2024 Monetary Policy Report (Chart 2.12). In the stress test, the economy is assumed to be exposed to large shocks. Crisis depth in the stress scenario reflects the Bank’s vulnerability assessment, which is partly based on the growth-at-risk framework17. This framework seeks to quantify the extent to which an increase in financial system vulnerabilities can lead to greater downside risk. A probability of 5% or less is assumed for observing the GDP growth in the scenario. Compared with the baseline scenario, the stress scenario suggests a GDP level approximately 8% lower at the end of 2027 (Chart 2.12). In the stress test, households are assumed to be particularly vulnerable following a prolonged period of higher interest rates, a falling savings ratio and reduced financial buffers. Automatic fiscal stabilisers are assumed to function normally in this scenario, but no specific fiscal response to the crisis is assumed.
Chart 2.12 Sharp decline in GDP18
Mainland GDP in baseline and stress scenario. Index. 2024 = 100
The stress test assumes new global supply shocks, with global inflation and interest rates increasing while output abroad declines. At the same time, the krone depreciates, and imported goods inflation rises. Moreover, higher intermediate goods prices for Norwegian output and higher wages push up domestic inflation, which becomes substantially higher than projected in the March 2024 Monetary Policy Report (Table 2.1). As a technical assumption, the policy rate follows a simple rule that gives weight to inflation as a deviation from the inflation target and output gap.19 The simple rule implies an increase in the policy rate in response to high inflation.
Table 2.1 Macroeconomic key variables. Annual change.20 Percent
|
2024 |
2025 |
2026 |
2027 |
|
|---|---|---|---|---|
|
GDP for mainland Norway |
0.5 |
-2.6 |
-1.9 |
0.8 |
|
Private consumption |
1.0 |
-3.1 |
-0.1 |
1.9 |
|
Registered unemployment (rate, level) |
2.0 |
3.3 |
4.3 |
4.1 |
|
House prices |
2.9 |
-13.6 |
-7.3 |
4.7 |
|
Credit (C2) to households |
2.7 |
-1.9 |
-0.9 |
1.7 |
|
Credit (C2) to NFEs, mainland Norway21 |
4.3 |
-3.6 |
-1.9 |
2.4 |
|
Countercyclical capital buffer (CCyB) (level) |
2.5 |
0.0 |
0.0 |
0.0 |
|
Commercial property prices22 |
-11.1 |
-18.5 |
-10.1 |
10.8 |
|
Total credit losses (percent of loans, level)23 |
0.2 |
2.4 |
1.5 |
1.1 |
|
Corporate credit losses (percent of loans, level) |
0.4 |
4.0 |
2.5 |
1.7 |
|
Household credit losses (percent of loans, level) |
0.1 |
1.2 |
0.8 |
0.6 |
|
Consumer price index (CPI-ATE) |
4.1 |
6.7 |
4.9 |
3.7 |
|
Mortgage rate (level) |
5.7 |
8.7 |
7.0 |
5.2 |
|
CET1 capital ratio (level)4 |
18.2 |
16.7 |
17.3 |
17.6 |
The tightening of financial conditions resulting from higher interest rates is amplified by higher risk premiums on banks’ funding, which are passed on to lending rates. The interest margin is held constant throughout the scenario. Households respond to higher living costs and interest rates by sharply reducing consumption. In addition, activity is pushed down by a sharp fall in investment. As a result of heightened uncertainty and reduced economic activity, residential and commercial property prices fall markedly. Overall, this results in a pronounced and protracted decline in activity levels.
Firms that benefit from a weaker krone cope relatively well through the downturn, while others face a sharp rise in intermediate goods prices and reduced demand. CRE firms in particular are hit hard as a result of the fall in residential and commercial property prices. In the scenario, a countercyclical capital buffer (CCyB) of zero is assumed, which allows banks to continue lending.
Banks must recognise substantial corporate credit losses because many firms in the scenario face weak demand and difficulties fully passing on costs to prices. Banks face substantial losses on CRE exposures and also incur increased credit losses in the household sector owing to a fall in house prices and higher unemployment.
The stress test shows the importance of capital buffers
The stress test shows that the capital buffers of the largest Norwegian banks as a whole are sufficient to absorb losses in a severe downturn (Chart 2.13). After the CCyB has been reduced, banks will continue to have ample margins above total capital requirements, including Finanstilsynet’s (Financial Supervisory Authority of Norway) Pillar 2 guidance, and therefore do not need to tighten lending to meet the capital requirements. This helps banks avoid contributing to amplifying the downturn. Net interest income contributes to sustaining capital adequacy, while higher losses on loans and securities portfolios reduce it.
Macro bank’s capital requirements and CET1 ratio, baseline and stress scenario. Percent
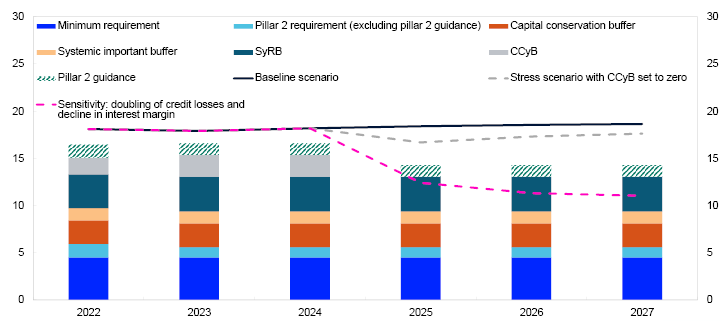
There is uncertainty as to how interest margins and losses will evolve in a stress scenario. Credit losses must be twice as large as in the stress scenario and the interest margin 25 basis points lower before earnings become so weak that the macro bank25 depletes a substantial share of the systemic risk buffer (SyRB) (Chart 2.13). Such losses can arise during other and more severe and prolonged downturns than assumed in this scenario, for example, if a downturn affects a larger part of the Norwegian business sector, or on account of new and unexpected mechanisms in the financial system. If the downturn is steeper than assumed, banks could end up reducing their lending and amplify it further. The SyRB can also be lowered if a downturn is so severe that a reduction of the CCyB is not sufficient.
14 The analysis does not take into account pending regulatory amendments. In the EU, changes are planned for bank capital requirements in 2025, which will be introduced in Norway under the EEA Agreement. Analyses show that the regulatory changes may lead to a substantial reduction in capital requirements for small and medium-sized banks (standardised approach banks) with low risk. See Andersen, H. and J. Johnsen (2023) “Effects of the new standardised approach and the new output floor for IRB banks”, Staff Memo 8/2023, Norges Bank. The new rules will have limited implications for the largest Norwegian banks (IRB banks), but they may contribute to more equal and comparable capital requirements for Norwegian and foreign banks. Overall, the regulatory amendments may therefore level the playing field for banks in Norway, but in isolation also reduce banks’ capital levels without correspondingly reducing risk.
16 The 7 largest norwegian-owned banking groups and a weighted average.
Capital targets are defined here as regulatory requirements with a margin above the capital requirements.
17 See box in Financial Stability Report 2019 (pages 41–42) and Saxegaard, E. C. A., K. R. Gerdrup and R. M. Johansen (2020) “Financial imbalances and medium-term growth-at-risk in Norway”. Staff Memo 5/2020. Norges Bank.
19 See an example of the simple rule on page 49 of the December 2021 Monetary Policy Report. It does not represent an assumption of actual monetary policy in a crisis situation.
25 The macro bank is an aggregate of the largest Norwegian-owned banking groups and comprises DNB Bank, SpareBank 1 SR-Bank, Sparebanken Vest, SpareBank 1 SMN, Sparebanken Sør, SpareBank 1 Østlandet and SpareBank 1 Nord-Norge.
15 Period: 2000–2027.
Projection from 2024 for FSR 2024 H1.
Banks did not report leverage ratios until 2014. The chart therefore shows CET1 capital as a share of total assets up to 2013 and leverage ratios from 2014. Both measure non-risk-weighted solvency and were virtually identical in 2014.
All Norwegian banks, highest level of consolidation.
18 Period: 2024–2027.
Mainland GDP is used as an indicator of stress scenario severity where crisis depth is based on the growth-at-risk framework (GaR) (see Financial Stability Report 2019, pp 41–42). The GaR framework uses quantile regressions to link GDP downside risk to measures of financial imbalances and risk. Downside GDP risk is defined as the 5th percentile of the GDP distribution.
20 Unless otherwise stated, level variables are measured as annual averages. Projections for 2024 for Norwegian mainland GDP, private consumption, registered unemployment, house prices, credit, consumer price index and lending rates are taken from the March 2024 Monetary Policy Report.
21 NFCs are non-financial corporates.
22 Prices for prime office space in Oslo.
23 Total credit losses and CET1 capital ratio for the macro bank.
Sources: Eiendomsverdi AS, Entra, Finn.no, Jones Lang LaSalle (JLL), Labour and Welfare Administration (NAV), Real Estate Norway, Statistics Norway and Norges Bank
24 Period: 2022–2027.
Projections from 2024 for FSR 2024 H1.
Stress scenario from 2025.
All components of the macro bank’s CET1 capital requirement are assumed unchanged after 31 December 2023, with an exception for the CCyB requirement in the stress scenario. Bank-specific requirements are weighted together.
Climate transition may result in higher losses at the same time as needs arise for new investment
Stricter requirements for climate transition can be expected in the years ahead. Emissions must be reduced faster than has been the case so far in order to meet the climate targets to which Norway has committed under the Paris Agreement.
Norwegian banks are exposed to industries that will have to implement substantial climate-related changes. This applies to carbon-intensive industries such as manufacturing, transport and the petroleum sector, but also to some real estate segments. To bring down emissions, framework conditions must be changed, particularly by increasing emission taxes. Higher business costs may trigger bank losses on corporate exposures. At the same time, climate transition will require substantial investment.
Norges Bank has analysed how the combination of higher emission taxes and increased investment may affect banks’ customers through changes in loss risk and investment needs. Such analyses of how climate policy may affect banks’ balance sheets are often referred to as “climate stress tests”. In the period between 2020 and 2021, the IMF, Norges Bank and Finanstilsynet (Financial Supervisory Authority of Norway) published various examples of climate stress tests of Norwegian banks.1 Unlike a solvency stress test, as shown in Section 2.2, a climate stress test does not focus on an extraordinary stress event, but instead attempts to analyse the effects of a projected chosen climate policy and shed light on the key risks.
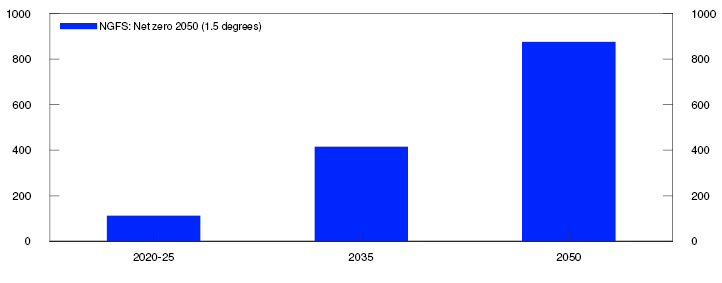
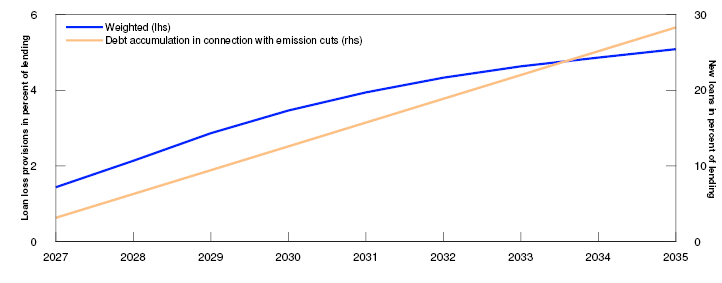
The analysis uses information from the scenarios in the Network for Greening the Financial System (NGFS) to project climate transition and transition consequences.2 Under the Climate Change Act, Norway has committed to becoming a low-emission society in 2050, which means that annual emissions of greenhouse gases must be reduced to about 5% of 1990 levels. The NGFS scenarios indicate that a significant increase in carbon taxes and/or other transition measures are needed to reach the target of net-zero emissions in 2050 (Chart 2.E). The scenario shows that if the zero-emission target is to be reached, the largest cuts must be made in the period to 2035. There are many ways to cut emissions, but most will involve investment. This means that investment growth resulting from climate transition does not necessarily lie far into the future.
Shadow price per tonne of C02 equivalents in USD
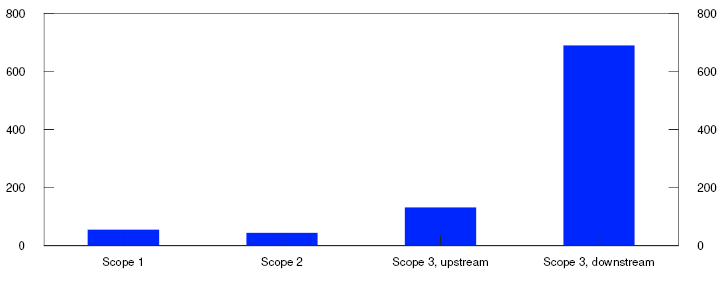
We use information on emissions across a firm’s entire value chain, generally known as “Scopes 1, 2 and 3”. Scope 1 is direct emissions from sources owned or controlled by the reporting entity. Scope 2 is indirect emissions related to the production of electricity and heat used in operations and Scope 3 is indirect emissions from the production of input factors (upstream) and the further use of the product (downstream).4 Due to the substantial emissions from oil and gas combustion, Norway’s Scope 3 emissions are particularly high (Chart 2.F). Information on current emissions taxes is obtained from Statistics Norway and information on costs from emissions cuts in different industries is obtained from the Norwegian Environment Agency.5
Estimates by Menon. Million of tonnes of C02 equivalents
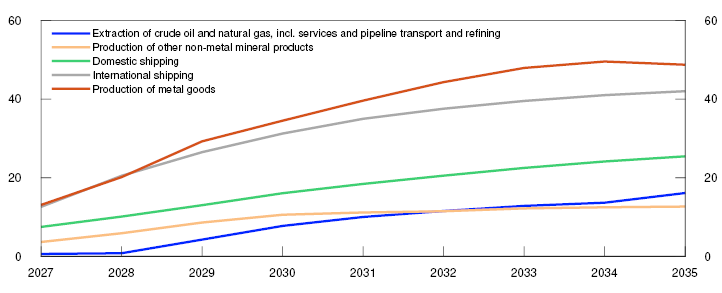
Increased taxes on firms’ emissions and clean-up costs affects both profitability and the value of the firm’s assets. We estimate the increase in expected losses as a result of emission taxes and clean-up costs that firms must pay through the scenario.7 To follow developments through the scenario and to have a target for the overall effect, cumulative loan loss provisions are calculated based on the current portfolio (Chart 2.G). The chart shows that in Norway it is oil and gas, shipping and the processing industry that account for the highest emissions and have the largest cumulative loan loss provisions in the Bank’s analysis. A number of the industries with substantial loan loss provisions are characterised by high emissions but also by fairly small current margins, making them vulnerable to higher costs. Oil and gas industries have very high margins and start to face difficulties as production volumes begin to decline. Note that the Bank’s analysis will underestimate individual industries’ ability to increase prices and continue to operate profitably.
Projection of new cumulated loan loss provisions. Static balance sheet. Recognised losses are not deducted. In percent of lending to the sector
Since these individual industries account for a limited share of banks' loans to Norwegian firms, total loan loss provisions for corporate loans will in any event increase considerably less than implied by the calculations for the most vulnerable individual industries (Chart 2.H). Even if banks had to recognise the entire depreciation over a shorter period than indicated in the scenarios, losses would be considerably lower than during the banking crisis and comparable with the loss episodes observed over the past 25 years. These are losses that banks can readily absorb without triggering a crisis, but bank profitability would be affected for a period. The chart shows how these loss provisions increase at the same time as investment to cut emissions rises through the analysis period. In the period to 2035, financing emission reduction measures will become an increasingly important reason for additional borrowing. If losses occur at the same time as substantial investment needs arise, it may be more difficult for banks to contribute to the financing of such investment.
Projection of new cumulative loan loss provisions and estimates of new loans to cover investment in emission reductions
1 See Grippa, P. and S. Mann (2020) “Climate-Related Stress Testing: Transition Risks in Norway”. Working paper 8. November 2020. IMF, Haug, K.D., L.K. Reiakvam, H. Solheim, L.T. Turtveit and B.H. Vatne (2021) “Climate risk and banks’ loans to firms”. Staff Memo 7/2021. Norges Bank and Finanstilsynet (2021) “Risk Outlook – December 2023”.
9 Period: Projection up to 2035.
Projection of new cumulative loan loss provisions as a consequence of climate-related costs. Banks are assumed to have static balance sheets, and recognised losses are not deducted. Borrowing needs show an increase in emissions clean-up investment, assuming that these are fully debt-financed and depreciated over 10 years. Measured as a percentage of corporate lending by the 10 largest banks in Norway.
2 See the NGFS Scenario Portal for more information, NGFS Scenarios Portal.
3 Projection of the shadow carbon price, measured as USD per tonne of C02 equivalents. Projections are shown for the periods 2020–2025, 2035 and 2050 in a scenario where the world reaches the net zero target in 2050.
4 Menon Economics has compiled, on behalf of Norges Bank, Scope 1-3 emission distribution data by Norwegian firms (documentation in Norwegian only). The distribution of emissions is industry-based, and the share of emissions per firm depends on the size of the firm. The distribution of emissions is industry-based, and the share of emissions per firm depends on the size of the firm.
5 See Langdal (2023): “Husholdninger betaler mest for CO2 utslipp” [Households pay the most for CO2 emissions]. Statistics Norway. (Norwegian only) and “Klimatiltak i Norge: 2023” [Climate action in Norway: 2023]. Norwegian Environment Agency. (Norwegian only).
6 Scope 1 is direct emissions from production. Scope 2 is emissions from electricity and heat production. It is assumed here that emissions correspond to electricity production in the North-European power market. Scope 3 is emissions across the value chain, upstream refers to emissions from production inputs, and downstream refers to emissions from refining operations and the use of products and services that are produced.
7 Firm-level estimates of cost increases and impairment are used to project Norges Bank’s bankruptcy probability model, KOSMO (cf ref Hjelseth, I. and A. Raknerud (2016) “A model of credit risk in the corporate sector based on bankruptcy prediction” Staff Memo 20/2016. Norges Bank). We calculate increases in expected losses due to climate-related spending increases. Together with an estimate of loss given default (LGD) that is affected by climate exposure, an estimate can then be given of expected loss provisions as a result of climate-related adaptation.
8 Period: Projection up to 2035.
New cumulative loan loss provisions as a consequence of climate-related shocks, when there are no write-offs. Measured as a percentage of total corporate lending to the respective sector by the 10 largest banks in Norway.
3. Liquidity and funding
Banks’ liquidity and funding are highly exposed to conditions in the securities markets, where they borrow and invest, and to the supply of deposits. Confidence in banks is crucial to ensure that they have sufficient access to funding. When Norges Bank assesses financial stability risks, scenarios that could threaten confidence must therefore be considered.
Previous loss of confidence and bank run episodes have often been triggered by solvency problems. But liquidity stress can also arise among solvent banks. Cyberattacks are a continuous threat to financial stability, and it is conceivable that a severe cyberattack could weaken confidence in banks. Such a scenario therefore forms the basis for the liquidity stress test in this Report.
3.1 Confidence in banks is fundamental to deposit stability – cyberattacks may result in loss of confidence
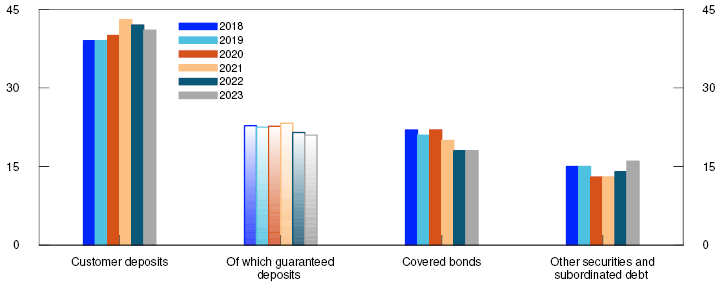
Customer deposits are the most important funding source for Norwegian banks (Chart 3.1). Through the pandemic, customer deposits at Norwegian banks rose significantly, and reduced banks’ wholesale funding needs (see Staff Memo 10/2022). Customer deposits now account for 41% of total bank funding. This is below the average for European banks of around 60%, but more in line with the other Nordic countries. Banks with a high share of deposit funding can be hit hard by a deposit run. On the other hand, banks with a high share of deposits, and hence a low wholesale funding ratio, will be less affected by financial market turbulence.
Selected sources of funding as share of total funding. Percent
Source: Norges Bank
If confidence in banks is impaired, deposits may be rapidly withdrawn, and banks may face liquidity problems. In spring 2023, many customers withdrew deposits from certain US banks over a very short period. Specific business models and poor risk management, as well as weak regulation and supervision, were important reasons for solvency problems at these banks. This led to customers fearing the loss of their deposits, and confidence collapsed. A high degree of digitalisation meant that deposits could quickly be transferred to other banks. The turbulence also illustrated how social media can contribute to the rapid spread of uncertainty.
A cyberattack could lead to deposits becoming unavailable and customers losing confidence in banks
A cyberattack could lead to customers losing access or having unstable access to their deposits, for example if online and mobile banking and payment services fail to function. This could undermine confidence in deposits being available in future. As a precaution, customers may then decide to transfer their deposits to another bank once access is restored. The uncertainty following a cyberattack could heighten if customers also fear that deposits have been stolen or that unaffected banks will be impacted. IMF analyses show that US banks hit by less severe cyberattacks experienced moderate withdrawals of deposits in the following quarters.2 This illustrates that cyberattacks can impact banks’ liquidity. Duffie and Younger (2019) argue that severe cyberattacks could lead to rapid and large deposit withdrawals.3
With a high degree of digitalisation, customers are used to having a full overview of their accounts and full access to their deposits around the clock. A lack of access to banking services would therefore be noticed quickly. No fewer than 96% of Norwegians use digital banking services.4 In addition, Norway is among the countries where bank customers use cards for payments most frequently5, and many do not use cash. Customers may therefore react more quickly to problems with access to banking services.
Norwegian retail and wholesale customers tend to have accounts at more than one bank, and it is easy to open an account at a new bank, especially for retail customers. This means that most people can quickly transfer their deposits to another bank. Usually, it only takes a few days for a firm to open an account at a new bank, depending on how complex the business is and what checks the bank needs to make under the anti-money laundering rules. There may be slightly more restrictions on how easily firms can transfer operating accounts tied to other related systems in the firm, but they can quickly transfer surplus funds to another bank.
The Norwegian deposit guarantee scheme covers up to NOK 2m per depositor per bank,6 and these deposits are normally considered to be a stable source of funding for banks. Overall, around half of customer deposits at Norwegian banks are covered, which is slightly less than at the end of 2019 (Chart 3.1).
The guarantee scheme provides solid insurance against loss of deposits, which promotes confidence. The scheme is designed for situations when a bank is liquidated under public administration7, and the guarantee will therefore not be triggered by liquidity problems due exclusively to operational failures. In a scenario where a loss of confidence stems from uncertainty about the availability of deposits following a cyberattack, it is therefore possible that banks’ customers will also want to transfer insured deposits to ensure continued access to their funds.8
Contingency arrangements, risk management and liquidity reserves can mitigate the consequences of a cyberattack
To date, there have been no cyberattacks with serious consequences for Norwegian banks. The banks work continuously to maintain and enhance their cyber defences, and most attacks are averted before they impact banks’ customers.9
Besides banks’ work on their own cyber security and contingency planning, measures at sector level may also limit the consequences of a cyberattack.10 For example, the Norwegian financial sector has worked together on contingency arrangements for cards and payment terminals that reduce the likelihood of customers completely losing the ability to pay for goods and services. The deposit guarantee scheme ensures that customers do not lose deposits up to NOK 2m, even though they may be unavailable for a period. Households’ own contingency planning is also important. Norges Bank has previously noted that customers who have funds at multiple banks or some cash available will still have payment options if their deposits at one particular bank become unavailable.
Banks are unique in that they are the only financial institutions that accept retail and wholesale deposits. Liquidity risk is part of banks’ business model and their role in the financial system. The risk arises because deposits are usually available instantly or at short notice, whereas lending generally has a long maturity. If there is a run on deposits, banks will need to replace the deposits withdrawn before loans are repaid, which means that they face a refinancing risk.
Banks reduce liquidity risk through proper risk management. For example, they can source deposits from many different categories of depositors, raise wholesale funding with long maturities and hold liquidity reserves. Banks’ liquidity risk is also reduced by liquidity requirements. Under the Liquidity Coverage Ratio (LCR) requirement, banks must hold sufficient liquid assets to meet their liquidity needs for a hypothetical 30-day period of deposit withdrawals and financial market stress. The LCR rules require banks to hold more liquid assets if a large share of their funding consists of deposits that are not considered stable or of short-term wholesale funding.
The Net Stable Funding Ratio (NSFR) requirement aims to ensure that banks fund less liquid assets, such as loans, with stable funding rather than volatile deposits and short-term loans. This reduces the likelihood that banks’ will need to roll over their funding frequently, and thus the need for large liquidity reserves. Norwegian banks exceed both the LCR and NSFR requirements by an ample margin. This may mitigate the consequences of a cyberattack, as liquidity problems will be reduced and will not to the same extent be amplified and spill over to the rest of the financial system.
The liquidity stress test
Norges Bank’s role and responsibilities in supplying liquidity to the banking system and individual banks requires insight into banks’ liquidity situation and financial market conditions. The purpose of the liquidity stress test is to assess banks’ resilience to a loss of funding and to identify vulnerabilities that could result in liquidity problems in different scenarios.
The liquidity stress test is used as a framework for assessing how a cyberattack might affect banks’ funding. The purpose is not to calculate precise outcomes but rather to inform discussions and assessments of banks’ liquidity and funding using scenarios or sensitivity analyses. The model is designed to capture characteristics of bank deposits and the financial system in Norway that may be significant for deposit stability in the event of a broad-based lack of confidence in banks.
The liquidity stress test model assesses individual banks’ liquidity and funding situation in hypothetical scenarios over various time horizons. Data is used that banks already report to the authorities, mainly in the form of additional liquidity monitoring metrics (ALMM) and the LCR.1 The model is a cash flow analysis of inflows and outflows related to assets, liabilities and off-balance-sheet items over a period of two months.
The banks’ survival horizon is estimated based on an initial liquidity reserve as in the LCR. Cash flows are estimated using assumptions about the behaviour of the bank itself, customers, other banks and other market participants in a stress situation. The assumptions are based on existing literature in the field, historical data, stress factors in the LCR calculations and qualitative assessments. The estimated cash flows indicate the bank’s short-term funding needs. The value of the liquidity reserve is reduced correspondingly as in the LCR. The stress test can both overestimate and underestimate liquidity need.
1 Additional Liquidity Monitoring Metrics (ALMM) and Liquidity Coverage Ratio (LCR) are part of the reporting requirements for Norwegian banks by virtue of CRR/CRD IV.
The large banks are well-equipped to cope with bank runs resulting from a cyberattack, but the results are uncertain
In the liquidity stress test, a scenario is assumed where an advanced threat actor executes a cyberattack against a provider of core banking systems and payment services to a number of Norwegian banks. One consequence is that bank customers largely lose access to online and mobile banking, ATMs, Vipps and card payments for an entire week. In this scenario, the uncertainty is amplified by customer account balances that do not match pre-attack levels.
How customers and creditors would react to a severe and protracted cyber incident in the financial system is uncertain. Neither in Norway nor abroad have cyber incidents yet resulted in a broad-based lack of confidence and liquidity problems at banks. There is therefore little information on which to base an assessment of the systemic liquidity effects of cyberattacks. Given developments in the threat landscape, it is nevertheless important to assess the significance of cyberattacks for banks’ liquidity risk.
In the scenario, it is assumed that customers’ confidence in the affected banks weakens, and that some choose to transfer their deposits to other banks. We test the largest Norwegian banks individually and make no assumptions about where deposits are transferred. In the scenario, it is assumed that all deposit transactions are suspended for the first week, and that customers can only transfer their deposits once the bank has restored its systems.
Different outflows for different categories of deposits are assumed (Table 3.1). Consideration is given to the composition of different types of deposits in the individual banks, which are therefore affected differently. We assume that 15% of customer deposits are withdrawn in week 1, about 7% in week 2, and a declining share out to two months. This gives a weighted deposit outflow of around 30% over a four-week period for the seven largest Norwegian banks, and up to 40% after two months. Other funding is assumed to be affected largely the same as in the LCR scenario. No other adjustments or actions by the central bank or other authorities are assumed. The results indicate that most banks have sufficient liquidity reserves to cover net payments for at least four weeks (Chart 3.2).
Table 3.1 Assumptions about deposit outflow. Percentage
|
30-day withdrawal factor11 |
Cyberscenario FSR 2024 H1 |
In the liquidity regulation (LCR) |
|---|---|---|
|
Retail/SME – Guaranteed deposits |
20 |
5 |
|
Retail/SME – Non-guaranteed |
33–50 |
10–16 |
|
Large firms – Operational deposits |
15–40 |
5–25 |
|
Large firms – Guaranteed |
40 |
20 |
|
Large firms – Non-guaranteed |
50 |
40 |
The number of banks with positive liquidity reserves after a deposit run owing to a severe hypothetical cyberattack
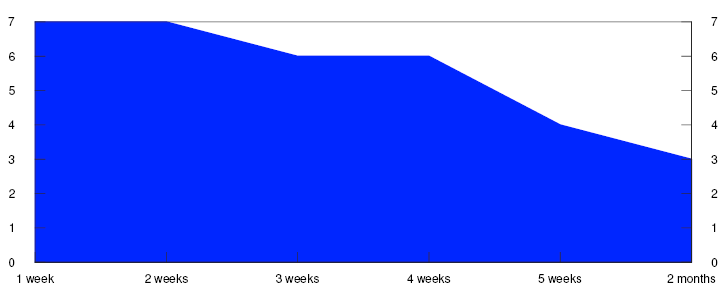
Difficult to foresee how a future bank run might unfold
Sensitivity analyses are useful because information on how a cyberattack would impact deposit funding is limited. We look at the magnitude of a run on deposits that would lead to a depletion of banks’ liquidity reserves, even though in reality they would encounter challenges earlier. Stress in funding markets and the fall in the value of the liquidity reserve is assumed to be in line with the LCR. The results show that the largest banks can withstand deposit withdrawals of around 40% of deposits (Chart 3.3). This is a liquidity stress that far exceeds what is required under the LCR rules where a weighted deposit outflow for the seven largest banks is around 20%. There are differences in the outflows that each of the large banks can cope with, largely reflecting differences in their business models, their deposit compositions and the degree to which they exceed the LCR requirement.
It is difficult to compare different bank run episodes, partly because of differences between triggering factors, regulatory regimes, deposit guarantee schemes and actions by the authorities. Deposit runs from banks that had problems during the US banking turmoil in the spring of 2023 and the global financial crisis of 2007 and 200813 were generally below the levels that Norwegian banks have sufficient liquidity reserves to deal with, as indicated in Norges Bank’s analysis. How a future bank run will pan out is difficult to predict but Norwegian banks can cope with large deposit withdrawals (Chart 3.3).
Magnitude and speed of previous episodes and resilience of the largest Norwegian banks (green line) given different durations
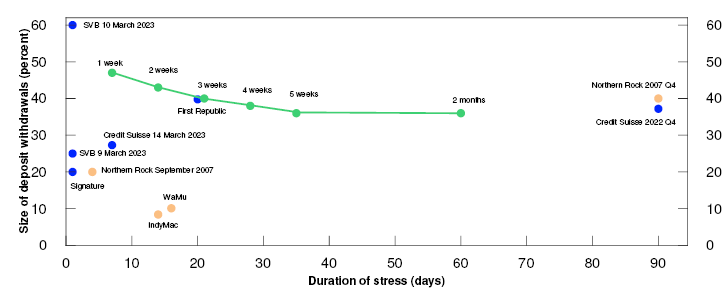
Banks’ contribution to maturity transformation is an efficiency gain for the financial system (see Norway’s Financial System 2023). At the same time this exposes banks to liquidity risk. The resilience of the banks is nevertheless important for preserving financial stability in the event of a bank run. This is ensured by banks’ sound risk management and by liquidity rules limiting how much liquidity risk banks may take. Norges Bank will have a role to play if problems in the banking system pose a threat to financial stability.15 Norges Bank could then provide extraordinary liquidity to the banking system as a whole or to individual banks.16 This option of supplying extraordinary liquidity means that Norges Bank can help prevent financial problems from spreading and then escalating into major crises. However, it is first and foremost banks’ responsibility to manage their liquidity risk. The IMF also stresses the importance of including cyberattacks as a source of liquidity stress in banks’ risk assessments.17
1 All Norwegian banks and covered bond mortgage companies.
Shaded bars indicate that guaranteed deposits are a subcategory of customer deposits.
2 See IMF (2024) “Global Financial Stability Report – April 2024”.
3 Duffie, D. and J. Younger (2019). “Cyber runs”. Hutchins Center Working Papers, 51, Brookings Institution.
5 Average is 1.3 times per day, see Norges Bank (2023) “Retail Payment Services 2022”, Norges Bank Papers 1/2023.
6 In addition, deposits resulting from specific life events are covered in full for 12 months from receipt. More information on the deposit guarantee can be found on the Norwegian Banks’ Guarantee Fund website.
7 Guaranteed deposits are to be made available within seven working days of the Ministry of Finance deciding to close the bank.
8 See European Banking Authority (2019) “Opinion of the European Banking Authority on deposit guarantee scheme payouts”. EBA, October 2019 and European Systemic Risk Board (2023) “Advancing macroprudential tools for cyber resilience”. ESRB, February 2023.
9 See Finanstilsynet (2024) “Risiko- og sårbarhetsanalyse (ROS) 2024” [Risk and vulnerability analysis (ROS) 2024] (in Norwegian only, forthcoming in English).
10 Norges Bank’ annual Financial Infrastructure Report provides an overview of contingency work at the individual system level, sector level and across sectors.
11 Assumptions about percentage withdrawals of different deposit categories.
12 The chart illustrates the number of banks with remaining liquidity reserves in the event of a severe cyberattack that leads to a loss of confidence and an assumed deposit run episode, cf Table 3.1. Financial market stress in line with LCR is also assumed. For the 7 largest Norwegian-owned banking groups.
13 See IMF (2023) “Global Financial Stability Report – October 2023” p. 77 for a description of the severity of earlier deposit runs.
14 Estimated resilience (weighted average) of the 7 largest Norwegian-owned banking groups based on the deposit withdrawals they can absorb before liquidity reserves are negative, given different durations. Resilience is estimated after net cash outflows other than from deposit run. Wholesale funding is not renewed and haircuts are applied to the value of the liquidity reserves using the same factors as in the LCR rules. Previous episodes of deposit runs are marked using orange dots (the global financial crisis) and blue dots (banking sector turmoil in spring 2023).
15 See European Systemic Risk Board (2023) “Advancing macroprudential tools for cyber resilience”. ESRB, February 2023 for a discussion of how central bank liquidity can limit the systemic effects of cyber incidents.
16 See Norges Bank for more information – Lender of last resort (emergency liquidity assistance).
17 See IMF (2024) “Global Financial Stability Report – April 2024”.
3.2 Fire sales may contribute to market turmoil
Fire sales by banks and other financial institutions may lead to falling prices for securities and market turmoil. Banks are large investors in bond markets, especially because they hold securities as part of their liquidity reserves. Life insurers, pension funds and mutual funds, referred to here collectively as asset managers, are large investors in both equity and bond markets and are therefore important for funding risk for banks and other economic agents.
Banks’ large covered bond holdings may affect market liquidity in a crisis
Banks hold securities as part of their liquidity reserves which can be sold or pledged if they have difficulties sourcing new funding. Preserving the value of liquidity reserves is therefore important for banks’ survival horizon. Covered bonds make up more than half of Norwegian banks’ liquidity reserves (Chart 3.4). This high concentration of covered bonds is an almost exclusively Norwegian phenomenon which results from the relatively small size of the government bond market in Norway.18 Covered bonds generally have the highest credit rating. The credit risk is linked to the Norwegian housing market, as they are largely secured against residential mortgages. Calculations show that house prices would need to fall significantly for the value of the collateral to drop below the nominal value of the bonds, see Financial Stability Report 2022.
Liquidity portfolio in NOK by type of assets. Norwegian banks. Value after haircut. Percent
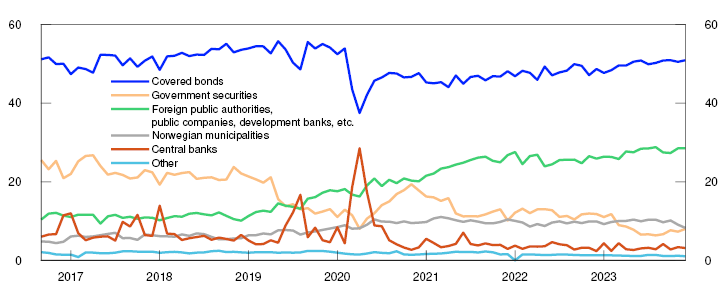
Liquid markets are also important if banks’ liquidity reserves are to retain their value in a crisis. Norges Bank’s market liquidity survey indicates that market participants regard the covered bond market as the most liquid segment of the Norwegian bond market. However, liquidity in normal times and liquidity in periods of market turmoil can differ considerably.
Banks are the largest investors in covered bonds, holding more than 60% of outstanding covered bonds issued in NOK (Chart 3.5). In a severe crisis, with a loss of confidence in banks and major fire sales by banks, liquidity in the covered bond market may dry up and the value of covered bonds may fall sharply. This will reduce the value of banks’ liquidity reserves, and it may be harder for banks to source funding in the covered bond market. This in turn may lead to further liquidity and funding problems.
Ownership breakdown of bonds issued by mortgage companies. Percent
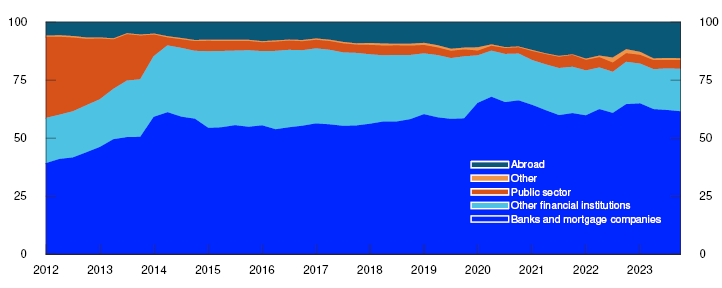
Banks’ holdings in the covered bond market have increased over the past 15 years, partly as a result of the introduction of the LCR requirement. The LCR rules require liquid assets in the liquidity reserves to be sufficiently diversified, and Finanstilsynet (Financial Supervisory Authority of Norway) has recommended that covered bonds secured against Norwegian property should not make up more than half of banks’ liquidity reserves. Covered bonds issued in NOK currently make up a little more than 50% of Norwegian banks’ total liquidity reserves. This recommendation may contribute to banks’ holdings in the Norwegian covered bond market not increasing in the future. Some banks will probably replace parts of their liquidity reserves with other securities to move below 50%. It is important for banks to ensure that the securities replacing covered bonds can be readily sold or pledged in a crisis.
Deposit run on multiple banks could trigger fire sales of covered bonds
A deposit run on multiple banks may have significant implications for securities markets. Investor unrest may set in, and fire sales could be triggered if multiple banks need to sell covered bonds from their liquidity reserves simultaneously. If several of the largest banks need to offload covered bonds to meet their liquidity needs, this could extend to as much as 20% of the covered bond market. In such a situation, it will be more difficult for banks to source new funding in the covered bond market.
How far Norwegian covered bonds might drop in value in the event of simultaneous fire sales by multiple banks is difficult to predict. There has never been a fire sale by banks in the Norwegian covered bond market, and we do not know how banks and other market participants would adapt in such a scenario. Nor can experience from other countries be drawn on as similar links between liquidity reserves and bank funding are uncommon. There have, however, been a number of episodes of fire sales of securities by other financial institutions that have had significant effects on market pricing (see box on "What can trigger fire sales?"). The fact that banks have a large share of covered bonds in their liquidity reserves and are major investors in the covered bond market is considered a vulnerability (see Section 1).
What can trigger fire sales?
Uncertainty about an issuer or sudden changes in the value of derivatives, can lead to large numbers of investors wanting to sell certain securities simultaneously. Fire sale means that a seller is forced to sell quickly at a bad price for the seller.
Mutual funds generally have rules entitling customers to redeem their units the same day. If sufficient numbers want to redeem simultaneously, the managers will have to sell assets quickly to raise the necessary cash. If these sales take place in periods of low market liquidity, they will push prices down and encourage even more customers to redeem. In some cases, mass redemptions can lead to Finanstilsynet (Financial Supervisory Authority of Norway) temporarily suspending redemption rights.
There are also examples of the use of derivatives leading to fire sales, as the losing party on a derivatives contract often quickly needs to provide margin (collateral) for counterparty risk to the gaining party. If the margin required consists of bank deposits, the party needing to provide it may have to obtain liquidity by selling securities from its liquidity reserves. In autumn 2022, British government bond prices plummeted, and yields surged in the UK as a result of deep uncertainty about government finances in the coming years. Many pension funds had hedged their positions using interest-rate derivatives, and the increase in long-term yields meant that they had to provide additional margin for counterparty risk under these contracts. To obtain this collateral, they sold government bonds, leading to a further decrease in the value of such bonds.
Another example is the sharp decline in securities prices and the NOK depreciation in spring 2020. Norwegian asset managers hedge the krone value of a large part of their foreign assets, and the derivative contracts require positioning of margins. This reduces the risk of insolvency (counterparty risk) spreading through the network of derivatives contracts. On the other hand, the daily margin requirement presents a liquidity risk. When the krone weakens, asset managers make losses on these contracts and need to provide margin for counterparty risk. In spring 2020, the krone depreciated by around 20% in a very short period, leading to a need to raise funds rapidly to meet margin calls. Many sold securities to obtain these funds, which contributed to a drop in bond values.1 In addition, the hedging ratio for foreign investments was reduced owing to the steep fall in global equity markets. This was achieved by selling NOK and buying foreign currency, which contributed in turn to a further krone depreciation and further margin calls.
1 See Alstadheim. R., Nordal, K.B., Syrstad, O., Ellen, S.T. and Wassas, M.I.W. (2021) “Bond market fire sales and turbulence in the Norwegian FX market in March 2020”. Staff Memo 2/2021. Norges Bank.
Asset managers have improved their liquidity management
Fire sales by asset managers can also lead to lower prices for securities and amplify market turmoil. As they are major investors in both equity and bond markets, simultaneous sell-offs can increase the risk premium and raise funding costs when economic agents need to raise new financing.
The episode from the pandemic in 2020 highlighted the liquidity risk associated with asset managers’ currency hedging contracts and how this can contribute to market turmoil (see box on "What can trigger fire sales?"). Information on the use of currency hedging and potential losses is important for assessing the risk of new fire sales. To monitor the extent of currency hedging among asset managers, Norges Bank has asked the largest mutual fund managers to report on their hedging to NOK. These firms manage more than 90% of total assets under management as stated by the Norwegian Fund and Asset Management Association (VFF). Reporting is quarterly and started with 2023 Q4.
At end-2023, investments in foreign currency equivalent to just over NOK 600bn had been hedged against movements in the krone (Chart 3.6). Around half of these hedges were for investments in assets denominated in USD, and the remainder for investments in EUR and other foreign currencies. Asset managers' counterparties in hedges are normally large Nordic and international banks. If the value of these hedged investments falls, and the managers want to reduce the hedging ratio, this is done by selling NOK and buying foreign currency. High levels of currency hedging therefore bring a risk of selling pressure on the krone if there is a sharp fall in global equity and bond markets.
Chart 3.6 Currency hedging increases the need for collateral in the event of NOK depreciation21
Currency hedged amounts and increased collateral in the event of a 20 percent NOK depreciation. 2023 Q4. In billions of NOK
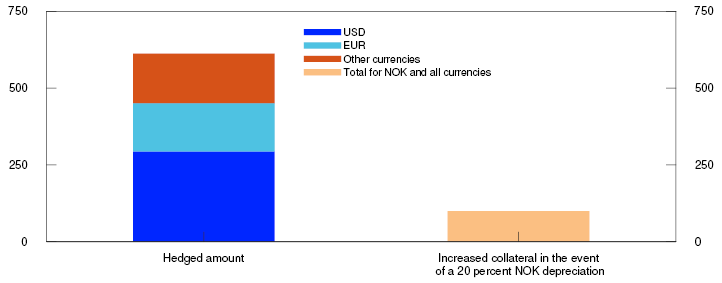
Given a hypothetical immediate decline in the krone exchange rate of 20% against all currencies, the managers reported that the need for collateral would increase by around NOK 100bn. The figures reported are for the managers’ total hedging and not just hedging for mutual funds. They also manage sizeable assets under other mandates, for example from life insurers.
Asset managers have several options when choosing what to provide as collateral. Cash, both in NOK and in foreign currency, may be used. The majority of asset managers also have agreements on providing securities as collateral. Cash collateral in NOK amounts to around NOK 60bn and can be raised by using cash holdings, through repurchase agreements (repos) or by selling securities.
The reported figures show the high extent of currency hedging and the adjustments made by asset managers since 2020 to improve liquidity management. Arrangements have been made for increased use of repurchase agreements, and hedging agreements allow securities to serve as collateral for counterparty exposures to a greater extent.
18 Danish banks also have a high concentration of covered bonds in their liquidity reserves.
21 The figures are reported by a sample of mutual fund management firms. Increased collateral is the reporting entities’ overall estimate of higher variation margin requirements in the event of an immediate 20% depreciation of the krone against all currencies on the reporting date.
19 Period: September 2016 – December 2023.
20 Period: 2012 Q1 – 2023 Q4.
Face value of bond holdings. The holdings also include bonds issued by mortgage companies other than covered bond mortgage companies. Table 09445.
Annex
Important regulations and measures
Table 1 Important regulations and measures in Norway's financial system
|
Category |
Instrument |
First introduced |
Current level |
|---|---|---|---|
|
Deposit guarantee scheme |
Guarantee of retail and commercial deposits in Norwegian banks1 |
1996 |
NOK 2m per depositor per bank2 |
|
Credit standards requirements for mortgages and other secured loans3 |
Tolerate higher interest rate (stress test) on total debt |
20154 |
A 7% interest rate or a 3 percentage point interest rate increase, whichever is higher |
|
Maximum loan-to-value (LTV) ratio |
20154 |
85%. Additional collateral is permitted |
|
|
Principal repayment requirement |
20154 |
2.5% a year with LTV above 60% or as a 30-year amortising loan |
|
|
Maximum debt-to-income (DTI) ratio |
2017 |
5 times gross income |
|
|
Flexibility quota5 |
2015 |
10% (8% for loans secured on dwellings in Oslo) |
|
|
Credit standards requirements for consumer credit6 |
Tolerate higher interest rate (stress test) |
20194 |
A 7% interest rate or a 3 percentage point interest rate increase, whichever is higher |
|
Principal repayment requirement |
20194 |
Monthly principal repayment, maximum term 5 years |
|
|
Maximum debt-to-income (DTI) ratio |
20194 |
5 times gross income |
|
|
Flexibility quota5 |
2019 |
5% |
|
|
Risk-based capital requirements7 (share of risk-weighted assets)8 |
Pillar 1 Minimum CET1 requirement |
20139 |
4.5% |
|
Pillar 1 Minimum Tier 1 requirement |
199110 |
6% |
|
|
Pillar 1 Minimum regulatory capital |
1991 |
8% |
|
|
Pillar 1 Combined buffer requirements: |
|||
|
Capital conservation buffer |
2013 |
2.5% |
|
|
Systemic risk buffer |
2013 |
4.5% |
|
|
Buffer for systemically important financial institutions (SIFIs) |
2015 |
1% for Kommunalbanken AS and Nordea Eiendomskreditt AS, and 2% for DNB ASA11 |
|
|
Countercyclical capital buffer |
2015 |
2.5% |
|
|
Pillar 2 requirements |
2007 |
Varies across banks |
|
|
Risk weighting for risk-based capital requirements |
Minimum requirement for loss given default (LGD) in IRB banks’ mortgage models |
2014 |
20% |
|
Calibration requirement for IRB banks’ mortgage models for PD and LGD |
2015 |
||
|
Floor for average risk weights for residential mortgages |
2020 |
20% |
|
|
Floor for average risk weights for CRE mortgages |
2020 |
35% |
|
|
Leverage-based capital requirements7 (share of exposure measure) |
Leverage ratio |
2017 |
3% minimum requirement |
|
Liquidity requirements |
Liquidity Coverage Ratio (LCR) |
201512 |
100% |
|
LCR in individual currencies |
2017 |
100% |
|
|
LCR in NOK |
2017 |
50% (for banks with EUR/USD as significant currencies) |
|
|
Net Stable Funding Ratio (NSFR) |
2022 |
100% |
|
|
Minimum requirement for own funds and eligible liabilities (MREL)13 |
Loss absorption amount |
2019 |
Minimum requirement for regulatory capital + Pillar 2 requirements + combined buffer requirements14 |
|
Amount necessary for recapitalisation15 |
2019 |
Minimum requirement for regulatory capital + Pillar 2 requirements + combined buffer requirements excluding countercyclical capital buffer requirement |
|
|
Total MREL |
2022 |
Total MREL is described on page 39 of Financial Stability Report 2021 |
|
|
Subordinated MREL |
2022 |
Subordinated MREL is described on page 38 of Financial Stability Report 2021 |
|
|
Testing of financial sector cyber resilience |
TIBER-NO16 |
2022 |
Guidance for threat-based testing of financial sector cyber resilience. |
1 For deposits in Norwegian banks’ foreign branches, a limit of EUR 100 000 applies.
2 Additional amounts deposited in the course of the previous 12 months following a particular life event, such as a home sale or insurance payout, are also covered. The guarantee does not cover deposits from credit or financial institutions or from public authorities.
3 From 1 July 2023, loans secured on collateral other than a dwelling, such as car and boat loans, will be covered by the regulation’s general DTI and debt-servicing capacity requirements.
4 Prior to being laid down in a regulation, the requirements were issued as guidelines, for residential mortgage loans in 2010 and for consumer credit in 2017.
5 Up to a certain percentage of the total value of new mortgage loans/consumer credit granted by banks each quarter may be loans in breach of one or more of the requirements. A separate flexibility quota for Oslo was introduced in 2017. A separate flexibility quota of 10% for loans secured on collateral other than housing was introduced in 2023.
6 Exemption for credit cards with credit limits below NOK 25 000 and exemption for loan refinancing as long as the value of the refinanced loan (and new loan costs) does not exceed the value of the existing loan (and previous loan costs).
7 See explanation of capital requirements in Norway’s financial system 2023, pp 112–121.
8 Risk-weighted assets. A number of regulations have been introduced for banks’ calculation of risk weights, especially for residential mortgage loans.
9 From 2002, hybrid capital could account for up to 15% of Tier 1 capital.
10 In 2013, the minimum requirement increased from 4% to 6% when CRR/CRD IV were implemented in the Norwegian rules.
11 The 1% also applies to Sparebank 1 SR-Bank ASA from 30 September 2024.
12 Applied to systemically important financial institutions from 2015 but was phased in for other firms in the course of 2017.
13 Liabilities eligible for MREL must be lower in priority than senior debt. However, before 1 January 2024, ordinary senior bonds issued before 1 January 2020 may also be used to satisfy MREL.
14 The loss absorption amount requirement is the larger of the leverage-based Tier 1 capital requirements and total risk-based capital requirement (minimum requirement, Pillar 2 requirements and buffer requirements). In Norway, the risk-based requirement is the more binding.
15 Applies only to banks subject to resolution and not liquidation under public administration.
16 TIBER-NO is the Norwegian implementation of TIBER-EU, which applies in the EU.
Sources: Finanstilsynet (Financial Supervisory Authority of Norway), Ministry of Finance, Norwegian Banks’ Guarantee Fund and Norges Bank.