What the US Treasury yield curve is (not) telling us
The US Treasury yield curve has flattened relentlessly over the last couple of years. Hence, market participants and policy makers have for some time been focusing on the prospects of yield curve inversion – historically a reliable signal of recessions. However, market participants and policy makers seem divided on what conclusions should be drawn from the curve’s signaling power. On the one hand are those who point to a reliable historical regularity that an inverted curve tends to precede recessions. On the other hand are those arguing that this time is different. I will in the following argue that the latter camp provides the most compelling arguments for why a flat or inverted yield curve does not necessarily indicate elevated recession risk in the US.
The yield curve tends to flatten in a hiking cycle…
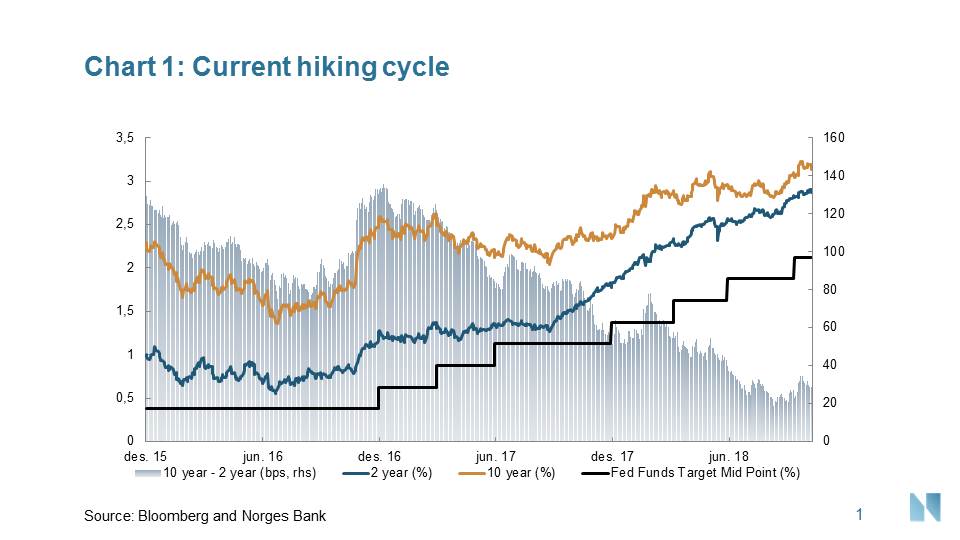
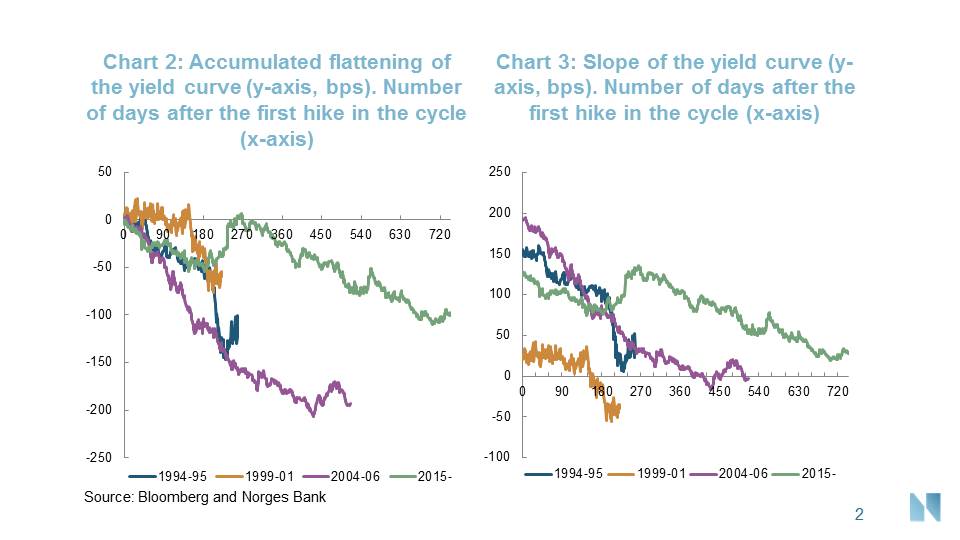
As evident in chart 1, the yield curve, from here on defined as the differential in yield between a 10-year and a 2-year US Treasury security, has flattened in this hiking cycle as short-term rates have risen more than long-term rates. As chart 2 shows, the yield curve also flattened in the previous hiking cycles. As a matter of fact, the flattening was more pronounced in the 1994-95 and the 2004-06 cycles. This is in part related to the fact that the slope of the yield curve was sitting at higher levels going into those two cycles, see chart 3. In addition, the monetary policy normalization has been more gradual this time around, resulting in a more benign increase in short-term rates than in the two mentioned previous cycles. Nevertheless, the flattening of the yield curve in all the three preceding hiking cycles goes to show that there’s nothing extraordinary with the flattening this time around. However, given that long-term rates are still relatively low in a historical context and the rise in long-term yields have been relatively benign in this cycle, the behavior of long-term rates warrants further examination.
… and a lower neutral rate points to a flatter yield curve.
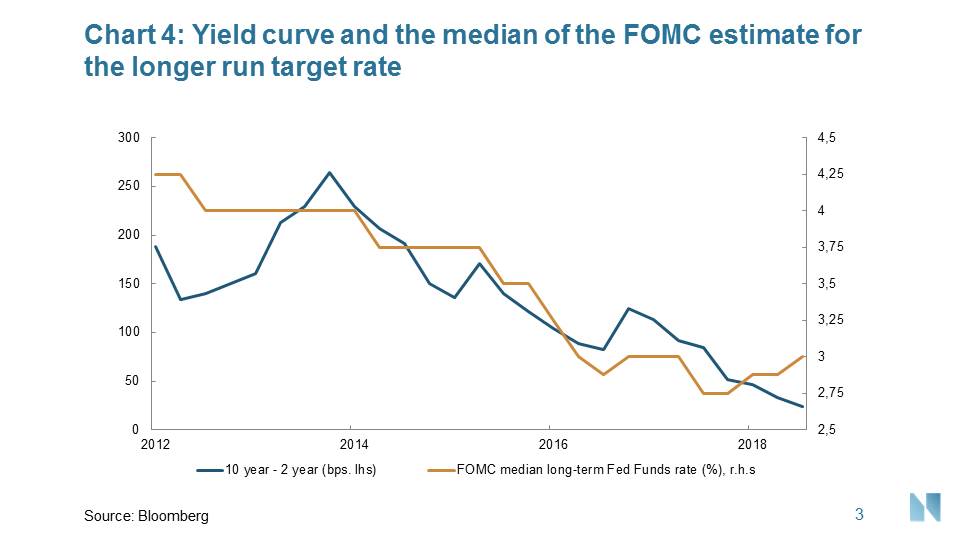
The estimated neutral level of interest rates is an important concept when considering long-term rates and the slope of the yield curve. One way to view the neutral rate is to think of it as the level of interest rates that is neither accommodative nor contractionary, i.e. a level consistent with a closed output gap. There is, due to several reasons, common understanding that this rate is lower than what was the case prior to the crisis. Indeed, as evident in chart 4, the median FOMC estimate for the funds rate over the long run has fallen dramatically over the last years, in tandem with a flatter yield curve. In other words, it’s the view of the FOMC that fundamentals dictate a shallower path for policy normalization this time around. With the zero lower bound acting as a floor for short-term rates, a lower neutral rate should be expected to flatten the yield curve in a hiking cycle as it limits the extent to which long-term yields can rise from a fundamental point of view. Hence, there are valid arguments for why this time is different and that the slope of the yield curve should be flatter in this hiking cycle compared to the past.
But fundamentals cannot fully explain the flattening…
However, economic fundamentals and a lower neutral rate cannot fully explain the pronounced flattening of the yield curve. Unfortunately, for a simple fixed income portfolio manager as myself, the world of interest rates is far more complex than what can be explained by economic fundamentals and the expectation hypothesis alone. According to this hypothesis, long-term rates are determined solely by expected future short-term rates. However, the term structure of interest rates is also affected by a time-varying term premium, defined as deviation from the expectation hypothesis. When gauging whether the bond market signals a downturn or not, one must take the term premium into account. Put differently, ten-year yields may not necessarily reflect the average expected path for short-term rates over the next ten years. In fact, low or negative term premia might imply that long-term yields underestimate market participants’ expectations for future monetary policy normalization. For the record, keep in mind that term premium is a theoretical concept and therefore not explicitly perceivable in market prices. It must therefore be estimated and henceforth treated with wide confidence bands. However, even though different models produce different estimates of the specific level, most estimates agree on the dynamics, trends and the broader direction of the term premium. Nevertheless, as I will touch upon in the following, there are both structural and cyclical arguments for why the level of the term premium should be compressed in the current environment.
… implying lower term premia and a persistent drag from quantitative easing…
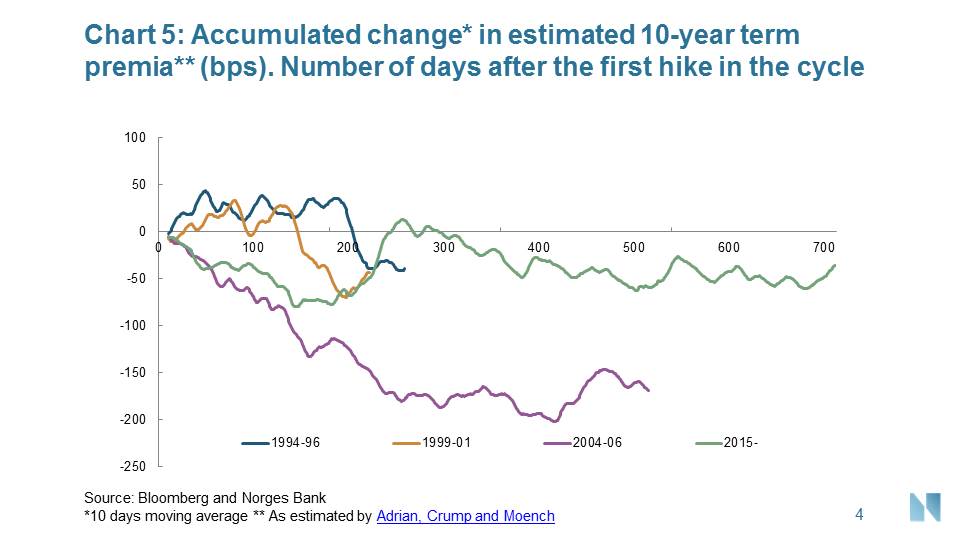
First of all, the term premium tends to fall in hiking cycles due to reduced inflation risk premium. The textbook explanation is that bond investors usually demand some sort of compensation for investing in longer-term bonds rather than bonds with a shorter maturity profile. This is because, after all, tomorrow is more uncertain than today. Hence the textbook explanation for an upward sloping term premium structure in fixed income instruments. From a risk-averse (nominal) bond investor’s point of view, the uncertainty regarding future inflation is obviously of high importance. Now, as the Fed tightens its monetary policy stance, the probability of a higher inflation outcome should, all else equal, recede. Hence, the inflation risk premium should fall as the stance of monetary policy gets less accommodative. In fact, and as evident in chart 5, there tends to be downward pressure on the term premium in hiking cycles.
While there is nothing extraordinary with a falling term premium in a hiking cycle, there are other factors at work helping to compress the estimated level of the term premium on a more structural basis. As most developed central banks have moved towards a monetary policy regime with flexible inflation targeting, the expected volatility of inflation has declined as expectations for the future path of inflation has become more anchored. One could therefore argue that the level of term premium is structurally lower now than what was the case prior to flexible inflation targeting regime became mainstream among developed central banks.
Furthermore, there is irrefutable evidence that the unconventional monetary policy conducted by several major central banks over the last decade has affected the level of long-term yields and thus contributed to the flattening of the yield curve. However, scholars argue on the transmission mechanism of quantitative easing (QE). On the one hand, there are those that argue that QE first and foremost affects long-term yields through the expectations channel, i.e. pushing down long-term yields by primarily affecting the expectations for the trajectory of future conventional monetary policy. On the other hand are those who argue that QE primarily works through the portfolio rebalancing channel, i.e. putting downward pressure on long-term yields through compressing the term premium. If you belong to the former camp, one could argue that unwinding QE need not have a material impact on the shape of the yield curve if exit strategies are thoroughly communicated. If you belong to the latter camp, one could argue that the effects on the term premium on long-term yields should abate or even reverse going forward as several central banks have stopped expanding their balance sheet, and in some cases, started to shrink it. However, even though the flow effect of QE should no longer be supportive of compressed term premia, there are mounting evidence that the stock effect should. So, regardless of which camp you’re routing for, there are compelling arguments that even though the unconventional monetary policy is tapering off, its effect on long-term yields and the yield curve will still be present.
… limiting the yield curve’s signaling power.
Now, this is not to say that the term premium cannot increase from here. On the contrary, the term premium is time-varying and there are other factors that can help balance the effects discussed above. My point is that due to the nature of time-varying term premia, it might prove difficult to extract market participant’s expectations for the trajectory of future monetary policy embedded in long-term rates. It is, after all, this information that would tell us whether or not market participants expect a recession in the future. In addition, well-anchored inflation expectations and the persistent effects of the unprecedented large scale asset purchases conducted by central banks, points in the direction of a flatter yield curve than what has historically been the case. Hence, great caution is warranted in applying historical experience of the yield curve’s predicting evidence to the current situation.
Look to the forward market…
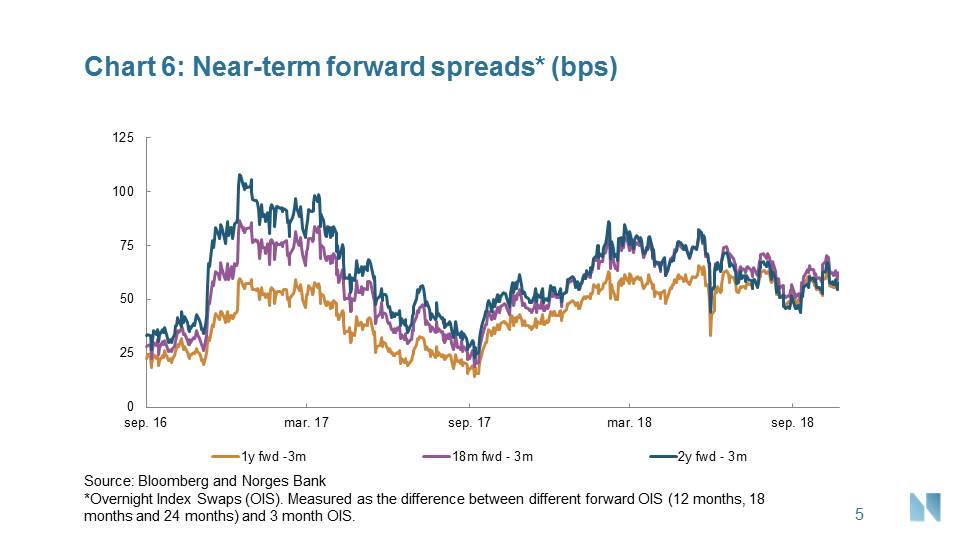
So, is this to say that the slope of the curve doesn’t matter when it comes to predicting a downturn in the economy? Not necessarily. But there is nothing in long-term yields at present signaling heightened recession risk in the US. In order to gauge the market’s recession probability, one should instead turn to the forward market. Forwards are valuable in the sense that they don’t express the average expected short-term rate over a given horizon. Instead, they capture the expected short-term rate at a given point in time in the future, in addition to a term premium. By examining near-term forward spreads, i.e. the difference between forward rates on a near-term horizon and current short-term rates, one can get a sense of market participant’s expectations for the trajectory for conventional monetary policy over the coming years. If the spread is positive, it reflects expectations that short-term rates will be lifted in the near-term. If it’s negative, it implies that the market expect monetary policy to become more accommodative. In other words, the spread should be in negative territory if market participants were to expect a forthcoming recession.
… and you shall see limited probabilities for an economic downturn in the near-term.
As evident in chart 6, this is not the case. On the contrary, near-term spreads are far from in inverted territory. On the contrary, the spreads are upward sloping as market participants are expecting Fed to continue with gradual increases in the funds rate over the near-term.
Even though there exists a striking correlation between an inverted yield curve and recessions, one must keep in mind that correlation is not causation. An inverted yield curve does not cause recessions. The yield curve’s signaling power, when it comes to predicting recessions, lies first and foremost in the implied expectations for future short-term rates embedded in longer-dated yields. As pointed out several times, these expectations might be hard to extract as time-varying term premia clouds the information value embedded in long-term yields and hence degrading their forecasting power when it comes to projecting recessions. Great caution is therefore warranted in interpreting the yield curve’s predicting evidence. When trying to gauge whether market participants expect a recession or not, different measures of near-term forward spreads acts as a better metric than the yield curve. As shown above, there is nothing in those spreads that should suggest an elevated likelihood that market participants expect an economic downturn over the coming years.

0 Kommentarer
Kommentarfeltet er stengt